Gas Charging Review (UNC621) - Analytical support - DATE: CLIENT: Ofgem 20/12/2018
←
→
Page content transcription
If your browser does not render page correctly, please read the page content below
Gas Charging Review (UNC621) –
Analytical support

CLIENT:   Ofgem
DATE:     20/12/2018
Version History
  Version                       Date                                   Description                                                                Prepared by                                           Approved by
  1.2                           13/12/2018                             Final                                                                      Vladimir Parail                                       Duncan Sinclair
                                                                                                                                                  Manon Derelle

Contact

Duncan.Sinclair@baringa.com +44 203 327 4220

Vladimir.Parail@baringa.com                                                   +44 203 763 4813

Limitation Statement
This report has been prepared by Baringa Partners LLP or a Baringa group company (“Baringa”) for
Ofgem ("Clients") and has been designed to meet the agreed requirements of Clients as contained in
the relevant contract between Baringa and Clients. It is released to Clients subject to the terms of
such contract and is not to be altered or modified without Baringa's prior written consent.
Information provided by others (including Clients) and used in the preparation of this report is
believed to be reliable but has not been verified and no warranty is given by Baringa as to the
accuracy of such information unless contained in such contract. Public information and industry and
statistical data are from sources Baringa deems to be reliable but Baringa makes no representation
as to the accuracy or completeness of such information which has been used without further
verification. This report should not be regarded as suitable to be used or relied on by any party other
than Clients unless otherwise stated in such contract. Any party other than Clients who obtains
access to this report or a copy, and chooses to rely on this report (or any part of it) will do so at its
own risk. To the fullest extent permitted by law, Baringa accepts no responsibility or liability in
respect of this report to any other person or organisation other than Clients unless otherwise stated
in such contract. If any of these terms are invalid or unenforceable, the continuation in full force and
effect of the remainder will not be prejudiced. Copyright © Baringa Partners LLP 2018. All rights
reserved.

Gas Charging Review (UNC621) – Analytical support                                                                                                                                                                       2
Baringa Partners LLP is a Limited Liability Partnership registered in England and Wales with registration number OC303471 and with registered offices at 3rd Floor, Dominican Court, 17 Hatfields, London SE1 8DJ UK.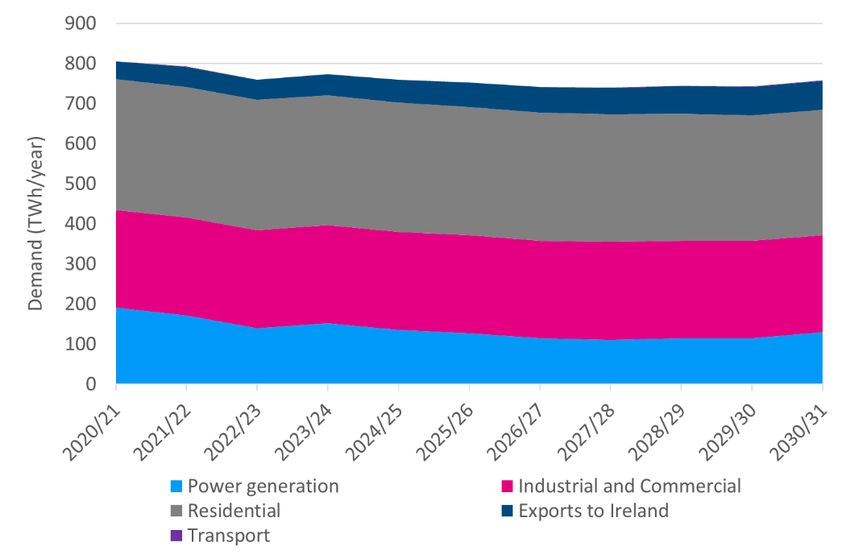
Contents

1   Executive summary ............................................................................................................... 4
2   Introduction ......................................................................................................................... 8
3   Methodology ........................................................................................................................ 9
  3.1    Overview ............................................................................................................................ 9
  3.2    Gas tariff modelling.......................................................................................................... 10
  3.3    Gas market modelling ...................................................................................................... 14
  3.4    Economic impact assessment .......................................................................................... 19
4 Results................................................................................................................................ 20
  4.1    Distributional analysis ...................................................................................................... 20
  4.2    Wider system impact analysis.......................................................................................... 39
5 Investment and closure analysis .......................................................................................... 47
  5.1    Overview .......................................................................................................................... 47
  5.2    CCGT generators .............................................................................................................. 47
  5.3    Bi-directional interconnector ........................................................................................... 51
  5.4    Storage facilities ............................................................................................................... 52
6 Qualitative analysis ............................................................................................................. 54
  6.1    Security of supply ............................................................................................................. 54
  6.2    Impact of interruptible discounts .................................................................................... 54
  6.3    Differentiation in long- and short-term capacity products.............................................. 55
  6.4    Appropriateness of proposed cost drivers ...................................................................... 55
Appendix A Detailed modelling results .................................................................................... 57
Appendix B Wholesale market scenarios ................................................................................. 60
  B.1    Overview .......................................................................................................................... 60
  B.2    Baseline scenario ............................................................................................................. 60
  B.3    Norwegian Continental Shelf (NCS) scenario................................................................... 61
  B.4    Inelastic interconnector scenario .................................................................................... 62
  B.5    Two Degrees scenario ...................................................................................................... 63

Gas Charging Review (UNC621) – Analytical support                                                                                                                                                                       3
Baringa Partners LLP is a Limited Liability Partnership registered in England and Wales with registration number OC303471 and with registered offices at 3rd Floor, Dominican Court, 17 Hatfields, London SE1 8DJ UK.
1                          Executive summary
Introduction
The European Network Code on harmonised transmission tariff structures for gas (TAR NC) is a set of
harmonised gas transmission tariff structures that took effect in April 2017 and applies directly in all
Member States. To implement the TAR NC in GB, National Grid Gas (NGG) raised UNC621 to modify
the charging arrangements in the Uniform Network Code (UNC), and eleven proposals were made to
replace the current charging methodology.

Baringa was asked by Ofgem to undertake quantitative and qualitative analysis of a number of tariff
methodology options to inform its impact assessment of the potential options for gas transmission
charging.

Methodology
Our methodology for the analysis is composed of the following elements:
               1.          Gas tariff modelling: calculation of tariffs under different gas transmission tariff
                           methodology options and quantitative assessment of the distributional impact of changes
                           in tariffs on different NTS users.
               2.          Gas market modelling: identification of changes in wholesale gas market flows and
                           wholesale gas prices resulting from changes in the gas transmission tariff methodology
                           options and consequent supply and demand response.
               3.          Wider system impact analysis: quantitative and qualitative assessment of potential
                           impacts of changes in the tariff methodology on customer costs and other factors. This
                           analysis draws on the outputs of tariff and gas market modelling.

Our assessment determines outcomes under different tariff methodology options, namely:
               Capacity Weighted Distance (CWD), based on Mod 621 as proposed by National Grid;
               CWD square root, using the square root of the distance in the CWD methodology;
               Postage stamp, dividing revenue recovery equally across Forecasted Contracted Capacity;
               CWD obligated capacity, using obligated capacity instead of Forecasted Contracted Capacity in
               the CWD methodology;
               CWD interconnector discount, applying a 50% discount to bi-directional interconnectors in the
               context of the CWD methodology;
               CWD storage discount, raising discount on storage facilities from 50% to 86% in the context of
               the CWD methodology; and
               Status quo, based on average historical tariffs, taking into account short-haul and other
               arrangements.

Gas Charging Review (UNC621) – Analytical support                                                                                                                                                                       4
Baringa Partners LLP is a Limited Liability Partnership registered in England and Wales with registration number OC303471 and with registered offices at 3rd Floor, Dominican Court, 17 Hatfields, London SE1 8DJ UK.
Gas tariff modelling and distributional analysis Our distributional analysis assesses the tariff variation at each exit point under all options, by point category, and the variation in tariff bills for a set of Residential, Industrial and Commercial and Power station user archetypes. For Power stations and Industrial and Commercial users, we assume that the low archetype is connected to the distribution network while the high archetype is directly connected to the transmission system. Tariff dispersion – Tariff modelling shows that tariff dispersion (the degree of variation in tariffs across locations) is higher under the Status quo methodology than under alternative tariff methodology options. Therefore, a move towards alternative options considered in this study reduces tariff dispersion. A comparison of the CWD option against other alternatives shows that CWD with storage and interconnector discounts are broadly aligned with the CWD option, and that tariff dispersion further reduces under CWD square root and CWD obligated capacity. Finally, tariff dispersion, by definition, is zero under the Postage stamp option. Impact on bills for residential, industrial and commercial users and power stations – Tariff costs for demand calculated under alternative tariff methodology options are significantly different from Status quo tariffs. The options most different from the Status quo are Postage stamp and CWD obligated capacity. This is explained by the fact that Status quo has the highest tariff dispersion across different users and Postage stamp and CWD obligated capacity options have zero or low tariff dispersion. Alternative tariff methodology options generally result in higher tariff bills for GDN-connected users and lower tariff bills for transmission-connected users. Regional impact – Our analysis shows that regions in which Status quo tariffs are particularly low generally face tariff increases when moving to tariff methodology options in which tariffs are recovered more evenly across the system (e.g. Postage stamp and CWD obligated capacity). Additionally, regions that benefit from their relative proximity to large entry points under the CWD option face higher tariffs when the weighting assigned to distance from large entry points is lower as in the CWD square root and Postage stamp options. Gas market modelling and wider system impacts In order to assess the potential effects of changes in gas tariff methodology on consumer welfare and flows at different entry and exit points, we combine tariff modelling with modelling of the GB wholesale gas market. To test the robustness of our results to changes in key modelling assumptions, we compute outcomes for all tariff methodology options under a number of alternative wholesale market scenarios: the Baseline, Norwegian Continental Shelf (NCS) (high price responsiveness of NCS), Inelastic interconnector (increased competitiveness of LNG imports, reduced price responsiveness of interconnector imports), and Two degrees (lower gas demand, higher gas supply). Our results indicate that changes in the total cost of gas consumed tend to account for the bulk of the estimated consumer welfare impact in the vast majority of modelled scenarios, years and tariff methodologies. The difference in estimated consumer welfare between the Status quo and alternative tariff methodology options varies to a significant degree depending on the modelled wholesale market scenario. This is due to the fact that, in our modelling, tariff changes on the Gas Charging Review (UNC621) – Analytical support 5 Baringa Partners LLP is a Limited Liability Partnership registered in England and Wales with registration number OC303471 and with registered offices at 3rd Floor, Dominican Court, 17 Hatfields, London SE1 8DJ UK.
marginal supply source flow into the wholesale price, and the identity of the marginal supply source
can vary depending on the modelled wholesale market scenario. Hence, none of the modelled tariff
methodologies are seen to achieve a clear improvement or deterioration in consumer welfare
relative to the Status quo in all of the modelled scenarios.

Notwithstanding significant uncertainty around future conditions in the European and global gas
markets, and the interactions of those conditions with the effect of differences in gas tariff
methodologies on wholesale prices, a useful message from our modelling results is that levying
higher charges on marginal supplies can have a significant impact on wholesale gas prices and
therefore on consumer welfare.

Investment and closure analysis
Potential longer-term effects of changes in entry and exit tariffs include closure of existing gas
infrastructure or change in location of new gas infrastructure. We analyse these potential effects for
CCGTs, interconnectors, and gas storage.

CCGTs – We find that the choice of gas tariff methodology is unlikely to significantly influence the
probability of retirement for existing CCGTs or the location of new CCGTs. The move towards full
recovery of network revenue from capacity charges is expected to favour large-scale transmission-
connected gas generation over smaller-scale distributed gas generation. However, the impact is
likely to be small relative to the impact of Ofgem’s ongoing reforms to electricity network charging.

Interconnectors – Our modelling does not suggest that changes in tariff methodology are likely to
lead to closure of interconnectors while they are operational. Interconnectors’ capacity to invest in
additional infrastructure or refurbishment could potentially be influenced by the tariff methodology
and the tariffs levied on interconnectors, although this also applies to other elements of gas
infrastructure.

Storage – Our analysis finds that under a number of alternative tariff methodologies, storage
facilities may face a significant reduction in revenues, although the effect of changes in gas
transmission tariffs is small relative to the potential effects of changes in wider gas market
conditions. If operating costs are sufficiently low, storage facilities are likely to remain open under
any of the tariff methodology options analysed in this report. However, revenues may be insufficient
to justify significant further investment, including refurbishment costs.

Qualitative analysis
Finally, we undertake a qualitative assessment of a number of questions related to our analysis,
largely informed by economic theory and by the quantitative analysis we have done for this report.

Security of supply – Our analysis suggests that closure of existing interconnection, storage or gas
generation capacity as a result of changes to the methodology for gas transmission charging is very
unlikely in the shorter-term. However, there may be challenges with significant new capital
investment for new projects, or for existing projects requiring significant refurbishment expenditure.
Overall, our view based on the work we have done, is that it is not possible to say that a given tariff
methodology is likely to be more favourable for security of gas supply than other tariff
methodologies.

Gas Charging Review (UNC621) – Analytical support                                                                                                                                                                       6
Baringa Partners LLP is a Limited Liability Partnership registered in England and Wales with registration number OC303471 and with registered offices at 3rd Floor, Dominican Court, 17 Hatfields, London SE1 8DJ UK.
Impact of interruptible discounts – Discounts for interruptible capacity contracts are equivalent to
charging lower tariffs for network access in periods of off-peak demand than in peak periods. The
economic rationale for this is that the cost of the transmission network is determined by its peak
capacity, and hence charges for network access should be proportional to peak usage. However,
arguments for cost-reflective charging for network access are, in our view, less relevant when overall
demand is declining and investment in network capacity expansion is unlikely to be required. Hence,
the rationale for significant discounting of interruptible capacity is not strong.

Differentiation in long- and short-term capacity products – Our view is that offering a variety of
capacity products in terms of product tenor is useful to ensure that the gas market functions
efficiently and that users whose demand for network access does not fit the ‘baseload’ profile are
not disadvantaged.

Appropriateness of proposed cost drivers – On the choice of Reference Price Methodology, our view
is that the economic rationale for the CWD or CWD square root methodology is not necessarily
stronger than for the Postage stamp methodology if gas network tariffs are viewed predominantly as
cost recovery charges. On Forecasted Contracted Capacity, we see no economic rationale for basing
tariff calculations on a historic measure of capacity (i.e. obligated capacity) that does not match
expected future capacity bookings. Finally, the appropriate rationale for offering a higher tariff
discount to storage is avoidance of double charging. For bi-directional interconnectors, the rationale
for offering a tariff discount is flexibility, which can also be provided (arguably to a lesser extent) by
other supply sources. Hence, in our view, the economic case for offering a tariff discount to bi-
directional interconnectors is not the same as for storage.

Conclusion
Overall, the choice of gas transmission charging methodology is defined by the choice of how to
allocate the cost of the transmission network among its users while minimising market distortions
and significantly inequitable distributional outcomes. In this regard, distributional analysis of
different tariff methodologies is as, or more, important than analysis of potential changes to
consumer welfare.

Gas Charging Review (UNC621) – Analytical support                                                                                                                                                                       7
Baringa Partners LLP is a Limited Liability Partnership registered in England and Wales with registration number OC303471 and with registered offices at 3rd Floor, Dominican Court, 17 Hatfields, London SE1 8DJ UK.
2                          Introduction
Ofgem launched the Gas Transmission Charging Review (GTCR) in June 2013 due to significant and
ongoing changes to the patterns of gas flows in the National Transmission System (NTS) and the
concurrent development of the European Network Code on harmonised transmission tariff
structures for gas (TAR NC). In 15 November 2015, Ofgem concluded the GTCR by confirming its
policy view and next steps (to prepare to implement the TAR NC).

The TAR NC1 took effect in April 2017. It is the fourth European network code in the gas sector,
supplementing and forming an integral part of the Gas Regulation and is one component of the
Internal Energy Market. The TAR NC includes harmonised rules on cost allocation assessments, the
application of a reference price methodology and calculation of reserve prices for standard capacity
products. Developed under the Third Energy Package2, with particular reference to Article 13, these
common rules aim to foster greater market integration, enhance security of supply and promote
greater interconnections between gas networks. In short, the TAR NC is a set of harmonised
transmission tariff structures for gas that applies directly in all Member States.

The current approach to gas transmission charging in GB is based on the incremental cost of
expanding the network at different locations. To implement the TAR NC in GB, National Grid Gas
(NGG) raised UNC621 to modify the charging arrangements in the Uniform Network Code (UNC) with
the aim of better meeting the relevant charging objectives and deliver compliance with TAR NC.
Through discussions with the UNC Workgroup eleven different proposals were made to replace the
current charging methodology.3

Ofgem requires analysis of the costs and benefits of the alternative proposals to provide evidence for
its impact assessment. To inform this, Baringa has been asked to undertake quantitative and
qualitative analysis of a number of tariff methodology options.

The rest of this document is structured as follows:
                           In Section 3, we outline our methodology for the assessment;
                           In Section 4, we present the results of our distributional analysis, wholesale gas market
                           modelling and wider system impact assessment;
                           In Section 5, we assess the potential impacts of different tariff options on the decisions of
                           owners and developers of key infrastructure assets to close or to change the location in
                           which they develop their assets; and
                           In Section 6 we address a number of considerations that are not covered by our
                           quantitative analysis.

1
  Regulation 460/2017.
2
  Directive 2009/73/EC and Regulation 715/2009.
3
  UNC621/A/B/C/D/E/F/H /J/K/L. We note UNC621G was later withdrawn by the Proposer.

Gas Charging Review (UNC621) – Analytical support                                                                                                                                                                       8
Baringa Partners LLP is a Limited Liability Partnership registered in England and Wales with registration number OC303471 and with registered offices at 3rd Floor, Dominican Court, 17 Hatfields, London SE1 8DJ UK.
3 Methodology
3.1 Overview
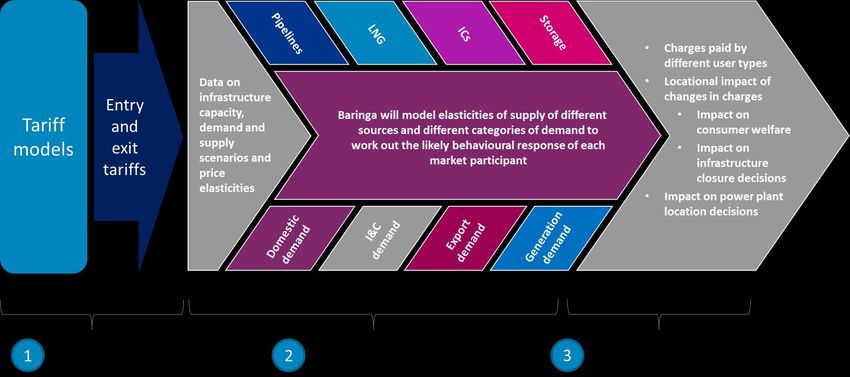
Our methodology for the analysis is composed of three main steps and summarised in Figure 1:
1. Gas tariff modelling: calculation of tariffs under different gas transmission tariff
methodologies and a quantitative assessment of the distributional impact of changes in
tariffs on different NTS users.
2. Gas market modelling: the identification of changes in wholesale gas market flows and
wholesale gas prices resulting from changes in the gas transmission tariff methodology
and consequent supply and demand response.
3. Wider system impact analysis: a quantitative and qualitative assessment of potential
impacts of changes in the tariff methodology on customer costs and other factors. This
analysis draws on the outputs of the tariff and gas market modelling.
Figure 1: Overview of Baringa’s modelling methodology
Gas tariff and market modelling is undertaken on an iterative basis, as illustrated in Figure 2. This is
done because of the two-way relationship between modelled tariffs and flows. Flows affect tariffs
since they determine bookings and are the denominator in the calculation of tariffs. Tariffs affect
flows since they determine the marginal cost of supply and demand and changes in tariffs can
prompt supply and demand response.
Gas Charging Review (UNC621) – Analytical support 9
Baringa Partners LLP is a Limited Liability Partnership registered in England and Wales with registration number OC303471 and with registered offices at 3rd Floor, Dominican Court, 17 Hatfields, London SE1 8DJ UK.Figure 2 Interaction of gas tariff and market modelling 1. Tariff model used to calculate an initial set of tariffs on the basis of historical bookings and flows. Tariffs are calculated on a flow basis using assumptions about the ratio of capacity bookings to commodity flows. 2. Tariffs for each entry and exit point are input into the wholesale market model to calculate wholesale gas market prices and gas flows at different entries and exits at a daily level. The market model calculates gas flows at every entry and exit point to the gas transmission system. 3. Gas flows from the wholesale market model are input back into the tariff model and an updated set of tariffs are calculated to recover the whole of the network allowed revenue. 4. The difference between old and new tariff is calculated to check for convergence. If new tariffs are noticeably different from tariffs calculated in the previous iteration – go to step 2 and feed new tariffs into the gas market model. If old and new tariffs have converged – record the tariffs and gas market model outputs as the final result.4 3.2 Gas tariff modelling 3.2.1 Overview of modelled tariff options The purpose of our analysis is to compare the key features of different gas transmission charging methodologies. To better inform Ofgem’s decision, we model Mod 621 as proposed by National Grid and options based on modifying one aspect of 621, such as the Reference Price Methodology (RPM), the discount for storage, or whether the Optional Commodity Charge is available in the transition period, in order to identify the impacts of that change in tariff model design on tariffs paid by different transmission system users, gas flows, consumer welfare, and broader gas market metrics. This approach enables the identification of key desirable features of a tariff methodology. The variations of the tariff methodology considered in our assessment, which have been agreed with Ofgem, are set out in Table 1. 4 If full convergence is not achieved, which happens in some cases, any remaining difference is accounted for in our CBA results. Gas Charging Review (UNC621) – Analytical support 10 Baringa Partners LLP is a Limited Liability Partnership registered in England and Wales with registration number OC303471 and with registered offices at 3rd Floor, Dominican Court, 17 Hatfields, London SE1 8DJ UK.
Table 1 Modelled tariff methodology options
Capacity Additional
Bi-directional
used for Storage revenue Optional
Option RPM interconnector
tariff discount recovery charge
discount
calculation charges
CWD Capacity Forecasted 50% 0% None No
Weighted Contracted
Distance Capacity5
CWD square Capacity Forecasted 50% 0% None No
root Weighted Contracted
Square Root Capacity
of Distance
Postage stamp Postage Forecasted 50%6 0% None No
stamp Contracted
Capacity
CWD Capacity Obligated 50% 0% Commodity No
obligated Weighted capacity charge in
capacity Distance transition
period and
CWD Capacity Obligated 50% 0% capacity In
obligated Weighted capacity charge in transition
capacity OCC Distance enduring period -
period7 limited to
60km
CWD Capacity Forecasted 50% 50% None No
interconnector Weighted Contracted
discount Distance Capacity
CWD storage Capacity Forecasted 86% 0% None No
discount Weighted Contracted
Distance Capacity
Status quo Long-Run Capacity Storage 0% Commodity Yes – not
Marginal tariffs fixed exempt charge distance
Cost at historical from limited
average commodity
rates charges
5
Forecasted Contracted Capacity is defined as the forecast of bookings at each entry and exit point that is used
to calculate capacity tariffs.
6
We note that the proposed modification that includes Postage stamp tariffs also specifies an 86% tariff
discount for storage. We expect that incorporating a higher storage discount in the context of Postage stamp
tariffs would have a similar effect to incorporating a higher storage discount in the context of CWD tariffs.
7
The transition period is defined as gas years 2019/20 and 2020/21. The enduring period is defined as the
period that follows the transition period. We note that UNC0621B has a commodity-based charge in the
enduring period, which is different from the approach taken in our modelling.
Gas Charging Review (UNC621) – Analytical support 11
Baringa Partners LLP is a Limited Liability Partnership registered in England and Wales with registration number OC303471 and with registered offices at 3rd Floor, Dominican Court, 17 Hatfields, London SE1 8DJ UK.3.2.2 Tariff models used for the assessment
Modelling of RPMs and RPM parameters using the National Grid model
For our modelling of gas tariffs and variants of the tariff methodology, we have used the MS Excel
tariff models that have been created by National Grid as part of the process of documenting all of the
proposed modifications to the gas transmission tariff methodology.8 While the initial models were
largely complete, a number of modifications were needed to make them suitable for deployment in
our analysis. In order to have a master model enabling to test the various parameters of the
assessment, we asked National Grid to use its 0621 model and integrate the following changes:
1. Modify such model to enable testing of the 3 different RPMs in the same model (i.e. CWD,
CWD square root and Postage stamp), additional to more specific parameters such as
Forecasted Contracted Capacity or capacity discounts;
2. Add the functionalities needed to undertake dynamic analysis, i.e. an iteration between the
outputs of the tariff models described in this Section and Baringa’s wholesale market model
described in Section 3.3. More specifically, we have asked National Grid to enable tariffs to
be determined on the basis of updated flows as calculated in Baringa’s wholesale market
model, whilst still ensuring revenue recovery.
Booking to flow ratio
In our approach to the analysis, the wholesale market model determines flows, whereas the tariff
models determine tariffs on a bookings basis. This is described in Section 3.1. For the two models to
work together, a relationship between bookings and flows needs to be defined.
In the context of modelling a forward-looking equilibrium in the alternative tariff methodology
options, we assume that market participants’ expectations are accurate and that they book exactly
the capacity required for their demand and supply levels.9 This assumption does not apply to GDNs,
who interpret their licence as requiring them to book enough capacity to meet 1-in-20-year demand
levels. For GDN exit points, we assume a booking to flow ratio of 2.88 based on historical data. It
also does not apply to modelling of the Status quo, where we use alternative assumptions as set out
below.
Modelling of CWD obligated capacity option
The CWD obligated capacity option requires additional revenue recovery charges because capacity
tariffs are calculated on the basis of obligated capacity level but recovered on the basis of actual
bookings, which are different and lower on average. In addition to capacity charges, a commodity
revenue recovery charge is applicable during the transition period and an additional capacity revenue
charge is applicable in the enduring period under this option. These are calculated on the basis of
actual flows and Forecasted Contracted Capacity respectively.
8
See https://www.gasgovernance.co.uk/0621/Models
9
Differences between capacity bookings and commodity flows can be expected to occur when there is a
mismatch between expectations and outturn. While we would expect such mismatches to happen frequently,
we think it is reasonable to assume that they would average to zero in the long-run.
Gas Charging Review (UNC621) – Analytical support 12
Baringa Partners LLP is a Limited Liability Partnership registered in England and Wales with registration number OC303471 and with registered offices at 3rd Floor, Dominican Court, 17 Hatfields, London SE1 8DJ UK.Treatment of existing contracts
Under all modelled scenarios, our modelling assumes that existing contracts are priced at their
existing values and that holders of these contracts do not pay any additional capacity charges.
Revenues associated with existing contracts are subtracted from the total revenue requirement, and
the relevant capacity bookings are also subtracted from Forecasted Contracted Capacity in the
calculation of capacity tariffs for users who are not in possession of existing capacity contracts. For
the gas year 2020/21, existing entry contracts amount to 3.88 TWh/d and revenue of £60m.10 For
the gas year 2030/31, existing entry contracts amount to 0.67 TWh/d and revenue of £0.4m.
Being in possession of an existing capacity contract does not exempt a user from commodity charges.
Hence, depending on the modelled tariff methodology and whether a significant proportion of the
total revenue requirement is recovered through commodity charges, the average tariff payments by
holders of existing contracts and by users without an existing contract can vary substantially. This is
explored in more detail in Section 4.1.5.
Status quo modelling
In order to undertake analysis of potential changes in tariffs for different transmission system users,
as well as potential changes in consumer welfare and broader wholesale gas market indicators, we
have built a stylised dynamic model of the Status quo, such that tariffs are adjusted and revenue
requirements are met under updated sets of flows. This allows us to make comparisons between the
current tariff regime and alternative options on a like-for-like basis, under identical market
conditions and tariffs set to recover the full network revenue requirement. The comparison includes
analysis of tariffs paid by different user types, analysis of differences in consumer welfare, and
analysis of changes in system gas flows, as a result of changes in gas tariff methodology.
We have based our modelling on point-specific Status quo tariff data provided by National Grid. For
each entry and exit point, National Grid provided data on historical flows, historical firm and
interruptible capacity bookings, together with capacity revenues. Our modelling of the Status quo
assumes that capacity charges seen in 2017/18 are fixed for Status quo model runs for 2020/21 and
subsequent years. Revenue recovery is achieved through a commodity charge.
The Status quo modelling steps are as follows:
1. Based on the data provided by National Grid, we derive (i) 2017/18 capacity tariffs, and (ii)
ratios of historical bookings to flows.11
2. Using flows determined in our wholesale market model, we determine the level of bookings
using the booking to flow ratio, which is derived as set out in point 1.(ii) above.
3. We multiply Status quo capacity tariffs (as calculated in point 1.(i) above) by capacity
bookings to obtain total revenue recovered through capacity charges.
10
Data provided by National Grid.
11
These ratios differ from those used for modelling of alternative tariff methodology options because they are
based on historical data bookings and flows under Status quo tariffs, whereas under the alternative options,
bookings and flows are assumed to match for all users except DNOs on the assumption that, on average,
Forecasted Contracted Capacity will match flows. The bookings taken into account in the calculation of the
booking to flow ratios are firm bookings only, because interruptible bookings are free and therefore not
informative. Capacity tariffs are derived by dividing total tariff revenue by total firm capacity bookings. This
approach aggregates different types of firm capacity products.
Gas Charging Review (UNC621) – Analytical support 13
Baringa Partners LLP is a Limited Liability Partnership registered in England and Wales with registration number OC303471 and with registered offices at 3rd Floor, Dominican Court, 17 Hatfields, London SE1 8DJ UK.4. We then compare this revenue to the revenue requirement, and recover any shortfall
through a commodity charge.
The steps set out above lead to one set of capacity charges across all modelled years and all gas
market scenarios. However, commodity tariffs will vary depending on flows and required network
revenue to ensure that the total network revenue requirement is always met.
Our modelling also ensures that bookings and revenues associated with existing contracts are
excluded from total bookings and revenue requirements. This applies to all capacity contracts as of
2017/18 which are recorded in the database provided to Baringa by National Grid. Finally, storage
does not pay the commodity charge in our Status quo modelling as is the case under current
arrangements.
NTS Optional Commodity Charge (‘OCC’) modelling
OCC, also known as the short-haul charge, is a charge that can be paid by NTS users as an alternative
to the commodity charges (TO and SO commodity charges) under existing charging arrangements.
When the OCC rate is cheaper than the corresponding commodity charge, eligible NTS users are
likely to pay the OCC. Under the alternative tariff methodology options, OCC is only assumed to be
available under the Obligated capacity option in the transition period as an alternative to the
commodity revenue recovery charge, and is subject to a 60 km distance limit.
National Grid provided data to Baringa on historical OCC rates and flows for each relevant entry and
exit point. To estimate whether users at a given entry or exit point would opt for the OCC instead of
paying commodity charges, we compared the applicable OCC rates to the commodity charge for each
possible pairing of entry and exit points, and assume that users would always choose the lower
charge. As the next step, we calculate the revenue shortfall arising from users paying the OCC as
opposed to the higher commodity or revenue recovery charge and uprate the charge paid by other
users at entries and exits by the amount that ensures that revenue recovery is maintained.
3.3 Gas market modelling
Baringa’s wholesale gas market model is built around an optimisation framework which mimics
market operation. It minimises the cost of meeting gas demand in the UK given assumptions on the
availability of supply and demand flexibility and the associated cost. Using inputs on demand and
supply forecasts, together with estimates of price elasticity of various demand and supply sources,
our model determines the clearing price and the balance of supply and demand at a daily level.
In our wholesale market model, we represent the different entry and exit point types though the
categories summarised in Table 2. These categories match the categories represented in National
Grid’s tariff models.
Gas Charging Review (UNC621) – Analytical support 14
Baringa Partners LLP is a Limited Liability Partnership registered in England and Wales with registration number OC303471 and with registered offices at 3rd Floor, Dominican Court, 17 Hatfields, London SE1 8DJ UK.Table 2: Demand and exit point types in the wholesale market model
Demand (exit) Supply (entry)
Transmission-connected Industrial and
Beach terminals
Commercial (I&C)
Transmission-connected Power station Onshore fields
Storage exit LNG import
GDN Storage entry
Interconnector exit Interconnector entry
3.3.1 Demand and supply forecasts
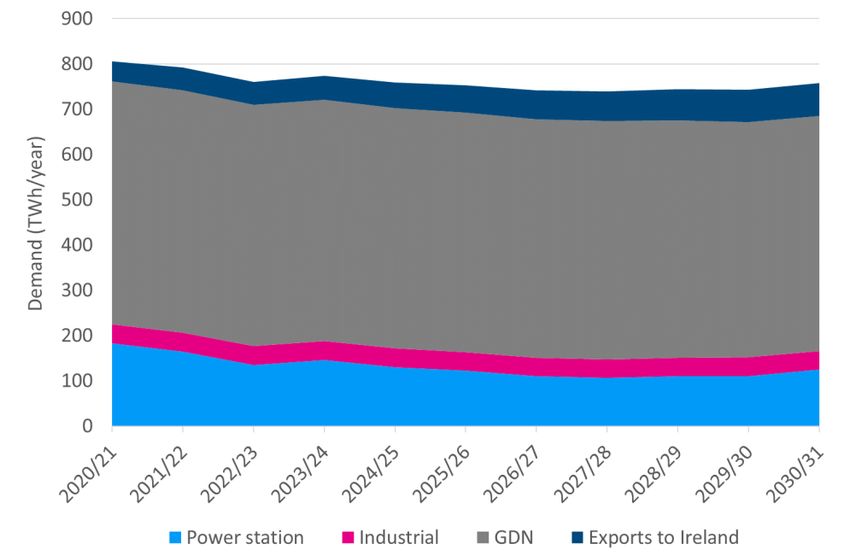
Our demand assumptions are based on a blend of the National Grid Future Energy Scenarios (FES)
2018, which contains long-term demand scenarios by final user type (e.g. Residential, Industrial and
Commercial, and Exports to Ireland), and the National Grid Gas Ten Year Statement (GTYS), which
contains long-term demand forecasts by point type (as presented in Table 2). Where a timing
difference occurs in the definition of years used in National Grid tariff models, FES, and GTYS, a year
marked as 2020/21 is assumed to respond to 2020 calendar year.
Figure 3 shows our annual demand assumptions split by type of exit.
Figure 3 Annual demand by exit type
For the purposes of our gas market modelling, we also need to determine the composition of GDN
demand between Residential, Industrial and Commercial, Power station and Transport because
Gas Charging Review (UNC621) – Analytical support 15
Baringa Partners LLP is a Limited Liability Partnership registered in England and Wales with registration number OC303471 and with registered offices at 3rd Floor, Dominican Court, 17 Hatfields, London SE1 8DJ UK.different types of users react differently to changes in price signals. We establish a mapping
between FES and GTYS scenarios and identify the proportions of GDN demand attributable to
different user categories. More specifically, mapping of latest historical demand figures involves the
following steps: (i) demand from GDN-connected Industrial and Commercial users is identified by
taking total Industrial and Commercial demand in FES and subtracting transmission-connected
Industrial and Commercial demand in GTYS; 12 (ii) Residential and Transport demand is assumed to be
distribution-connected , and (iii) demand from distribution-connected Power stations is the residual
GDN demand once other components have been estimated. For future years, historical values for
each demand component are assumed to grow proportionally with the corresponding category in
the FES scenarios.
Figure 4 shows our annual demand assumptions split by user type. As an example of the effect of
mapping GDN demand to different user types, Industrial and Commercial demand in Figure 4 is
significantly greater than transmission-connected Industrial demand in Figure 3 because Figure 4
incorporates GDN-connected Industrial and Commercial demand.
Figure 4 Annual demand by user type
As in the distributional analysis framework, each exit point is represented in the wholesale market
model, and associated final demand is mapped to those points. We attribute the demand forecasts
to individual points based on their share of total demand in their exit point category in the gas year
2017-18, assuming these shares remain constant over time. For example, for Residential demand,
we take total Residential demand and divide it up among the different GDN exits according to their
historical share of total GDN gas exit flow.
12
Total demand in FES and GTYS are scaled in order to avoid any discrepancy between sources.
Gas Charging Review (UNC621) – Analytical support 16
Baringa Partners LLP is a Limited Liability Partnership registered in England and Wales with registration number OC303471 and with registered offices at 3rd Floor, Dominican Court, 17 Hatfields, London SE1 8DJ UK.Our Baseline long-term demand and supply assumptions are as defined in the Steady Progression
scenario, but we run a scenario in which long term gas demand projections are based on the Two
Degrees scenario.13
Baringa’s supply forecasts are based on the GTYS statement, which provides point-level forecasts to
2039/40 for most entry points. This is the case for beach terminals, which we are able to use directly
in our analysis on an annual level, applying historic seasonal variation to annual forecasts to derive
daily flows. For onshore fields, the GTYS only provides forecasts for the category, which we then
attribute to individual fields based on their share of historical production. 14
Interconnector flows are capped at interconnector capacity and determined in our wholesale model
based on the relation between system price calculated in our model and prices in interconnected
markets. The methodology for determining supply pricing is set out in Section 3.3.2. When the
system price is lower than the price in the interconnected markets, interconnectors are likely to
export and vice versa.15 The same methodology is applied to LNG import terminals but without the
possibility to export.
Finally, storage flows are optimised within our model on the basis of minimising the cost of meeting
demand over the course of the year and variable costs of storage injection and withdrawal, which
include entry and exit tariffs. In order to make different model parameters comparable, storage in
the model starts from the same level in every model run and must end the year at the same level.
3.3.2 Price elasticities and tranches of supply and demand
Each source of demand and supply also has an elasticity associated with it, such that changes in
tariffs, as well as other wholesale market model dynamics, can change demand and supply at
different exit and entry points. For demand, a degree of price elasticity reflects the fact that certain
gas users would decide to turn down their demand as prices increase beyond their Value of Lost Load
(VoLL), while other users would exhibit little responsiveness to price changes. Similarly, some supply
sources would change production or deliveries in response to price changes, while others may not do
so due to technical constraints, their cost structure, or existing contractual arrangements.
For supply, we determine price responsiveness based on analysis of historical data:
Interconnector price elasticity is determined based on regression analysis of IUK flows against
the NBP-ZEE price spread16 using recent historical data.
LNG price elasticity is determined based on the increase in LNG supply that occurred during a
NBP price spike in early 2018.17
13
Because demand and supply differences between are only noticeable in the long-run, we model this scenario
for the gas year 2030/31.
14
National Grid data with daily granularity, between 2013 and 2018. Available at http://mip-prod-
web.azurewebsites.net/DataItemExplorer and extracted on 16 September 2018.
15
BBL is assumed to have reverse flow capability by 2020/21.
16
This is the price differential between gas traded at the British National Balancing Point (NBP) and Belgian
Zeebrugge (ZEE) gas hubs.
17
Since the price spike was caused by factors independent of LNG supply, this approach avoids the potential
endogeneity bias from regressing changes in prices on changes in physical supply.
Gas Charging Review (UNC621) – Analytical support 17
Baringa Partners LLP is a Limited Liability Partnership registered in England and Wales with registration number OC303471 and with registered offices at 3rd Floor, Dominican Court, 17 Hatfields, London SE1 8DJ UK.Price elasticity for beach terminals is determined based on regression analysis of beach terminal
flows against historical NBP prices.
For demand, we determine price responsiveness based on published empirical studies and broader
assumptions:
Residential and Transport demand are assumed to be price insensitive. This means that they
consume at their required level and do not provide demand response.
Industrial and Commercial users provide demand-side response, and the demand from Power
stations will fluctuate depending on the ‘spark spread’, relating to the relative gas and power
prices. Assumptions on their respective price elasticities are taken from published studies. Gas
demand for power is assumed to have a higher elasticity than Industrial and Commercial
demand.18
Because GDN demand is composed of Residential, Transport, Industrial and Commercial and Power
station demand, we apply the corresponding price elasticities to each component of GDN demand at
each GDN exit point.
The attribution of price elasticity to different supply and demand sources allows continuous supply
and demand functions. To enable these functions to be used in an optimisation framework, we
determine step-wise demand and supply functions that approximate linear functions. Each demand
and supply source, which is defined both by the underlying component of demand and supply as well
as the relevant exit or entry point, is assumed to consist of four separate tranches with an associated
quantity and price. In order to achieve a more granular representation of supply and demand
functions in the region where the supply-demand balance is likely to be found, we generally define
three small tranches that require relatively modest changes in the system gas price to come into play
and one large tranche that requires a large change in the price to come into play. This is illustrated in
Figure 5 and consistent with the elasticity values assumed in our analysis.
Figure 5 Illustration of model supply-demand balance
18
Source: Vipin Arora, Estimates of the Price Elasticities of Natural Gas Supply and Demand in the United
States, March 2014.
Gas Charging Review (UNC621) – Analytical support 18
Baringa Partners LLP is a Limited Liability Partnership registered in England and Wales with registration number OC303471 and with registered offices at 3rd Floor, Dominican Court, 17 Hatfields, London SE1 8DJ UK.Finally, in order to derive full supply and demand functions for the purposes of modelling the
wholesale gas market, demand and supply flexibility must be defined around some absolute level of
demand and supply respectively. In absence of fundamental assumptions on the VoLL of different
demand tranches and the cost of different supply tranches, supply and demand tranches are
anchored to NBP price forecasts. On an annual level, these are based on Baringa assumptions, which
are in turn informed by IEA projections.19 Seasonal shape of NBP prices on a daily level is informed
by historical seasonal variation in NBP prices.
3.4 Economic impact assessment
Using outputs from the tariff analysis and wholesale gas market model, we assess the wider system
impacts of changes in tariff methodology. Our analysis focuses on changes in consumer welfare, but
also allows us to estimate consequent changes in market shares of different supply sources and net
revenues of gas storage. The assessment is carried out in the context of different scenarios in order
to test whether the results are robust to changes in market conditions and certain key assumptions
about supplier behaviour.
Our analysis of wider system impacts does not include estimating producer welfare. This is firstly
because we are not in possession of reliable information on the costs of the different gas producers
and importers and this is not the focus of our study. Secondly, a significant but uncertain proportion
of producer surplus would be accrued by parties that are not GB-based. Nonetheless, it is important
to note that consumer welfare and net social welfare are not synonymous and any consumer gains
and losses are likely to be associated with equally significant producer losses and gains, unless there
is a significant change in underlying resource costs.
The main way in which changes in gas transmission tariff methodology affect consumer welfare is
through changes in wholesale gas prices. This manifests itself through changes in the price paid by
consumers for gas.
The second component of consumer welfare estimated in our analysis is the change in the value of
demand served. We consider that the value of demand served is captured by the VoLL, or in other
words the maximum willingness to pay, of the corresponding demand tranche. Capturing differences
in this value ensures that all differences in consumer surplus are captured in our analysis of
consumer welfare.
Finally, our welfare analysis captures any residual differences between different tariff methodologies
and modelled scenarios in tariff revenue raised by the transmission network. If one modelled tariff
methodology option results in marginally higher tariff revenue being raised at the end of the last
iteration, this tariff over-recovery is added to total consumer welfare for that option because it can
offset revenue requirements for subsequent years. This puts welfare results from different model
runs on a comparable basis to avoid penalising tariff methodologies that have not iterated to a full
equilibrium and set marginally higher tariffs than the exact equilibrium level of tariffs.
19
International Energy Agency (2018), ‘World Energy Outlook 2018’, and Baringa calculations.
Gas Charging Review (UNC621) – Analytical support 19
Baringa Partners LLP is a Limited Liability Partnership registered in England and Wales with registration number OC303471 and with registered offices at 3rd Floor, Dominican Court, 17 Hatfields, London SE1 8DJ UK.4 Results
4.1 Distributional analysis
Our distributional analysis assesses the tariff variation at each entry and exit point under all options,
by point category, and the variation in tariff bills for a set of Residential, Industrial and Commercial
and Power station user archetypes. Tariff methodologies and parameters have a distributional
impact because lower tariff revenue from one set of users must be compensated by higher tariffs
from other users.
We have undertaken the distributional analysis for 2020-21, 2021-22 and 2030-31. Because similar
patterns are observed across all years, we present outcomes for 2021-22 in this section, i.e. the first
year of the enduring period. Results for other modelled years were provided to Ofgem in
spreadsheet format.
4.1.1 User archetypes
We assess the effect of changes in tariffs on the yearly bills of Residential, Power station and
Industrial and Commercial consumers. To undertake this assessment, we define typical consumer
archetypes and calculate their tariff bill under all modelled scenarios.
Residential consumers: We define consumer archetypes based on the Typical Domestic
Consumption Values published by Ofgem.20 Ofgem defines a typical Low consumption user as a
Residential consumer with 8MWh annual gas consumption. Central and High values are 12 and
17MWh respectively.
Industrial and Commercial users: We base Industrial and Commercial archetypes on BEIS gas
consumption statistics for non-domestic users. For each local authority, BEIS publishes the
distribution of gas consumption for non-domestic users (25th, 50th and 75th percentile). To have
significant variation between our low and high archetypes, we define our low archetype as the
lowest 25th percentile of gas use by Industrial and Commercial users across all regions in the UK
(320MWh), and our high archetype as the largest 75th percentile of gas consumption by
Industrial and Commercial users across all regions in the UK (970MWh).21
Power station: We identify typical plant characteristics using the list of power plants and
technical characteristics included in Baringa’s GB Power Sector model, together with modelling
outputs to identify efficiency and load factor. We define the low archetype as a GDN-connected
Open Cycle Gas Turbine (OCGT) generator of 50MW with 32% efficiency and a load factor of
15%. For the high archetype, we model a large, high-efficiency Combined Cycle Gas Turbine
(CCGT) generator such as those which could be built over the next couple of years. More
specifically, the high archetype is a transmission-connected 700MW CCGT, with 56% efficiency
and a load factor of 75% (similar to that of the most efficient plant currently operating).
For Industrial and Commercial users and for Power stations, we assume that the low archetype is
connected to the gas distribution network and that the high archetype is connected to the gas
20
https://www.ofgem.gov.uk/gas/retail-market/monitoring-data-and-statistics/typical-domestic-consumption-
values
21
Based on Chart 14 of BEIS (2018), ‘Sub-national electricity and gas consumption statistics’ , January
Gas Charging Review (UNC621) – Analytical support 20
Baringa Partners LLP is a Limited Liability Partnership registered in England and Wales with registration number OC303471 and with registered offices at 3rd Floor, Dominican Court, 17 Hatfields, London SE1 8DJ UK.transmission network. It follows that low users are liable for tariffs at GDN exit points, while high users are liable for tariffs at Industrial and Commercial / Power station exit points. We consider that this approach depicts how the each tariff scenario affects different types of points precisely because it does not mix point categories within a single archetype. Variation in tariff by exit point category would not be as clear if tariffs presented for a single archetype included tariffs at GDN exit points and at direct transmission points. Due to the smaller number and the specificity of storage sites and interconnectors, it is more difficult to define a typical archetype for these user categories. For these sites, we simply assess the magnitude of changes in tariffs under different scenarios, as opposed to changes to a typical bill. 4.1.2 Pass-on of charges into consumer bills As set out in Section 4.2.2, our wholesale market modelling assumes that entry charges are passed on into the wholesale market price of gas only if they apply to the marginal supply source. In terms of pass-on of exit tariffs into consumer bills, we note that these charges are generally paid by suppliers which are not subject to price regulation, and hence pass-on of these charges is at the supplier’s discretion. However, changes in exit charges can be classified as a common cost shock because they would affect any supplier whose customer is located at the affected exit point. Economic theory would suggest that, in a competitive market, such cost changes would be passed on to customers in full. We note that our distributional analysis presented in this section makes the assumption that entry tariffs are passed on to customers at different exit points on the basis of CWD weighting factors, where, for a given exit point, the extent of pass-on of entry charges is proportional to their respective capacities and distance from the said exit point. As set out in section 4.2.2, our wholesale market modelling assumes that entry charges are passed on only by the marginal producer via the wholesale price, which is paid by all demand. The resulting pass-on of entry charges for different supply sources in our wholesale market modelling is very sensitive to scenario assumptions and can be negative or greater than 100% due to the fact that changes in entry charges for supply sources that are not marginal do not affect the wholesale gas price. This is demonstrated in the results of our wholesale market modelling as set out in section 4.2. Hence, the assumption of 100% pass-on of changes in entry tariffs, distributed between end users at different exit points on the basis of CWD weighting factors, is a reasonable approximation of the pass-on that would be expected to occur via the wholesale price on average across a number of different wholesale market scenarios. Finally, in the context of our distributional and wider system impact analysis, we need to consider whether a move from charging on the basis of commodity flows to charging on the basis of capacity contracts is likely to change the extent of pass-on of changes in transmission charges at different entry and exit points. A simple argument might be that commodity charges are a marginal cost of supply, varying proportionally with the quantity supplied, and hence would be passed on by the marginal supplier. Capacity contracts could on the other hand be seen as a fixed cost which does not vary directly with quantity supplied, and hence would not necessarily be passed on to final customers equally in all periods, although it would be expected to be passed on in the long-run. Without going into detail on the pass-on of fixed costs into prices paid by consumers, it is sufficient to note that capacity contracts can generally be booked at different levels of granularity. While the question of what types of contracts may be available under future transmission charging arrangements is outside of the scope of this study, if those products include short-term (e.g. daily) Gas Charging Review (UNC621) – Analytical support 21 Baringa Partners LLP is a Limited Liability Partnership registered in England and Wales with registration number OC303471 and with registered offices at 3rd Floor, Dominican Court, 17 Hatfields, London SE1 8DJ UK.
You can also read