Accessing the Global Capital Markets Through London - Listing Considerations for Life Sciences Companies September 2019 - Stevenage Bioscience ...

Page created by Roy Grant
 
CONTINUE READING
Accessing the Global Capital Markets Through London - Listing Considerations for Life Sciences Companies September 2019 - Stevenage Bioscience ...
Accessing the Global Capital
Markets Through London
Listing Considerations for Life Sciences
Companies

September 2019
Accessing the Global Capital Markets Through London - Listing Considerations for Life Sciences Companies September 2019 - Stevenage Bioscience ...
Executive Summary
Why London?

 London Is The Most International   ⎯   London is the most international stock market globally in terms of international listed companies
 Market                             ⎯   International shareholders represent almost half the ownership in UK stocks
                                    ⎯   North American shareholders alone own c.30% and UK IPOs routinely offered to most US institutions
                                    ⎯   US IPO market remains essentially domestic with limited relative international investor representation
                                    ⎯   US investors’ holding of “non-domestic” companies tends to be more volatile

 Natural Home for Healthcare        ⎯ London Healthcare companies outperformed US Healthcare market over the past year
 Companies                          ⎯ AIM healthcare sector shows particular strong performance vs London AIM and Main Market
                                    ⎯ With 114 companies, 97 of which are Lifesciences, London Healthcare sector exhibits much lower price
                                      volatility than Nasdaq US establishing an optimal environment for listing

 Enhanced Deal Structure and        ⎯ With AIM and Main Market, UK is more receptive to deals of all sizes – from micro to mega cap
 Process in the UK                  ⎯ Less share price volatility observed in the UK due to long-term orientation of investors
                                    ⎯ UK investors have a superior appetite to absorb secondary selldown at IPO than US counterparts

 Vastly Reduced Regulatory          ⎯   London much more cost effective for IPO underwriting and transaction costs
 Burden and Cost                    ⎯   Quarterly reporting not mandatory in UK further reducing cost and time burden
                                    ⎯   Insurance far more expensive in US due to legal environment / track record of shareholder activism
                                    ⎯   Annual Sarbanes Oxley compliance estimated at US$1.5m / SEC review process longer than UKLA

 London Provides Better Support     ⎯ AIM is the number one growth market in Europe
 for Small Caps                     ⎯ With 86 Healthcare companies, AIM has performed particularly well cementing its status as not only the
                                      premier junior market, but the ideal market for a small cap IPO
                                    ⎯ Companies such as Abcam have chosen to list in London via AIM for greater growth potential than US
                                      exchanges

                                                                                                                                                 1
Accessing the Global Capital Markets Through London - Listing Considerations for Life Sciences Companies September 2019 - Stevenage Bioscience ...
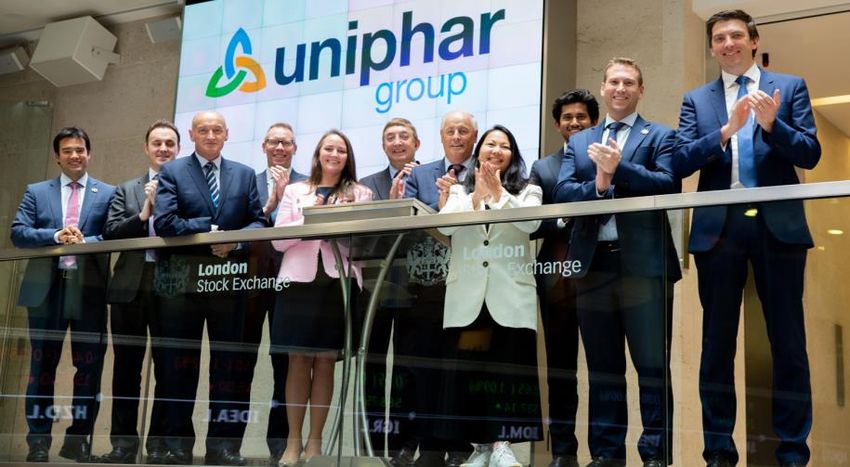
1. London’s Equity Markets

                             2
Accessing the Global Capital Markets Through London - Listing Considerations for Life Sciences Companies September 2019 - Stevenage Bioscience ...
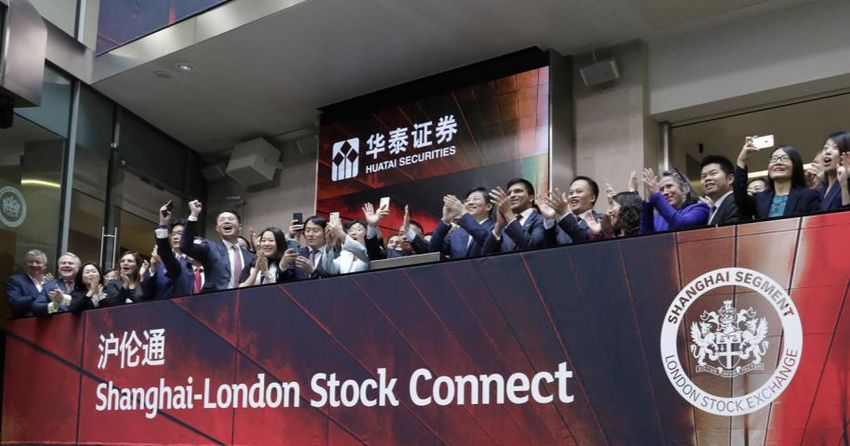
Key Highlights from 2018
    Strong position for international IPOs

                                                                                                     53 int’l listings
      79
      IPOs
                                       79 IPOs on LSE in 2018,
                                       the highest in Europe,
                                       raised $12.8 billion.
                                                                                                     21 IPOs and a further 32
                                                                                                     introductions and new listings from
                                                                                                     international companies. 3 of the 5
                                                                                                     largest IPOs were international.

$48bn
A total $48bn equity capital was raised in
London in 2018 through IPOs and follow on
issuance.
                                                                 2         AI company
                                                                           IPOs
                                                                 London accommodates the
The two years following the Brexit referendum                    emergence and growth of new                         AIM is the most
have been two of the most active for London                      Lifesciences sector – companies                    successful growth
Stock Exchange in a decade, recording the                        operating on digital health, use of                market in Europe
highest and third highest annual activity for                    technology and artificial intelligence             with 35 AIM IPOs.
equity listings in London since 2008 (650+                       in Healthcare.
transactions in 2018).

Source: Dealogic, LSE, February 2019
                                                                                                                                           3
Accessing the Global Capital Markets Through London - Listing Considerations for Life Sciences Companies September 2019 - Stevenage Bioscience ...
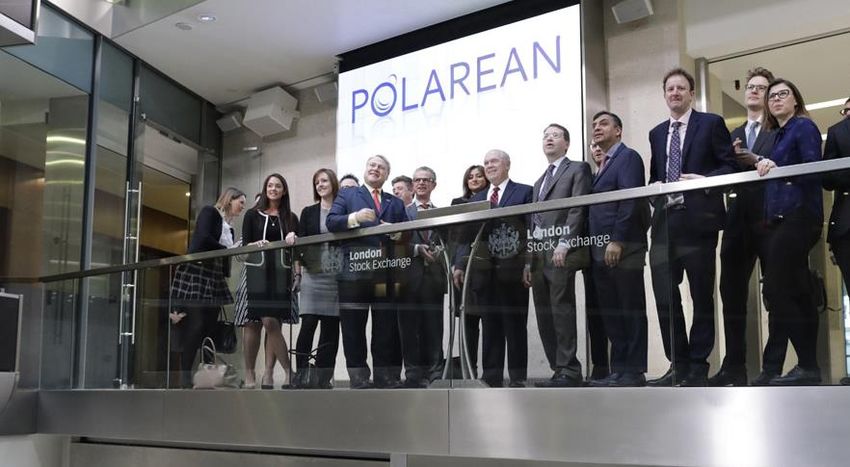
1st in Europe for IPO & FO Proceeds
$24.8bn was raised in London through IPOs & FOs in H1 2019

 London was the most active equity market in Europe in H1 2019, with:
 ⎯ more than 3x total deals (296 IPOs & FOs) than the next exchange, Nasdaq OMX Stockholm (89 IPOs & FOs)
 ⎯ c. 3x more in IPO and FO proceeds ($24.8bn) than the next exchange, Frankfurt Stock Exchange ($9.3bn)

    Top 10 European Exchanges by IPO & FO Capital Raised in H1 2019

                        30                  Top 5 deals in H1 2019 on          Deal           Capital        Top Global Exchanges by IPO & FO Capital Raised in                     300
                                            London Stock Exchange              type           raised         H1 2019
                                                                                              ($m)                 90      78.8

                                                                                                             $bn
                                                                                                                   80
                        25                                                                                         70                                                               250
                                            AstraZeneca                            FO           3,504                                  53.3
                                                                                                                   60
                                                                                                                   50
                                            Huatai Securities                      IPO*         1,692              40                            24.8
 Capital raised ($bn)

                        20                                                                                         30                                       18.6        14.8        200
                                                                                                                   20
                                            Network International                  IPO          1,593

                                                                                                                                                                                          No. of deals
                                                                                                                   10
                                                                                                                    0
                        15                  Trainline                              IPO          1,389                     NYSE        Nasdaq    London      HKSE       Bombay
                                                                                                                                                                                    150
                                                                                                                                                 Stock                  Stock
                                            Marks & Spencer Group                  FO            781                                           Exchange               Exchange

                        10                                                                                                                                                          100

                        5                                                                                                                                                           50

                        0                                                                                                                                                           0
                              London    Frankfurt        Nasdaq     Borsa Italiana       SIX Swiss       Euronext         Euronext         Madrid         Oslo Børs      Euronext
                               Stock      Stock           OMX                                           Amsterdam          Paris            Stock                        Brussels
                             Exchange   Exchange        Stockholm                                                                         Exchange

                                                          IPO capital raised ($)         FO capital raised ($m)         No. of IPOs       No. of FOs

Source: Dealogic, July 2019
All calculations are based on a deal pricing date
*A new listing as a part of Shanghai-London Stock Connect                                                                                                                                 4
Accessing the Global Capital Markets Through London - Listing Considerations for Life Sciences Companies September 2019 - Stevenage Bioscience ...
The Global Offshore Financing Centre
 47% of cross-border IPOs globally occurred in London

  Global Cross-Border IPO deal value 35% above 5y average*

                           20                                                                 80
                           18
                           16                                                                                     — London has established itself as the number one venue
    Capital Raised ($bn)

                                                                                              60
                           14                                                                                       for cross-border IPOs and new listings, accounting for

                                                                                                    No. of IPOs
                           12                                                                                       47% ($4.6bn) of global value
                           10                                                                 40
                            8
                                                                                                                  — This is c.$2.5bn more than the next largest exchange for
                            6
                                                                                              20                    cross-border IPOs, Nasdaq
                            4
                            2
                                                                                                                  — London has welcomed companies from North America, Africa,
                            0                                                                 0
                                2012   2013   2014   2015   2016     2017     2018    2019
                                                                                                                    United Arab Emirates and China in H1 2019
                                                                                      YTD

                                               Capital Raised      No. IPOs

  3 of the top 5 IPOs and new listings on LSE in 2019 H1 were international

 Company                                                 Huatai               Company                              Network International   Company                      Airtel Africa

 Company Nationality                                     China                Company Nationality                          UAE             Company Nationality          Pan-African

 Capital Raised ($m)                                     1,692                Capital Raised ($m)                         1,593            Capital Raised ($m)              687

 Market Cap at Listing ($m)                              25,305               Market Cap at Listing ($m)                  1,398            Market Cap at Listing ($m)      3,814

 Primary / Secondary                                     100 / 0              Primary / Secondary                         0 / 100          Primary / Secondary            100 / 0

Source: Dealogic, FactSet, July 2019
Cross-Border IPO defined as an IPO listing where the exchange nationality differs to the company nationality
*only H1 cross-border IPOs are considered
                                                                                                                                                                                        5
Note: companies from Greater China listing on HKSE have not been classified as cross-border
Accessing the Global Capital Markets Through London - Listing Considerations for Life Sciences Companies September 2019 - Stevenage Bioscience ...
UK Markets Remain Resilient
                   Volatility remains stable despite geopolitical uncertainty

                   Volatility vs UK Market Performance (2019 YTD)
                              Parliamentary    BoE rates   Second vote        Vote on no-   Vote on Brexit   EU and UK             110
                              vote on Brexit    decision   on Brexit plan     deal Brexit    alternatives    agree Brexit
                                 Plan B                                                                      extension to
                                                                                                                                   100
                                                                                                               Oct 31st
                                                                                                                            +11%
                                                                                                                                   90
                                                                                                                                                              London markets have
                                                                                                                                                             remained resilient in Q1
                                                                                                                                   80                          despite strong macro
                                                                                                                                                                    headwinds
                                                                                                                                   70                                    _
FTSE performance

                                                                                                                                         VIX Volatility
                                                                                                                                   60
                                                                                                                                                            The FTSE All-Share and
                                                                                                                                                          FTSE AIM indices have seen
                                                                                                                                   50
                                                                                                                                                          steady growth of c.11% over
                                                                                                                                   40                               the year
                                                                                                                                                                       _
                                                                                                                                   30

                                                                                                                                                          The volatility index; a common
                                                                                                                                   20
                                                                                                                                                          panic indicator for the market,
                                                                                                                                                           has remained stable and low
                                                                                                                                   10
                                                                                                                                                            over Q1 between 10-20%
                                                                                                                                   0

                                                             VIX volatility

          Source: FactSet, April 2019
                                                                                                                                                                                        6
Accessing the Global Capital Markets Through London - Listing Considerations for Life Sciences Companies September 2019 - Stevenage Bioscience ...
The Home of International Issuers
 More international companies choose London for listing

          More international
          companies choose
          London for listing than
                                                                 100+
                                                                 London issuers operate in
                                                                                                          38%
                                                                                                          of London-listed companies
                                                                                                                                                  3
                                                                                                                                                  3 of 5 of the top London
          any other exchange                                     over 100 countries around                are international                       IPOs in 2018 were
                                                                 the world                                                                        international

     London has more international companies than any other major exchange

                   600                            53%                                      Total no. int'l companies (LHS)         As % of total companies (RHS)                      60%

                            38%
                   400                                                                                                                                                                40%
                                                                                                                     32%
                                                                                               25%
                                       21%                                                                                                 19%
                                                                        18%                                                                           19%
                   200                                       14%                    12%                                                                                               20%
                                                                                                          11%
                                                                                                                                 8%
                                                                                                                                                                  4%          2%

                     0                                                                                                                                                                0%
                           London     Toronto     SGX       Nasdaq       ASX       HKSE      Euronext    NYSE     Stockholm    Korea Taiwan SE Frankfurt          JPX        Bombay
                                                                                              Paris                           Exchange

       International          579        579        381        365        352        292        208        205        191        191        180        123        119         107

         Domestic             937       2204        341       2179       1565       2056*       633       1722        409        2128       774        535        2896        4404

Source: London Stock Exchange, FactSet, April 2019
*1402 (60%) of HKSE companies are Chinese
— Exchanges with fewer than 250 companies listed are excluded
                                                                                                                                                                                           7
— International companies are those where the country of primary business of a company is not equal to the country of its primary listing. Our country of primary business
   methodology uses FactSet data and takes into account the country of largest revenue exposure, headquarters and incorporation
West to East and East to West
A two-way depositary receipt programme

                      LSE Premium listed corporates
                     issuing CDRs to be listed on SSE

                       SSE listed corporates issuing
                         GDRs to be listed on LSE

                                                        8
Case Study
                                       Huatai
Inaugural issuer to use the London-Shanghai connect route
Company name                             Huatai Securities Co. Ltd.

LSE market                               Main Market

FTSE ICB sector                          Financial Services

Main countries of operation              China

Admission date                           17 June 2019

Money raised at admission                $1,692 million (including greenshoe)

Market cap at admission                  $25,305.5 million

Current market cap                       $25,517.1 million
                                         JP Morgan, Morgan Stanely, Credit Suisse,
Bookrunner
                                         HSBC, Huatai Financial

                                                                                                                                                                   Trading Data*
“Shanghai-London Stock Connect is the first of its kind to directly link the Chinese
and European markets and a strategic component of China's capital markets                                                                   31.6                                     First Trading Day    ADTV ($, 4 days)
opening up. The programme offers us access to one of the deepest and most                                                    31

                                                                                                         ADTV ($ millions)
influential capital markets in the world and provides fungibility between the GDRs
                                                                                                                                                                                           19.6
and the A Shares. The offering will improve our core competitiveness by supporting                                           21                             16.5
the growth of our international business, further expanding our overseas footprint,
and strengthening our capital position. We are pleased to be the first issuer to tap                                         11                                                                           6.7
this new market of enormous potential and unprecedented opportunity.”
                                                                                                                             1
Zhou Yi, Chairman & President                                                                                                                      Huatai                                         Haier

                      Huatai Securities is a leading
Listing               integrated securities group in
                      China, with the largest securities
                                                                   Huatai successfully listed GDRs
                                                                   on LSE’s Main Market in June
                                                                                                                                  This marks the first time that                   Comparisons to a Chinese peer,
                                                                                                                                  international investors have been                Haier Group, which listed D-shares
Story                 brokerage business and leading e-
                      platform in the industry.
                                                                   2019, raising $1.54 billion at IPO.
                                                                   Hiuatai is the inaugural issuers to
                                                                                                                                  granted access to China A-Shares                 in Frankfurt shows Huatai has
                                                                                                                                  on an exchange outside Greater                   seen stronger trading since IPO, at
                      The company has maintained                   list GDRs in London through the
                                                                                                                                  China using international trading                over 3x in average daily value
                      listings on the Shanghai and Hong            Shanghai-London Stock Connect
                                                                                                                                  and settlement practices.                        traded thus far*
                      Kong Stock exchange in 2010 and              programme.
                      2015 respectively.

 Source: LSE, company website, Dealogic, FactSet, July 2019
 *Trading data comparisons are on currently available trading data (20/06/2019) for Huatai Securities vs. Haier D shares 1st four days of trading                                                                            9
Diverse Investment Base vs US
Gain access to the more internationally diverse pool of investment

  Domicile of Top investors in listed securities in London*
                                                                                 —   London has the most diverse investor base of any major
                                                                                     global exchange, while still allowing issuers to tap US
                                                  49%                                institutional investors.
                                                   UK

                                                                                 —   This allows issuers access to a pool of capital that is
                                                  31%                                comfortable with companies who build internationally facing
                                                  North America                      business models.
                           LSE
                                                  15%
                                                   Europe (ex UK)

                                                                                 Domicile of Top investors in listed securities in the US*
                                                  5%
                                                   Rest of World

                                                                                                                                87%
                                                                                                                                North America

   Largest Institutions Investing in LSE Listed Stock         Investor Country

   BlackRock Investment Management (UK) Ltd.                  United Kingdom                                                    6%
                                                                                                     NASDAQ                     UK
   The Vanguard Group, Inc.                                   United States                             and
   Legal & General Investment Management Ltd.                 United Kingdom
                                                                                                       NYSE                     5%
                                                                                                                                 Europe (ex UK)

   Norges Bank Investment Management                          Norway

   BlackRock Fund Advisors                                    United States
                                                                                                                                2%
                                                                                                                                 Rest of World

   Capital Research & Management Co.                          United States

Source: FactSet, July 2019
*Based on the Value of Securities Held
                                                                                                                                                  10
UK vs US IPO Cost Comparison
       UK typically lower cost with less litigation risk

Comparison of Underwriting Costs for IPOs (%)
                                                                                                                                                     8.4%
                     8.0
                                                                                                                                              of all US exchange listed
                                                                                                                                              companies were sued in
                     7.0    2017        2018                                                                                                          2018 alone
                                                                    6.5%         6.4%

                     6.0                                                                                    5.7%         5.8%

                     5.0                                                                                                                              202
Underwriting fee %

                                                                                                                                             Foreign issuers were sued
                     4.0   3.8%                                                                                                               from 2014-18, paying out
                                         3.5%
                                                                                                                                             settlements totalling $4.5bn
                     3.0

                     2.0
                                                                                                                                                No SarbOx
                     1.0                                                                                                                     Lower Insurance
                                                                                                                                              Less Litigation
                     0.0
                                   LSE                               NASDAQ-US                                    NYSE

       Source: Dealogic, January 2019
       Source: http://securities.stanford.edu/research-reports/1996-2017/Cornerstone-Research-Securities-Class-Action-Filings-2017-YIR.pdf
                                                                                                                                                                            11
Lower Price Volatility
    - The London Stock Exchange Main Market is consistently less volatile when compared to US markets. Much of this is driven by its
      diversified international investor base and focus on institutional investment.
    - AIM displays relatively higher volatility due to its focus on high growth companies.
    - Despite this, in recent years IPOs on AIM have been more stable compared to the US exchanges.

  Price volatility across markets, year by year

   140

   120

   100

     80

     60

     40

     20

      0
                   2011                   2012                    2013             2014          2015       2016   2017     2018

                                                                             AIM   London   Nasdaq   NYSE

Source: Dealogic, FactSet, LSE Calculation, January 2019
Note: All IPOs since 2014. Daily price volatility since listing annualized
                                                                                                                                       12
Comparison of US and UK Regulatory Regimes

      Key Issue                       United States                            United Kingdom                   Market Cap loss that preceded class action
                                                                                                                (Direct Dollar Loss* by size Average (1997-2015))
Quarterly
Reporting

                          Sarbanes Oxley introduces a risk of       Directors responsible for content of                                   6% 3%
                          personal criminal liability for CEO       annual report, would not incur
Liability regime                                                                                                                   8%
                          and CFO who must sign-off on              personal criminal liability except in
arising from              disclosure, financial and accounting      cases of fraud.
disclosure                controls and disclosure in SEC filed                                                                10%
                          annual report.
                                                                                                                                                                 54%
                          D&O Insurance costs are typically 3x      Owing to the less litigious                                 8%
                          more expensive for a company              environment, D&O Insurance is
Directors and
                          listed in the US due to the               generally far cheaper in the UK than
Officers Insurance
                          significantly more litigious              the US                                                             11%
                          environment compared to the UK.

                          ⎯ Plaintiffs filled a record 412 new      We were not able to identify a class
                            federal class action securities         action in the UK against any LSE                 Mega    ≤$500M        ≤$1B    ≤$2B   ≤$3B    ≤$4B    ≤$5B
                            cases in 2017                           listed foreign company. This
                          ⎯ This is 52% higher than 2016 and        compares to 336 class actions against         FCPA 2016 Settlements against US vs Int’l firms**
                            more than 2x than 1997-2016             foreign US listed companies since
                            average                                 2008.
                                                                                                                   Foreign Corporate
Litigation                ⎯ Snap Inc (NYSE.SNAP) was
                            subject to class action filing 2
                            months after listing.                                                                      US Corporate
                          ⎯ In January 2018, Brazilian oil
                            company Petrobras agreed to pay
                                                                                                                                       0          1000    2000           3000
                            $3bn as settlement to a class
                            action lawsuit                                                                                                            USDm

Source: Stanford Law School in collaboration with Cornerstone Research, http://securities.stanford.edu/research-reports/1996-2017/Cornerstone-
Research-Securities-Class-Action-Filings-2017-YIR.pdf
                                                                                                                                                                         13
*DDL- The total decline—that is, the dollar value change—in the market capitalisation of a defendant company from the trading day immediately preceding
the end of the class period to the trading day immediately following the end of the class period. Mega DDL filings have a dollar loss of at least $5 billion.
**Source: SEC Website
US Litigation Environment
   Class Action lawsuits are increasing in frequency

   — Plaintiffs filed 403 new federal securities class actions last year, making 2018 the second-largest year on record, trailing only
     2017
          — The number of filings in 2018 was 99% higher than the average
          — Core filings – those excluding M&A filings – were the highest since 2008m when filings surged due to the volatility in global
              financial markets
   — Since 2009, 19.5% of IPOs have been subject to a federal core filing within four years of IPO, compared to 14.5% pre-crisis

    450
                                                                                                                                                    412    403
                    M&A Filings                               ICO / Cryptocurrency Filings
    400             Chinese Reverse Merger Filings            Credit Crisis Filings
                    All Other Filings
    350

    300                                                                                                                                      271

    250       228                                          223
                                                                                                                                      207
                                                                                             188
    200
                          182                   177                    165       175                                165        168
                                                                                                         151
    150                                 120

    100

      50

       0
              2004        2005          2006   2007        2008       2009       2010        2011       2012       2013        2014   2015   2016   2017   2018

Source: http://securities.stanford.edu/research-reports/1996-2018/Cornerstone-Research-Securities-Class-Action-Filings-2018-YIR.pdf
                                                                                                                                                                  14
Class Action Case Study
  Snap Inc – Class Action 2 months after IPO – still ongoing in 2019

 —       On May 10, 2017, post-market, Snap issued its first
         quarterly report as a public company, disclosing
         disappointing user growth at the Company’s Snapchat
         messaging platform. For the quarter, Snap reported 166
         million daily users, only 8 million more than in the
         previous period and only 44 million more than the same
         period in the prior year—Snapchat’s slowest year-to-year
         growth rate in at least two years.
 —       On this news, Snap’s share price fell $4.93, or 21.45%,
         to close at $18.05 on 11 May 2017 falling $5.69bn in
         value and now trading at IPO price.
 —       Complaint alleges that throughout the Class Period,                          Snap Share Price $
         Defendants made materially false and misleading             30
         statements regarding the Company’s business,
                                                                     25
         operational and compliance policies. Specifically,
                                                                     20
         Defendants made false and/or misleading statements
         and/or failed to disclose that: (i) Snap’s reported user    15

         growth was materially false and misleading; and (ii) as a   10
         result, Snap’s public statements were materially false       5
         and misleading at all relevant times.                         0
 —       Case is still being litigated at the start of 2019.         01/03/2017   01/04/2017   01/05/2017   01/06/2017

Source: FactSet, Bloomberg Snap Inc. vs. S&P rebased to 100
                                                                                                                         15
US Litigation Environment
   Core filings in Tech / Telecomms sector increase again

   — The likelihood of an S&P 500 company being sued in 2018 was the highest since 2002
        — This constitutes 14.9% of the S&P 500’s total market cap
        — Of the companies in the index at the beginning of 2018, approximately 1 in 11 (9.4%) was a defendant in a core
            filing during the year
        — Core filings activity in the Tech / Telecomms sector increased for the fourth consecutive year
   — Nearly 20% of the market cap of the Tech / Telecomms sector was subject to core filings in 2018

                                           30%
                                                                                                              26.3%
    % market cap subject to core filings

                                           25%

                                                                                                                              19.4%        19.4%
                                           20%

                                                                  15.2%
                                           15%
                                                                                             12.5%

                                           10%
                                                                                                                                                      6.5%
                                                    4.7%
                                           5%
                                                                             1.4%
                                           0%
                                                  Consumer       Consumer   Energy /    Financials / Real   Health Care    Industrials     Tech /    Utilities
                                                 Discretionary    Staples   Materials        Estate                                      Telecomms

Source: http://securities.stanford.edu/research-reports/1996-2018/Cornerstone-Research-Securities-Class-Action-Filings-2018-YIR.pdf
Note: sectors are based on the Global Industry Classification Standard (GICS)                                                                                    16
2. London is a Natural
   Home for Life Science
   Companies
London’s Health Care Sector
London healthcare stocks outperform competitors in 2018-2019

                                                    No. of       Total Market   Healthcare companies per London market
  Healthcare Subsectors
                                                  Companies       Cap ($bn)
   Pharmaceuticals                                     26           227.6         $16.6bn
Healthcare Investors in London
Top institutional investors in London listed healthcare stocks

  Top 10 UK Investors in London listed Healthcare   Top 10 International Investors in London listed Healthcare

                                                                Government of
                                                                Norway

Source: Factset, July 2019
                                                                                                                 19
Spotlight on Lifesciences in London
                                                                                                             Geographical Breakdown of Institutional Investors

97                                                 $271bn
                                                                                                                                 1%

                                                                                                                              3%
Number of lifesciences                              Total Market Capitalisation                                        13%                          United Kingdom
companies
                                                                                                                                                    North America
                                                                                                                                           46%
                                                                                                                                                    Europe ex UK

                                                                                                                                                    APAC

                                                                                                                     37%                            Rest of World

                                                                                                             Top Institutional Investors              Value Held
                                                                                                             (parent level)                             ($bn)

                                                                                                         BlackRock, Inc.                                   16.8

                                                                                                         The Capital Group Cos., Inc.                      8.4

                                                                                                         The Vanguard Group, Inc.                          7.5

                                                                                                         Standard Life Aberdeen Plc                        6.2

                                                                                                         Legal & General Group Plc                         5.2

Source: FactSet, July 2019
Note: Pharmaceuticals, Biotech, Medical Equipment, and Medical Supplies ICB sub-sector classification used
Index rebased to 100 as of 1 years ago                                                                                                                               20
Medical Equipment Companies on LSE

                                     21
UK Investors Have Cash to Deploy
Shire and BTG leaving market opens up a significant opportunity

 Acquisition Story: Takeda acquired Shire for $56.6bn in cash and                 Acquisition Story: Boston Scientific agree $4.2bn cash deal for BTG,
 stock, completed in January 2019                                                 expected to complete in H2 2019

The acquisition brought together             For each Shire share held,          The acquisition will help Boston              For each BTG share held,
their complementary positions in             shareholders received $30.33 in     Scientific to extend their production         shareholders will receive $10.8 in
GI and neuroscience, with                    cash and either 0.839 new Takeda    range of medical devices by adding            cash, which represents a premium
increased exposure to the US.                shares or 1.678 Takeda ADSs.        lines on cancer treatment.                    of approximately 36.6%.

    Deal Multiples           Target                                                  Deal Multiples            Target
                                             The acquisition significantly                                                     Based on acquisition of other
  Transaction value /                        increased underlying earnings per     Transaction value /                         acquired similar businesses,
                               5.3x                                                                              4.6x          Boston Scientific expects to realise
     TTM revenue                             Takeda share and expected                TTM revenue
                                             generated substantial cost                                                        annual cost and revenue synergies
  Transaction value /                                                              Transaction value /                         of approximately $175m by the
                              16.0x          synergies of at least $1.4bn.                                       27.3x
     TTM EBITDA                                                                       TTM EBITDA                               end of 2021.

 Due to Shire acquisition by Takeda, $21.9bn accrued to UK                        Due to BTG acquisition by Boston Scientific, $2.6bn is expected to accrue to
 shareholders who are reinvesting in the healthcare sector                        UK shareholders who will look to reinvest in the healthcare sector
                           2%
Healthcare Companies Price Volatility
 London is an optimal environment for healthcare companies

                                  Healthcare price volatility and no. of peers across LSE, NASDAQ and NYSE per sub-sector
                     30                                                                             27.3        27.7                                                                   450
                                                 25.8
                                                     387                                                                                                                               400
  Price volatility

                     25                                                                                                                                                        22.9
                                                                                                                                                                                       350

                                                                                                                                                                                              No. of companies
                     20                                                                                                                                                                300
                                                                                15.7
                                     14.2                                                                                                       14.6               14.2                250
                     15   13.4                                                                                                       12.5
                                                                    12.0                                                                                                               200
                                                           11.0
                     10                                                                  8.0                                                            8.0                           150
                                                                                                                           7.0
                                                                                                                                                                                  111 100
                      5                                                                                            81
                                           46                                                                                                                                          50
                                                               32                   25                    22                                       34                    28
                              10                                          15                   18                                9         6                  18
                      0                                                                                                                                                                0
                          NYSE       LSE        Nasdaq     NYSE     LSE        Nasdaq    NYSE       LSE        Nasdaq    NYSE        LSE       Nasdaq   NYSE       LSE        Nasdaq
                                 Biotechnology              Health Care Providers          Medical Equipment                 Medical Supplies             Pharmaceuticals

                                                                      Avg Price Volatility 12M                          No. of Companies

                 ―    Nasdaq: large market, high volatility. Over last 12 months, healthcare companies on LSE consistently experienced lower price volatility
                      in comparison with Nasdaq US (LSE avg 16.2 vs Nasdaq US avg 24.4)
                 ―    NYSE: lower volatility, small market. Despite having lower price volatility than LSE (LSE avg 16.2 vs NYSE avg 9.6), NYSE healthcare
                      sector is much smaller (117 peers on LSE vs 87 peers on NYSE)
                 ―    LSE: lower volatility, larger market. This makes London markets an optimal environment for healthcare companies both in terms of
                      number of peers and price volatility

Source: FactSet, February 2019
                                                                                                                                                                                             23
Overview of Biotech Companies

  46                                                                $3.5bn                                       $15.6bn
    Number of biotech companies                                     Total money raised by biotech                Total market capitalisation of
    listed on LSE                                                   companies since 2008                         biotech companies

                Market Cap Profile of biotech Companies on LSE                                 Top 5 Institutional investors in London listed   Value held
                                                                                               Biotech                                          ($m)
                     18
                     16                                                  AIM   Main Market     Invesco                                             1,427
                     14
  No. of companies

                     12                                                                        Woodford Investment Management                       664
                     10
                     8                                                                         Standard Life Aberdeen                               527
                     6
                     4                                                                         T. Rowe Price Group                                  394
                     2
                     0                                                                         Baillie Gifford & Co                                 391
                          £0-5m   £5-10m   £10-50m   £50-100m £100-500m £500m-£1bn    £1-5bn
                                                 Market cap bands

Source: Dealogic, Factset, LSE internal database, July 2019
Biotech companies are identified based on FTSE ICB sub-sector                                                                                                24
High US Demand for London Biotech

     Rest of World                                           Rest of World                                       Rest of World
                                                                  8%                                                                            North America
         4%                                                                                                           7%                             31%
                                         North America
                                             49%
                                                                                             United Kingdom
                                                                                                  51%

                                                            North America
     United Kingdom                                              41%                                             United Kingdom
          47%                                                                                                         62%

 Free float                                     88%      Free float                                  99%      Free float                              88%

 Institutional Ownership                        89%      Institutional Ownership                     85%      Institutional Ownership                  91

 Market Cap ($m)                                3461     Market Cap ($m)                            1,013     Market Cap ($m)                        4,210

  Top 5 Holders                              Value $m     Top 5 Holders                            Value $m    Top 5 Holders                        Value $m

 T. Rowe Price Associates, Inc.                  307     Scopia Capital Management LP                184      Pentwater Capital Management LP          337
 Baillie Gifford & Co.                           186     Standard Life Investments Ltd.              150      Invesco Asset Management Ltd.            337
 Select Equity Group LP                          169     Artemis Investment Management LLP            58      UBS Asset Management (UK) Ltd.           298
 Wasatch Advisors, Inc.                          167     M&G Investment Management Ltd.               57      Sand Grove Capital Management LLP        177
 OppenheimerFunds, Inc.                          129     Merian Global Investors (UK) Ltd.            54      The Vanguard Group, Inc.                 115

Source: Dealogic, FactSet, LSE calculations, May 2019
                                                                                                                                                            25
IP Commercialisation
London attracts companies from the UK and US

Selected IP Commercialisation Companies
                                                                               Current
                                           Date of         Deal size                       Performance   Performance
Country              Name                                                     Market Cap                                               Business Description
                                            IPO              ($m)                           2019 YTD      since IPO*
                                                                                 ($m)
                                                                                                                       Boston-based research and development company
                                                                                                                       engaged in providing healthcare solutions through
           PureTech Health               19 Jun 2015          195                609          +0.9          +6.6       academic research. It has driven the launch & FDA
                                                                                                                       approval of over 100 drugs and devices.
                                                                                                                       Specializes in startups, early stage and growth stage
                                                                                                                       companies at a pre-revenue and pre-profit stage which
           Woodford Patient
                                         21 Apr 2015         1,197               927          +6.1          -18.1      have strong intellectual property and technology. It seeks
           Capital                                                                                                     to invest in quoted/unquoted companies in the
                                                                                                                       biotechnology sector.
                                                                                                                       Engages in creating and developing companies which
                                                                                                                       have significant intellectual property. Focused in digital,
           Mercia Technologies          18 Dec 2014           110                136          +18.8         -30.6      electronics & hardware, advanced materials, engineering
                                                                                                                       & specialized manufacturing and life sciences.
                                                                                                                       Focused on the development and commercialization of
                                                                                                                       science and technology innovations from U.S.
  us       Allied Minds                  25 Jun 2014          211                191          -9.5          -67.7      universities and U.S. federal government research
                                                                                                                       institutions.

                                                                                                                       Invests in healthcare sector including gene therapy,
           Syncona (BACIT)               26 Oct 2012          331               2,314         +3.5          +170       targeted cell therapy, advanced diagnostics.

                                                                                                                       Engages in developing technology innovations primarily
                                                                                                                       from its research intensive partner universities. Its
           IP Group                      01 Oct 2003          32**              1,483         +0.3          -61.1      portfolio comprises the healthcare, biotech, cleantech
                                                                                                                       and technology sectors.

Source: LSE database, Dealogic, FactSet, February 2019
*IPO Open Price
**Originally admitted to AIM, listed on MM in 2006 at a market cap of £321m                                                                                               26
***Previously Imperial Innovations
Great Support across Growth Spectrum
Supporting innovation & capital raising at all stages of growth

    Selected listed biotech finance vehicles
                                                                           Current
                                                              Deal size                Performance
     Country                Name                Date of IPO               Market Cap                                     Business Description
                                                                ($m)                   since IPO (%)
                                                                             ($m)

                                                                                                       Specializes in startups, early stage and growth stage
                                                                                                       companies at a pre-revenue and pre-profit stage which have
                 Woodford Patient Capital       21 Apr 2015    1,197         609           -18.1       strong intellectual property and technology. It seeks to invest
                                                                                                       in quoted/unquoted companies in the biotechnology sector.

                                                                                                       Arix Bioscience is a holding company for a group developing
                                                                                                       healthcare and life science technologies. Arix Bioscience
                 Arix Bioscience               17 Feb 2017      141          284           -21.5       drives value in private and public companies through
                                                                                                       operational and strategic direction as well as patient capital.

                                                                                                       Identifies novel pipeline products in the therapeutic areas of
                                                                                                       speciality pharma or orphan and rare diseases that have the
                                                                                                       potential to address significant unmet medical needs.
                                                                                                       Through an acquisition or licensing structure we then
                 Mereo Biopharma Group          6 June 2016      17          148           -27.6       provide the financial and clinical support needed to
                                                                                                       accelerate progression of these products to the
                                                                                                       marketplace, creating value for all the respective
                                                                                                       stakeholders.

                                                                                                       BioPharma Credit plc provides investors with an opportunity
                                                                                                       to gain exposure to the fast growing life sciences industry,
                 BioPharma Credit              23 Mar 2017      762         1,470          +6.0        through a diversified portfolio of loans and other instruments
                                                                                                       backed by royalties or other cash flows derived from sales of
                                                                                                       approved life sciences products.

Source: LSE database, Dealogic, FactSet, February 2019
                                                                                                                                                                   27
Case Study
                                    Uniphar
Company name                          Uniphar Plc
LSE market                            AIM

FTSE ICB sector                       Personal Care, Drug and Grocery Stores

Main country of operation             Ireland
Admission date                        17 July 2019
                                      Ireland (53%), UK (27%), US (9%), Rest of
Geo split of IPO allocation
                                      Europe (11%)
Money raised at admission             $153.5 million
Market cap at admission               $348.7 million
Current market cap                    $368.3 million
Nomad                                 J&E Davy, RBC Capital Markets
“Today marks a major milestone in the 50-year
                                                        Revenue*        Gross profit*
history of Uniphar and cements our transformation                                                                  Top Healthtech Investors on LSE
from a pharmaceutical wholesaler focused on the
Irish market to an international healthcare services   $1.74 billion    $179.1 million                       Name                                    Holdings ($bn)
business focused on growth markets. The level of                                                        BlackRock Inc.                                    17.3
interest generated from institutional investors in
support of our IPO gives us great confidence as we      EBITDA*
                                                                        Value Traded                The Capital Group Cos                                  9.2
                                                                           (Day 1)
embark on the next phase of Uniphar's growth as a                                                    The Vanguard Group                                    8.1
public company.”
                                                                                                    Standard Life Aberdeen                                 6.3
                                                       $51.9 million      $44,332
Maurice Pratt, Chairman                                                                                State Street Corp                                   5.8

                                                        The company’s strategic milestone for
                                                                                                  On 17th July, 2019 Uniphar was
Listing Uniphar Plc is an Irish diversified             2019 was to acquire Durbin; a
                                                        specialist supplier of pharmaceuticals
                                                                                                  admitted to AIM and Euronext Dublin
                                                                                                                                                The Directors believe that the
                                                                                                                                                listing further supports Uniphar's
        healthcare services business                                                              with a market valuation of $348 million
Story founded in 1994 through the                       with offices in the UK and the US
                                                        supplying over 160 countries. To fund
                                                                                                  (€310 million) enabling it to raise a total
                                                                                                                                                growth plans by putting in place an
                                                                                                                                                appropriate capital structure to
                merger of United Pharmacists Co-                                                  of $153 million (€136 million). It was the
                                                        this acquisition, the company’s                                                         enable the Group to execute on
                op and Allied Pharmaceutical                                                      first Irish company to go public in
                                                        Directors decided to go ahead with                                                      continued organic growth and
                Distributors.                                                                     London in 2019.
                                                        Uniphar’s long awaited initial offering                                                 acquisition opportunities.
                                                        of shares to the public.

 Source: LSE, company website, Dealogic, FactSet, July 2019
 *https://www.ise.ie/app/announcementDetails.aspx?ID=14112378                                                                                                                 28
Case Study
                                    Diaceutics
Company name                          Diaceutics Plc
LSE market                            AIM
FTSE ICB sector                       Health Care Equipment & Services
Main country of operation             Northern Ireland
Admission date                        21 March 2019
Money raised at admission             £17 million
Market cap at admission               £52.9 million
Current market cap                    £63.0 million
Nomad                                 Cenkos Securities

“Diaceutics was founded out of a desire to get more patients access                               Top 4Institutional Investors (value held £m)
to improved healthcare. We are giving patients a higher likelihood of                             Canaccord Genuity Group, Inc.                                        6.2
getting better by supporting access to the right test to determine the
right treatment at the right time. Our AIM IPO will help us in our                                Joh. Berenberg, Gossler & Co. KG                                     3.6
mission to continue this great work.”                                                             Octopus Capital Ltd.                                                 2.2
                                                                                                  HIML Holdings Ltd.                                                   1.5
Peter Keeling, CEO
                                                                                                  Allchurches Trust Ltd.                                               0.6

                                                                                                        On 21st March, 2019 Diaceutics
Listing            Dundalk-based Diaceutics is a
                                                             Diaceutics was founded out of a            was admitted to AIM. The
                                                             desire to get more patients access         company raised £17 million
Story              diagnostics and data company that
                   currently provides services to 20 of
                                                             to improved healthcare. To                 through a 22.4 million share
                                                                                                                                             Diaceutics opened up 11.18%,
                                                                                                                                             and closed up 25.66 % at the end
                                                             support and help continue its              placing at a price of 76 pence per
                   the 30 largest global                                                                                                     of its first day's trading
                                                             mission the Directors decided to           share, with the new shares
                   pharmaceutical companies.
                                                             go for a public listing.                   representing 32% of its enlarged
                                                                                                        share capital on admission.

Source: LSE, company website, Dealogic, FactSet, July 2019
                                                                                                                                                                         29
Case Study
                                           Polarean
 Company                                   Polarean Imaging Plc

 Market                                    AIM

 Sector                                    Health Care Equipment & Services

 Main Country of Operation                 UK

 Admission Date                            29 Mar 2018

 Money Raised at Admission                 $4.2 million

 Market Cap at IPO                         $15.6 million

 Current Market Cap                        $25.2 million

 NOMAD                                     Northland Capital Partners Ltd

 “We would like to thank our existing shareholders and our new
 institutional investors for providing us with the support to take                                                        Key Financials at IPO
 the business to the next stage of its development through our
 admission to AIM…The additional funding from the Fundraise will                                                             Revenue         Operating Profit
 enable us to continue the implementation of our growth strategy
 and development pipeline. We look forward to providing our                                                  2015              $902m              -$911m
 shareholders with further updates as we progress.”
                                                                                                             2016              $881m              -$1,056m
 Richard Hullihen, CEO of Polarean

                                                           Polarean operates in an area of
 Listing             Polarean Imaging Plc is a
                     revenue generating medical
                                                           significant unmet medical need and     The Company joined LSE’s AIM on          Polarean’s Phase III trial for its
                                                                                                                                           imaging technology is expected to
                                                           the Group’s technology provides a      29 Mar 2018 raising £3 million
 Story               technology company with a
                     late-stage proprietary drug-
                                                           novel diagnostic approach, offering
                                                           a non-invasive and radiation-free
                                                                                                  ($4.2m) by way of a conditional
                                                                                                  placing, giving it a market cap at
                                                                                                                                           begin in early Q2 2018 and is
                                                                                                                                           expected to last for about 18 months
                     device combination for the                                                                                            as it prepares its NDA to the
                                                           functional imaging platform which is   IPO of £11 million ($15.6m).
                     magnetic resonance imaging                                                                                            regulatory agency.
                                                           more accurate and less harmful to
                     (MRI) market.
                                                           the patient than current methods.

Source: Company website, Dealogic, FactSet, July 2019
                                                                                                                                                                             30
Case Study
                                    Creo Medical
Company name                          Creo Medical Group Plc
LSE market                            AIM
FTSE ICB sector                       Health Care Equipment & Services
Main country of operation             UK
Admission date                        09 December 2016
Money raised at admission             $25.4 million
Market cap at admission               $103.2 million
Current market cap                    $260.8 million
                                      Cenkos Securities plc (Bookrunner and
Bookrunner(s) / Nomad
                                      Nomad)

“We are very excited to have received such strong support from UK and                             Top 5 Institutional Investors (value held $m)
European investors in raising £20 million. The AIM market in London has
allowed us to attract the type of long-term institutional investors whose                         Canaccord Genuity Group, Inc.                                         47.2
outlook fits nicely with our vision for the growth of the Company and
execution of our business model. London is a great market and we believe                          Baillie Gifford & Co.                                                 16.5
the AIM market is an excellent platform from which we will continue to
                                                                                                  BennBridge Ltd.                                                        7.8
build a leading British medical device company.”
                                                                                                  FIL Ltd.                                                               5.7
Craig Gulliford, Chief Executive Officer
                                                                                                  AXA SA                                                                 5.7
                 Creo Medical is a medical device            The Company has a portfolio of
Listing          company focused on the exciting and
                 emerging field of surgical endoscopy,
                                                             intellectual property including 76
                                                             granted patents and 184 patents
                                                                                                         The Company intends to use the
                                                                                                         net proceeds of the IPO to
                                                                                                                                              the net proceeds will be used to
                                                                                                                                              The Company also plans to build
                                                                                                         complete development of the lead
Story            marking a recent development in
                 minimally-invasive surgery and aims
                                                             pending and a broad pipeline of
                                                             products at various stages of
                                                                                                         product range and advancement
                                                                                                                                              business development resources
                                                                                                                                              for Europe and the US ahead of
                                                                                                         of their pipeline, as well as fund
                 to improve medical intervention             development and expects to                                                       the launch of the CROMA
                                                                                                         research and development into
                 outcomes by applying microwave              obtain regulatory approval for its                                               electrosurgery platform and the GI
                                                                                                         further applications of the
                 and radiowave energy to surgical            first device in Europe during 2017                                               suite.
                                                                                                         products.
                 endoscopy.                                  and in the US in 2018.

Source: LSE, company website, Dealogic, FactSet, July 2019
Price performance rebased to 100 as at date of admission                                                                                                                    31
Case Study
                                   Oxford BioDynamics
Company name                         Oxford BioDynamics Plc
LSE market                           Pharmaceuticals & Biotechnology
FTSE ICB sector                      AIM
Main country of operation            UK
Admission date                       06 December 2016
Money raised at admission            $25.0 million
Market cap at admission              $170.0 million
Current market cap                   $697.0 million
                                     Stifel Nicolaus Europe Limited
Bookrunner(s) / Nomad
                                     (bookrunner and Nomad)

“We are delighted to be joining AIM at such a pivotal time in the                                Top 5 Institutional Investors (value held $m)
Company's development. The successful IPO is another significant
milestone for Oxford BioDynamics, and we wouldn't have been able                                 Vulpes Investment Management Pte Ltd.                                 101.8
to achieve this without the dedicated hard work of all our                                       Prudential Plc                                                        101.5
employees.”
                                                                                                 Hargreaves Lansdown Plc                                                30.4
Christian Hoyer Millar, Chief Executive Officer                                                  Canaccord Genuity Group, Inc.                                          29.4
                                                                                                 Aviva Plc                                                              22.6
                   Oxford BioDynamics is a revenue-
Listing            generating, biotechnology
                   company focused on the discovery
                                                             The money was raised to expand
                                                                                                       The company was floated on AIM
                                                                                                       by Placing 12.5 million Ordinary at
                                                                                                                                             In October 2017, the US Patent
                                                                                                                                             and Trademark Office granted
                                                             in the US and increase the
Story              and development of novel
                   epigenetic biomarkers for use
                                                             company's patent portfolio. The
                                                                                                       $2.10 (158 pence) per Share.
                                                                                                       Stifel Nicolaus Europe Limited
                                                                                                                                             Oxford BioDynamics a patent
                                                                                                                                             covering its EpiSwitch platform,
                                                             funds are expected to provide
                   within the pharmaceutical and                                                       acted as the Nomad for the            which should support the firm as it
                                                             sufficient working capital for at
                   biotechnology industry.                                                             company.                              looks to build its business in the
                                                             least three years.
                   The Company's proprietary                                                                                                 US.
                   technology platform,

Source: LSE, company website, Dealogic, FactSet, July 2019
Price performance rebased to 100 as at date of admission                                                                                                                    32
Case Study
                                   Mereo BioPharma
Company name                         Mereo BioPharma Group Plc
LSE market                           AIM
FTSE ICB sector                      Pharmaceuticals & Biotechnology
Main country of operation            UK
Admission date                       9 June 2016
Money raised at admission            $16.7 million
Market cap at admission              $208.9 million
Current market cap                   $50.0 million
                                     Cantor Fitzgerald Europe (Nomad),
Bookrunner(s) / Nomad
                                     RBC Europe (bookrunner)

“We are very excited to be joining AIM, allowing the Company to                                    Top 5 Institutional Investors (value held $m)
take the next logical step towards realising our vision of becoming a
leading speciality biopharma company. We have raised over £90                                      Woodford Investment Management Ltd.                                   13.5
million from institutional investors since July 2015 which has
                                                                                                   Invesco Ltd.                                                           9.6
allowed us to acquire three carefully selected clinical stage pipeline
assets from Novartis and quickly advance these product candidates                                  Canaccord Genuity Group, Inc.                                          1.4
into new clinical studies.”
                                                                                                   City Financial Investment Co. Ltd.                                     0.2
Denise Scots-Knight, Chief Executive Officer                                                       County of West Yorkshire                                               0.1

                                                             Mereo’s initial portfolio of three
Listing            Mereo’s focus is the development
                   of innovative medicines that have
                                                             Phase 2 product candidates was
                                                                                                         On admission, the company raised
                                                                                                         a total of $16.7 (£14.8m)             In October 2017, the company
                                                             acquired from Novartis and the              comprises a private placement of      reached an agreement with
Story              the potential to significantly
                   transform the lives of patients
                                                             Company has already commenced               Ordinary Shares raising $ 12.8m       AstraZeneca for an exclusive
                                                             two new Phase 2 clinical studies in         (£11.35m) at a price of 225p per      license, including an option to
                   suffering from rare and other
                                                             2016 and it also intends to                 share, and a $3.9m (£3.46m)           acquire, AZD9668, an oral inhibitor
                   specialised conditions around the
                                                             commence registration studies for           convertible note from on one of its   of neutrophil elastase.
                   world.
                                                             its lead product during H2 2016.            existing investors, Novartis.

Source: LSE, company website, Dealogic, FactSet, July 2019
Price performance rebased to 100 as at date of admission                                                                                                                     33
Case Study
                                    MaxCyte
Company name                          MaxCyte Inc
LSE market                            AIM
FTSE ICB sector                       Health Care Equipment & Services
Main country of operation             USA
Admission date                        29 March 2016
Money raised at admission             $14.2 million
Market cap at admission               $43.2 million
Current market cap                    $82.7 million
                                      Panmure Gordon (bookrunner and
Bookrunner(s) / Nomad
                                      Nomad)

“We are excited to bring MaxCyte to the AIM market today. The                                    Top 5 Institutional Investors (value held $m)
successful completion of our IPO will permit MaxCyte to continue                                 River & Mercantile Group Plc                                     10.0
to build enhancements to our proprietary cell engineering
technology and support our Partners’ ongoing and future needs.”                                  Legal & General Group Plc                                        5.1
                                                                                                 Unicorn Asset Management Ltd.                                    4.3
Doug Doerfler, Chief Executive Officer
                                                                                                 Canaccord Genuity Group, Inc.                                    4.0
                                                                                                 BlackRock, Inc.                                                  2.8
                                                             The money raised was to be used to
Listing            MaxCyte is a US-based developer
                   and supplier of electroporation
                                                             accelerate its growth by investing in
                                                             further developing its CARMA
                                                                                                       MaxCyte floated on AIM on March
                                                                                                       2016 by issuing 14.3 million      The company raised $24.9m in
                   technology and instrumentation to
Story              biotechnology and pharmaceutical
                                                             platform, expand the reach of the
                                                             Company's cell therapy business
                                                                                                       shares to raise $14.2 million.
                                                                                                       Panmure Gordon acted as
                                                                                                                                         March 2017 in a FO to finance
                                                                                                                                         Investments; Expansion; Sales &
                   firms engaged in cell therapy, drug
                                                             and expand the Company's direct           Financial Adviser, Nominated      Marketing; and Research &
                   discovery and development, bio
                                                             sales teams in the US and Europe,         Adviser and sole Broker to        Development.
                   manufacturing, gene editing and
                                                             and expand its network of                 MaxCyte.
                   immuno-oncology.
                                                             distributors in Asia and globally.

Source: LSE, company website, Dealogic, FactSet, July 2019
Price performance rebased to 100 as at date of admission                                                                                                             34
3. AIM: The Leading
   International Growth
   Market
A Snapshot of AIM
   £114 billion raised since launch

                                            Profile of AIM Companies                                        Admissions to AIM - 1995 to 2019 YTD

  350                                                                   899 companies,        600
                                                 294
  300                                                                  aggregate value of
                                                                                              500                                                  UK     International
  250                                                                   £100bn (134 Int’l
                                                                          companies)          400
  200                         157                                160
                                                         144
  150                                  99                                                     300
  100
                                                                                              200
   50                                                                        27     18
    0                                                                                         100

                                                                                                0

                                                                                                    1995
                                                                                                    1996
                                                                                                    1997
                                                                                                    1998
                                                                                                    1999
                                                                                                    2000
                                                                                                    2001
                                                                                                    2002
                                                                                                    2003
                                                                                                    2004
                                                                                                    2005
                                                                                                    2006
                                                                                                    2007
                                                                                                    2008
                                                                                                    2009
                                                                                                    2010
                                                                                                    2011
                                                                                                    2012
                                                                                                    2013
                                                                                                    2014
                                                                                                    2015
                                                                                                    2016
                                                                                                    2017
                                                                                                    2018
                                                                                                    2019
                                    Fundraisings on AIM – 1995 to 2018 YTD                                Industries represented (by no. companies)
                         20                                                                                   6        11
                                                                           Since 1995 c.                                                    Basic Materials
    Money Raised (£bn)

                                      New    Further                                                                   118
                                                                         £114bn raised in                  115                              Consumer Goods
                         15
                                                                       total (£69bn through                                                 Consumer Services
                                                                          further issues)                                     53
                                                                                                    100                                     Financials
                         10
                                                                                                                                            Health Care
                                                                                                                                  98
                                                                                                                                            Industrials
                         5
                                                                                                                                            Oil & Gas
                                                                                                     159                                    Technology
                         0                                                                                                  151
                                                                                                                                            Telecommunications
                              1995
                              1996
                              1997
                              1998
                              1999
                              2000
                              2001
                              2002
                              2003
                              2004
                              2005
                              2006
                              2007
                              2008
                              2009
                              2010
                              2011
                              2012
                              2013
                              2014
                              2015
                              2016
                              2017
                              2018
                              2019

                                                                                                                  88
                                                                                                                                            Utilities

Source: LSE statistics, July 2019
                                                                                                                                                                36
Europe’s Growth Market Engine
 65% of H1 European growth market capital was raised in London

    − In 2019 H1, AIM continued to drive growth market capital in Europe, accounting for 65% of all IPO and FO capital raised and 3.1x more than the
      next European Growth Market (First North)
    − In total, there were 196 deals, raising £215m through IPOs and £2.2bn in FO
    − 8 of the top 10 European growth market deals during H1 took place on AIM, yet again dominating follow-ons

   2019 H1 capital raised across European Growth Markets                                                                                    Top 5 2019 H1 European Growth Market IPOs

                             3                                                                 Other                   140
                                                                                Euronext        1%         Frankfurt                                                           Proceeds
                                                                                                                                                 Company             EGM
                                                                     AIM Italia   2%                          1%                                                                 (£m)
                                                                       3%                                              120
                            2.5                                                                                                               Millenium Hotels      Madrid       224

                                                                                                                                                  Loungers           AIM          83
                                                                      First            Share of EGM                    100
     Capital Raised (£bn)

                             2                                                         capital raised
                                                                                                                                                  Argentex           AIM          46
                                        3.1x more                     North
                                                                      21%

                                                                                                                             No. of Deals
                                        capital raised                                                                                            Mentice          Stockholm      35
                                                                                                                       80
                            1.5                                                                                AIM                               essensys            AIM          28
                                                                                                               72%
                                                                                                                       60
                                                                                                                                            Top 5 2019 Q1 European Growth Market FOs
                             1
                                                                                                                       40                                                      Proceeds
                                                                                                                                                 Company             EGM
                                                                                                                                                                                 (£m)
                            0.5                                                                                                                 Globalworth          AIM         300
                                                                                                                       20
                                                                                                                                                THQ Nordic         Stockholm     173
                             0                                                                                         0                         GB Group            AIM         160
                                  AIM     First North    Other        AIM Italia     Euronext           Frankfurt
                                                                                                                                            Hipgnosis Song Fund      AIM         142
                                          IPO Capital Raised     FO Capital Raised         No. Deals
                                                                                                                                            Greencoat Renewables     AIM         126

Source: Dealogic, July 2019
First North classification includes: FN Stockholm, FN Denmark, FN Finland, FN Latvia, FN Lithuania
                                                                                                                                                                                       37
Euronext classification includes: Euronext Paris, Euronext Amsterdam, Euronext Brussels
Other includes: Oslo Axess, MAB, Nordic Growth Market, NEX and Warsaw New Connect
AIM Offer Sizes Continue to Grow
Liquidity rises as institutional investor pool expands

   — AIM stocks’ representation in funds have continued to grow in recent years as fund remits have broadened to allow a
     greater proportion of their assets to be invested in AIM-listed stocks
   — This has seen the average offer size and market cap at IPO grow, and market liquidity follow its upward trend

  Median offer size and market cap at IPO of AIM companies, 2009-2018   Volume of FTSE AIM All-Share shares traded

        120                                                                                         5
              Median Deal Size
              Median Market Cap at IPO
        100
                                                                                                    4
   $m

                                                                         Volume traded (billions)
         80
                                                                                                    3

         60

                                                                                                    2

         40

                                                                                                    1
         20

                                                                                                    0
          0
                                                                                                     2009 2010 2011 2012 2013 2014 2015 2016 2017 2018
              2009 2010 2011 2012 2013 2014 2015 2016 2017 2018

Source: Dealogic, Bloomberg, FactSet, Morningstar, January 2019
                                                                                                                                                         38
AIM Companies After IPO
 Consistently leading performance in the aftermarket

   — Institutional investors are the investors who are likely to be there for a company’s next round of capital raising and add respectability
     to the shareholder register encouraging others to invest
   — The bulk of institutional assets are long term as are their investment horizons, thus forming a more fundamental view of a company’s
     long term prospects, looking beyond short-run volatility in performance
   — This is extremely important in allowing management teams the time and space to execute their strategic plans which has seen AIM
     IPOs in the last 5 years enjoy price performances of +32% on average

           Post-IPO Price Performance Comparison, 2014-18                                                          Average Holder Type, AIM Companies

  40

  35                   32%

  30
                                                                                                                                                                   48%
                                                                                                                                                                  Institutions
  25

  20
                                                                                                                                                                   26%
  15                                                                                                                                                             Management
  10                                                         8%

   5                                                                                                                                                               23%
   0                                                                                                                                                                  Other
                       AIM                    European Growth Markets ex
                                                         AIM

Sources: Dealogic, FactSet, January 2019
Post-IPO price performance is weighted by market cap at IPO
European growth include ENXT Brussels Alternext, ENXT Paris Alternext, FN Finland, FN Iceland, FN Latvia, FN Lithuania, FN Stockholm, Frankfurt Scale, MAB, Oslo Axess and    39
Warsaw New Connect
Comparing Liquidity
 Similar liquidity as Main Market as a percentage of free float

    Liquidity across AIM and the Main Market
                                          500                                                                                               1.0%
                                                                                     457

                                                                                                                                                   Average Free Float adjusted daily traded volume (%)
                                          450

                                          400                                                                                               0.8%
        Average Daily Traded Value (£m)

                                          350

                                          300                                                                                               0.6%

                                          250       232

                                          200                                                                                               0.4%

                                          150
                                                                                                0.23%                            0.25%

                                          100                                                                                               0.2%

                                           50

                                            0                                                                                               0.0%
                                                    AIM                         Main Market     AIM                           Main Market
                                                Last 6 months Average Daily Traded Value (£m)   Free float adjusted daily traded volume

Sources: Bloomberg, February 2019
*share price performance is weighted by market cap
                                                                                                                                                                    40
Unparalleled Follow On Environment
 Newly listed companies are able to raise additional capital
                                                                                             Median Discount 2                  Median Multiple (x, multiple of previous 30
   ⎯ Over the last 5 years, nearly 50% of newly public
                                                                                                                                days trading) 1
     companies have accessed additional equity capital in
     follow on transactions
   ⎯ Approximately 15% of all FOs since 2013 have been
     conducted by companies that have gone public in the
     same period

   IPOs and FOs, 2013 – 2018

 60%

                   50%
 50%

 40%                                        37%                                                                                                       126x
 30%

 20%
                                                                      15%

 10%

   0%
           % IPOs that have           % IPOs that have    % of all FOs that are
           returned for FO(s)      returned for more than by companies who
                                            1 FO          IPO'd in this period                    -6.7%

Source: Dealogic, January 2019
1) Companies considered are those that had a primary raise at IPO since 2015. Median multiple of 30 days trading: The block size compared to the average daily trading in the 30 days
preceding the issue. (Average of Total Shares / Average ADTV Previous 30 Trading Days).
                                                                                                                                                                                        41
2) premium/discount defined as percentage change from last trade before follow-on offer to offer price. Negative value indicates a discount.
Access to Blue Chip Investors
 For London-listed American small cap growth companies

    Top Institutional Holders of AIM Equities   Value Held ($bn)   Top investors in selected Americas IPOs

           Canaccord Genuity Group, Inc.              3.8
                      Invesco Ltd.                    3.5                  Maxcyte                PureTech Health
             Standard Life Aberdeen Plc               2.7
       Old Mutual Global Investors (UK) Ltd.          2.3
                                                                    Legal & General Investment       Herald Investment
      Woodford Investment Management Ltd.             2.3                  Management                  Management
                    BlackRock, Inc.                   2.3
          Liontrust Asset Management Plc              2.1                                           Woodford Investment
                                                                    Unicorn Asset Management
                                                                                                       Management
                 Octopus Capital Ltd.                 1.9
              Hargreaves Lansdown Plc                 1.9
                                                                         Hargreave Hale            Taaleri Varainhoito Oy
                     Schroders Plc                    1.8
                      Investec Plc                    1.3
            The Capital Group Cos., Inc.              1.3
                                                                             Boku                       Verseon
                  Baillie Gifford & Co.               1.2
                        AXA SA                        1.2
                                                                    Old Mutual Global Investors   Lazard Asset Management
             Janus Henderson Group Plc                1.1
                    Miton Group Plc                   1.1
                                                                     River & Mercantile Asset
                         Fidelity                     1.0                                              City Financial
                                                                           Management
           Affiliated Managers Group, Inc.            1.0
              T. Rowe Price Group, Inc.               1.0           Legal & General Investment       Artemis Investment
                                                                           Management                   Management
               JPMorgan Chase & Co.                   0.9

Source: FactSet, January 2019
                                                                                                                            42
4. A Choice of Routes to
   Market
Choice of Routes to Market
 Choice of Routes to Market – Regulatory Overview
                                                                                    MAIN MARKET                                                                               AIM
Description                         Premium             Sovereign Segment          Standard (shares)            High Growth Segment          Standard (DRs)                 AIM
Domicile                                             Any                                 Any                         UK / Europe                  Any                       Any
                                                                                 EU Regulated Market &                                    EU Regulated Market &      MTF (EU SME Growth
Regulation                             EU Regulated Market & Listed                                             EU Regulated Market
                                                                                        Listed                                                   Listed                    Market)
                                                                                                                                                                        Assessment of
Minimum free float                25% (shares)         25% (shares or DRs)            25% (shares)                      10%                  25% of the DRs
                                                                                                                                                                       appropriateness
                                   75% of business supported by historic                                       Historic revenue growth
Revenue criteria                                                                           n/a                                                      n/a                        n/a
                                      financial information (3 years)                                          of 20% CAGR (3 years)
                                                                                 Prospectus & Eligibility                                 Prospectus & Eligibility       AIM Admission
                                Prospectus & Eligibility letter to UKLA under                                  Prospectus & Eligibility
Admission                                                                         letter to UKLA under                                     letter to UKLA under        Document & Nomad
                                              Listing Rules                                                        letter to LSE
                                                                                       Listing Rules                                            Listing Rules              declaration
                                     Listing Sponsor at admission & for                                                                                              Nominated Adviser at all
Adviser                                                                                    n/a                       Key Adviser                    n/a
                                                transactions                                                                                                                 times

                                                                                                                                                                         Code of issuer’s
Corporate governance                 UK Corporate Governance Code                    DTR statement                 DTR statement              DTR statement
                                                                                                                                                                            choosing
                                                                                                               Percentage ratios as per                              Class tests as per AIM
Significant transactions       Percentage ratios as per Listing Rules (LR10)               n/a                                                      n/a
                                                                                                                     HGS Rules                                                rules
Controlling shareholder                                Sovereign controlling
                                Required (LR6.5)                                           n/a                           n/a                        n/a              Considered with Nomad
agreement                                              shareholder exempt
                                 Notified via RIS*       Notified via RIS*
                                                                                   DTR interim mgmt.                                                                     Notified via RIS
                                   Independent             Interim mgmt.                                          Notified via RIS –
Related Party                                                                         statement                                                                          Nomad fair and
                                shareholder vote**        statement (EEA                                          percentage ratios*         Annual accounts
Transactions                                                                      Disclosed via annual                                                                    reasonable
                                 Sponsor opinion               shares)                                            Annual accounts
                                                                                        accounts                                                                        Annual accounts
                                 Annual accounts          Annual accounts
                                                                                No shareholder approval            75% shareholder           No shareholder             75% shareholder
Cancellation                             75% shareholder approval
                                                                                         required                       approval            approval required               approval
                                FTSE UK Series,        Ineligible for FTSE UK    Ineligible for FTSE UK         Ineligible for FTSE UK                                  FTSE AIM Series,
Indices                                                                                                                                    Relevant IOB index
                                 where eligible                 series                    series                         series                                           where eligible

*Does not apply to ordinary course transactions. See LR11 for more details / B4 of schedule 5 of A&Ds (HGS).
**Size thresholds and other exemptions apply. See LR11 for more details.
                                                                                                                                                                                       44
Choice of Routes to Market
AIM

              Key eligibility requirements                                          Continuing obligations
              •   Appointment of Nominated Adviser                              •   Retain a nominated adviser at all times, failure to
Eligibility   •   No minimum track record requirement or free    Adviser            do so may result in suspension in the company’s
criteria          float criteria, but company must demonstrate                      shares
                  appropriateness to join a public market        Periodic       •   Audited Annual Report
              •   Pre-admission announcement at least 10         reporting      •   Half yearly financial report
Admission         business days prior to admission                              •   Price sensitive information to be made public
documents     •   AIM admission document                                            without delay
              •   Nomad declaration of appropriateness           Disclosure     •   Significant shareholder notification
              •   AIM Rules for Companies and Nominated          requirements   •   Directors’ dealings notification
Rulebooks
                  Advisers                                                      •   Company website with up-to-date regulatory
              •   Adoption of corporate governance measures as                      information
Corporate         appropriate for the business                                  •   Class tests to assess transactions
governance    •   UK Corporate Governance Code / QCA                            •   Notification of substantial transactions, related
                                                                 Corporate
                  Corporate Governance Code as best practice                        party transactions
                                                                 transactions
                                                                                •   Shareholder approval for reverse takeovers,
                                                                                    fundamental disposals & cancellation

                                                                                                                                        45
IPO Process
 AIM

      Pre-IPO Preparation                                Preparation of the offering                                                        IPO Execution Phase

              4-6 months +                                             2-3 months                                                                       1 month
                                                                                                                                        PUBLIC PROCESS
                                                                                                                                                        Management
        Company                                              Preparation                      Analyst                           Investor
                                  IPO Process                                                                                                            Roadshow,                 Aftermarket
       preparation                                           of the listing                 Presentation                       Education
                                                                                                                                                        Bookbuilding

IPO Readiness           Appoint advisers              Due diligence                  Analysts’ meeting/                Publication of research     Publish admission            Stabilisation
                        (independent adviser /                                       presentation                                                  document
Define business plan    bookrunning banks,            Prepare offering                                                 Signals public “launch”                                  Greenshoe
and strategy            lawyers, accountants) /       prospectus and other           First interaction with            of IPO                      Set valuation range
                        kick-off meeting              legal documents                “junior” syndicate                                                                         Market-making
Financials/                                                                          members                           investor feedback– any      Management
accounting/             Develop equity story          Financial statements                                             concerns + initial          roadshow                     Ongoing research
disclosure                                            prepared for inclusion in      Analysts draft research           valuation thoughts
                        Offer   structure:            prospectus                     reports                                                       Analyse demand/              Investor relations
Capital structure/      •        Type & size                                                                           Monitor market              feedback
dividend policy         •        Timing               Finalise business plan /       Factual accuracy review                                                                    Ongoing obligations
                        •        Listing location/    strategy / equity story                                          Analyse feedback            Sign placing agreement
Corporate structure/             target investors
governance              •        Syndicate            Finalise offer structure                                         Refine offer size,          Pricing and allocation
                                 structure                                                                             valuation
Management              •        Options/ESOP         Develop marketing                                                                            Admission to trading
incentivisation                                       strategy
                        Early look meetings with
Internal controls/      investors and                 Preliminary valuation
systems                 initial assessment of
                        demand

                              Plan the               Ensure basic                                                                                                Price, sign
    Preparation for                                                              Proceed with                 Proceed with                Launch
                             execution               readiness of                                                                                               subscription
     International                                                                 analysts                     investor                (size, price                                 Life as a Plc…
                              phase of               Company for                                                                                              agreement and
        Market                                                                   presentation                  education              range decision)
                            potential IPO             the listing                                                                                             allocate shares

*An admission document, rather than Prospectus, is required under the AIM rules. A Prospectus may be required under the Prospectus Directive unless an exemption is used.                            46
Choice of Routes to Market
Standard Listing of Shares on the Main Market

                    Key eligibility requirements                                                 Key continuing obligations

                •   Minimum 25% shares in public hands in one or more                            •   Annual Report (four months after the end financial
                                                                                Periodic
                    EEA States                                                                       period)
                                                                                Reporting
                •   Minimum market capitalisation GBP 700,000                                    •   Half yearly financial report
Listing Rules
                •   Free transferability of securities
                •   Eligible for electronic settlement                          Disclosure and   •   List of insiders
                •   12 month working capital statement                          Transparency     •   Inside information made public without delay
                •   3 years of audited financial information (or such shorter   Rules            •   Reverse Takeover Rules
                    period that the issuer has been in operation)
                •   Latest accounts no more than 18 months old (if audited                       •   Domestic Corporate governance applied
                                                                                Corporate
Accounts            interims included) or 15 months old (if unaudited                            •   Corporate governance statement in the annual
                                                                                governance
                    interims included). If accounts are older than 9 months,                         report
                    interims must be included.
                •   EU IFRS or equivalent
Corporate
Governance      •   Domestic corporate governance code applies

Prospectus      •   Prospectus approved by the UKLA
Admission &
                •   Compliance with London Stock Exchange's
Disclosure
                    Admission and Disclosure Standards
Standards

                                                                                                                                                    47
Choice of Routes to Market
 Premium Listing on the Main Market

                         Key eligibility requirements                                           Key continuing obligations
                     •   Compliance with the Listing Principles (LR 7)
                                                                                                •   Annual Financial Report (four months after the end
                     •   Appointment of a sponsor
                                                                               Periodic             financial period)
                     •   75% of the business to be supported by a historical
                                                                               Reporting        •   Half yearly financial report
                         financial information
                                                                                                •   Significant transactions (class tests)
                     •   Control over the majority of the entity’s assets
Listing Rules        •   Independent business as main activity                                  •   Pre-emption rights extended to existing
                     •   Unqualified working capital statement                 Listing Rules        shareholders
                     •   Minimum 25% shares in public hands                                     •   Reverse Takeover Rules
                     •   Minimum market capitalisation GBP 700,000
                     •   Free transferability of securities                                     •   Inside information made public without delay
                     •   Eligible for electronic settlement                    Disclosure and   •   List of insiders
                                                                               Transparency     •   Major shareholder notification
                     •   3 years of audited financial information*             Rules            •   Directors Dealings
                     •   Latest accounts no more then 6 months old (Interims                    •   Related party transactions
Accounts
                         included if accounts more than 6 months old)*
                     •   EU IFRS or equivalent                                 Corporate        •   UK Corporate governance – comply or explain
                                                                               governance       •   Statement in the annual report
Corporate
                     •   UK Corporate Governance                               Sponsor          •   To be retained at all times
Governance
Prospectus           •   Prospectus approved by the UKLA
Admission &
                     •   Compliance with London Stock Exchange's
Disclosure
                         Admission and Disclosure Standards
Standards

*Does not apply to mineral or scientific research companies
                                                                                                                                                   48
You can also read