ACWA Power - Business Update Presentation (July 2021) - July 2021

Page created by Hazel Contreras
 
CONTINUE READING
ACWA Power - Business Update Presentation (July 2021) - July 2021
ACWA Power –
Business Update   July 2021

Presentation
(July 2021)
ACWA Power - Business Update Presentation (July 2021) - July 2021
Disclaimer
    This document and the information contained therein (the "Information") has been prepared by International Company For Water & Power Projects (the "Company") for background
    purposes only and does not purport to be full, accurate or complete. No reliance may be placed for any purpose on the Information or its accuracy, fairness or completeness. The
    Information and opinions contained herein are provided as at the date of the presentation and are subject to change without notice. The presentation is the sole responsibility of
    the Company and has not been reviewed or approved by any regulatory or supervisory authority.

    This presentation contains financial information regarding the businesses and assets of the Company. Such financial information may not have been audited, reviewed or verified by
    any independent accounting firm. The inclusion of such financial information in this presentation or any related presentation should not be regarded as a representation or warranty
    by the Company or its affiliates, advisors or representatives or any other person as to the accuracy or completeness of such information’s portrayal of the financial condition or
    results of operations of the Company and its consolidated subsidiaries. Certain information contained in this presentation is based on management accounts, current financial
    statements and estimates of the Company and has not been audited or reviewed by the Company’s auditors. Recipients should not place undue reliance on this information. This
    presentation includes certain non-IFRS financial measures and other metrics which have not been subject to a financial audit for any period. Certain financial and statistical
    information in this presentation has been subject to rounding off adjustments. Accordingly, the sum of certain data may not conform to the expressed total.

    To the extent available, the industry, market and competitive position data contained in the Information come from official or third party sources. Third party industry publications,
    studies and surveys generally state that the data contained therein have been obtained from sources believed to be reliable, but that there is no guarantee of the accuracy or
    completeness of such data. While the Company reasonably believes that each of these publications, studies and surveys has been prepared by a reputable party, neither the
    Company nor any of its directors, officers, employees, affiliates, advisors or agents have independently verified the data contained therein. In addition, certain industry, market and
    competitive position data contained in the Information come from the Company’s own internal research and estimates based on the knowledge and experience of the
    Company’s management in the markets in which the Company operates. While the Company reasonably believes that such research and estimates are reasonable and reliable,
    they, and their underlying methodology and assumptions, have not been verified by any independent source for accuracy or completeness and are subject to change.
    Accordingly, reliance should not be placed on any of the industry, market or competitive position data contained in the Information.

    The Information does not purport to be comprehensive, complete or without error or omission. To the fullest extent permitted by law, neither the Company nor any of its directors,
    officers, employees, agents, affiliates or advisors, accepts any responsibility or liability whatsoever for (whether in contract, tort or otherwise) or makes any representation, warranty or
    undertaking, express or implied, as to the truth, fullness, fairness, accuracy or completeness of the Information (or whether any information has been omitted from it) or any other
    information or opinion relating to the Company, its subsidiaries, affiliates or associated companies, whether written, oral or in a visual or electronic form, and howsoever transmitted
    or made available or for any loss or liability (including in respect of direct, indirect or consequential loss or damage) howsoever arising from any use of the Information or otherwise
    arising in connection therewith. In giving this presentation, neither the Company nor any of its directors, officers, employees, agents, affiliates or advisors undertake any obligation to
    provide access to any additional information or to update the Information, or to correct any inaccuracies in the Information, including any data or forward-looking statements.

    The Information may include forward-looking statements, which are based on current expectations and projections about future events. These statements may include, without
    limitation, any statements preceded by, followed by or including words such as "target", "believe", "expect", "aim", "intend", "may", "anticipate", "estimate", "plan", "project", "will", "can
    have", "likely", "should", "would", "could" and other words and terms of similar meaning or the negative thereof. These forward-looking statements are subject to risks, uncertainties
    and assumptions about the Company and its subsidiaries and its investments, including, among other things, the development of its business, financial condition, prospects, growth,
    strategies, as well as the trends in the industry and macroeconomic developments in Saudi Arabia and other countries in which the Company operates. Many of these risks and
    uncertainties relate to factors that are beyond the Company's ability to control or estimate precisely, such as future market conditions, currency fluctuations, the behaviour of other
    market participants, the actions of regulators and any changes in applicable laws or government policies. In light of these risks, uncertainties and assumptions, the events in the
    forward-looking statements may not occur and past performance should not be taken as a guarantee of future results. No representation or warranty is made that any forward-
    looking statement will come to pass. No one undertakes to update, supplement, amend or revise any such forward-looking statement. Except where otherwise indicated, the
    Information and the opinions contained herein are provided as at the date of the presentation and are subject to change without notice. Past performance of the Company
    cannot be relied on as a guide to future performance. Nothing in this presentation is to be construed as a profit forecast.

    THIS PRESENTATION DOES NOT CONSTITUTE OR FORM PART OF ANY OFFER FOR SALE OR SOLICITATION OF ANY OFFER TO BUY ANY SECURITIES NOR SHALL IT OR ANY PART OF IT FORM THE
    BASIS OF OR BE RELIED ON IN CONNECTION WITH ANY CONTRACT OR COMMITMENT TO PURCHASE ANY SECURITY.

    Information in this document was prepared as of June 2021.

1
ACWA Power - Business Update Presentation (July 2021) - July 2021
Agile high growth contracted power & water champion
    Platform of 64(1) assets across 13 countries, 3,500 employees with strong growth pipeline and leading the energy transition
              Key current markets

                                                                             Asset portfolio of ~USD 66bn(2)

                                                                             Large world class assets with ~71% of capacity in projects with at least 1 GW of
                                                                             capacity

                                                                             Clean / low CO2 power technologies(3): ~77% of total gross capacity(1)

                                                                             At the forefront of energy transition: Significant visible growth in renewables
                                   Top I(W)PP platform
                                   in GCC
                                                                             Industry leading win ratio (68% from 2005-2020), capturing disproportionate
                                                                             market share
         KSA & wider GCC         Asia       Africa
                                                                                                                                         Ground-breaking investment in the
                                                                                                                                         Jazan combined cycle mega-
                                                                                                                                         project producing industrial gases
                                                                                                                                         Achieved world’s lowest power tariff
                                                                                                                                         at DEWA V PV (at the time)
                                                                         Commissioned world’s            Successful and
                                                                         then largest CCGT in            accretive capital
                                                                         KSA                             recycling - monetizing                                              Recent Developments
                                                                                                         stakes in select
                                                                                                                                          41.6
                                                                         International expansion         renewable assets to Silk                                        •    Joint development
                                                                         into Morocco, South             Road Fund                                                            agreement for 70% of
         Successful bids for 2           Successful bids                 Africa, Jordan
         I(W)PPs in the KSA              in the KSA                                                                                                                           Vision 2030 58.7 GW
                                                                                                          22.6                                                                renewables target
                                                                          14.5
                                                                                                                                                                         •    One of the world's
                                          6.5                                                                                                        6.4                      largest green hydrogen
          1.3      1.0                               2.3                            2.4                             2.8                                                       projects under planning

              2006                           2010                             2014                            2018                            Jun-21                     •    World’s lowest solar tariff
                                                                                                                                                                              ($0.0104/kWh)
                                        Gross Power Portfolio (GW)               Gross Contracted Water (mm m3/ day)
                                                                                                        (mn m3/day)

                     Source: Company information. Notes: Power portfolio and water portfolio shown on different scale. (1) Including under construction and advanced development projects as of June
2                    2021. (2) Total project costs for operating, under construction, and advanced development assets. (3) Clean / low CO2 technologies include solar, wind and gas, but exclude coal
                     and oil.
ACWA Power - Business Update Presentation (July 2021) - July 2021
Developer, investor and operator of critical power and water
     assets, with embedded portfolio and capital optimisation
                                               $
               Develop             1                Invest      2                Operate      3               Optimise    4

    Critical assets in                  Lead investor with        Standardized                  Financial and
     fundamentally strong                 significant stake & de-    operating model                operational initiatives to
     growth markets                       facto control              (NOMAC)                        further optimise the
                                                                                                    portfolio
    At the forefront of the             ESG centric investment Operation of plants to
     energy transition                    focus                   the highest global               Efficient capital structure
                                                                  standards                         through re-financings
    Long-term P(W)PAs                   Scalable investment
     with high-quality                    platforms in each         Strong use of                 Capital recycling
     counterparties and                   geography to               digitalisation to              strategy with sell-downs
     resilient cash flows                 enhance returns &          improve asset
                                          efficiencies               performance
                                                                                                   Post P(W)PA
    Focus on innovation,                                                                           opportunities
     cost leadership and                 Diversified across        Economies of scale
     turn-key EPC                         technologies and           and synergies from
                                          geographies                replicable and
                                                                     transferrable learnings

                                Premium economics and attractive total returns across the asset life cycle

               Source: Company information.
3
ACWA Power - Business Update Presentation (July 2021) - July 2021
Modern and highly diversified asset portfolio
       Operating mix by gross capacity                                   Average age of portfolio(1)                                            Project split by geography(2) by project
                                                                                                                                                cost
                                                                                           >10 Years                                                            1% 1%
ACWA Power - Business Update Presentation (July 2021) - July 2021
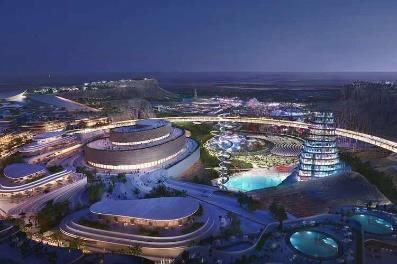
ACWA Power has a strong and highly visible growth pipeline
    Expected growth in gross power capacity                                                              % Renewables                   Expected growth in gross water capacity
    (GW)                                                                                                                                (mm m3/day)
            14.9%                 71.4%                     100%                     57.4%                    62.2%(4)

                         Identified pipeline (~111.3 GW)                                                        139.6                                   Identified pipeline
                                                                                                                                                         (~11.2 mm m3 /day)                        17.0

                                                                                    Active bid
                                  11.8 GW of projects identified
                                                                                   pipeline of                   58.4
                                  between ACWA Power and PIF                        58.4 GW
                                                                                              (3)

                                  scheduled for development by                                                  Active                                                          Active
                                                                                   across ~20                                                                                     bid
                                                                                                                  Bid
                                  2025 subject to MoE approval                      countries                                                                                  pipeline            10.5
                                                                                    including                  Pipeline
                                                                                                                                                                                  of
                                                                                      M&A                                                                                                         Active
                ~4 GW NEOM Green                                                                                                                                               10.5mm
                                                                                                                                                                                                    Bid
                                                                                                                                                                               m3 /day(3)
                Hydrogen Project with Air                                                                                                                                                        Pipeline
                                                                                                                                                                              across 7
                Products announced Jul-                  70% of 58.7
                                                                                                                                                                              countries
                                                          GW KSA
                20                                                                                                                                                            including
                                                         Renewables
                                                                                                                 81.2
                                                           Pipeline(1)                                                                       5.8
                                                                                                                                                                                M&A
                                   13.3                                                                           ex.                                          0.6
                                   ~4.0                                                                         Active                                                                              6.4
             28.3                   9.3                                                                           Bid               UC       3.0
                                                                                                                                                                                                    ex.
                                                                                                               Pipeline
              8.1                                                                                                                                                                                 Active
    UC
                                                                                                                                                                                                    Bid
             20.3                                                                                                                   OP       2.8                                                 Pipeline
    OP

       Operating &              Adv. Dev.                Vision 2030          Active Bid Pipeline                Total                 Operating &         Adv. Dev.         Active Bid            Total
                                                                  (2)
    Under Construction        (Inc. NEOM)                  PIF SFA                                                                       Under                                Pipeline
                                                                                                                                       Construction
                                                                                                                                          Potential of 1-2 mm m3 /day of additions of
         Potential of > 10 GW p.a. of additions of Operational or Under Construction projects by 2025
                                                                                                                                       Operational or Under Construction projects by 2025

             Visible growth: existing under construction and advanced development projects doubling power and water capacity + additional PIF
                                       Strategic Framework Agreement and compelling bid pipelines to drive robust growth

                       Source: Company information. Advanced Development projects defined as projects where ACWA Power has been awarded a preferred bidder status, has signed the long-term
                       Offtake Agreement, or for some negotiated deals has committed significant financial resources, and is working on achieving financial close. Notes: (1) Excludes 1.5GW Sudair PV Vision
5                      2030 PIF Strategic Framework Agreement Project as captured under advanced development. (2) Strategic Framework Agreement. (3) Projects that are expected to be offered for
                       competitive bidding or are being negotiated in the next two years in markets that the Group would target. Excludes 9 projects being developed under the PIF Strategic Framework
                       Agreement which are captured within the Vision 2030 PIF SFA portion of pipeline. (4) Considers the entirety of the active bid pipeline.
ACWA Power - Business Update Presentation (July 2021) - July 2021
NOMAC – Leading Scalable O&M provider 100% owned by
                          ACWA Power
                          NOMAC at a glance                                                                                  A key source of value creation for ACWA Power
                          Established in 2005, First National Operation and Maintenance
                          Company ("NOMAC") is a wholly owned ACWA Power
                                                                                                                                                   High visibility and secure
                          subsidiary with strong on-the-ground O&M execution
                                                                                                                                                  cash-flows / dividend with
                            •   2,163 employees
                                                                                                                                                   low capital commitment                                   Cash flow
                            •   Operates most of ACWA Power assets
                                                                                                                                                                                                            stream
                            •   Highest operational and quality standards
                                                                                                                                                                                                            from project
                            •   Major overhaul of high-tech plant equipment                                                                                                                                 companies
                                                                                                                  Ensure the
                            •   Development of plant-specific standard O&M procedures                                                                                                                       senior
                                                                                                                 health and
                            •   Bidding / O&M proposals for long-term contracts
                                                                                                                safety of our                                        01                                     to debt
                                                                                                                     people                                                                                 service
                          Select assets operated by NOMAC
                                                                                                                                                        07                       02
                                                                                                                                                                                                            Operating
                                                                                                                                                                                                            the ACWA
                                                                                                                    Vertical
                                                                                                                                                                                                            Power fleet
                                          Rabigh IPP                             Qurayyah IPP                   integration
                                                                                                                    through                         06                              03                      to high
                                                                                                                                                                                                            standards
                                                                                                                     NMES(2)
                                                                                                                                                                                                            preserving
                                                                                                                 unlocking
                                                                                                                                                             05            04                               residual
                                                                                                                 additional
                                     Shuaa Energy PV IPP                       Khalladi Wind IPP                                                                                                            value
                                                                                                               margins and
                                                                                                                                                                                                            notably
                                                                                                               competitive
                                                                                                                                                                                                            through
                                                                                                                   edge for
                                                                                                                                                                                                            digital tools
                                                                                                                   NOMAC
                                       Bokpoort CSP IPP                          DEWA CSP IPP
                                                                                                                            Replicable operations                                  Accumulated expertise in a
                                                                                                                            and learnings across                                   wide range of technologies
                                                                                                                            the project portfolio                                  and cost reductions through
                                                                                                      (1)                                                                          LTSAs(3)
                                      Shuaibah Exp. IWP                   Carbon-neutral giga cities

                                Proven O&M capability across technologies and
                                                                                                                                       Synergistic and scalable operating model
                                              geographies
                                          Source: Company information. Note: (1) NOMAC expected to provide operation and maintenance services to the Red Sea Project (2) NOMAC Maintenance Energy Services; (3) Long
                                          Term Service Agreements.
                      6
C1 - Public Natixis
                                                                                                                    Water      Gas     Heavy Fuel Oil    Tower CSP     Parabolic CSP     Solar PV    Wind    Smart grid
ACWA Power - Business Update Presentation (July 2021) - July 2021
Proven track record of growth with continued momentum from
    new projects coming online

    Operating income before                                     Adjusted profit / (loss) attributable to
                                                                                                                                            Parent operating cash flow (SARmm)
    impairment loss and other expenses                          equity holders of the parent (SARmm)(2)
    (SARmm)(1)

                                            1,949
        1,818          1,842
                                                                                               1,694                                                                                   Additional impact on
                                                                                                                                                                                     POCF from capital gain on
                                                                                                                                                                                       APREH of SAR 581mm

                                                                                                                                                                       1,334
                                                                                                                    1,264

                                                                          1,026                                                                                                            1,064

                                                                                                                                                   876

                                                                                                                                                                              Driven by contributions towards
                                                                                                                                                                             COVID 19 CSR, purchase of land
                                                                                                                                                                            for Riyadh office & settlement prior
                                                                                                                                                                                    year tax assessment

        2018           2019                 2020                          2018                 2019                 2020                          2018                 2019                 2020

                Source: Company information. Notes: (1) Includes share in net results of equity accounted investees, net of tax. (2) Excludes impairment loss of SAR 339mm, SAR 461mm, and SAR 67mm
                in FY18, FY19, and FY20 respectively, and SAR 53mm of corporate social responsibility costs in FY20. Excludes provision for zakat and tax on prior year assessments, extraordinary provision
7               / (reversal) on project development cost, provision / discounting on due from related party (Kirikkale), gain on remeasurement of options the Group has on projects, discounting impact
                on loan from shareholder subsidiary (loan from PIF), accelerated depreciation on revision of PP&E useful life, restructuring costs, gain on disposal of Bowerage IWP, loss due to loss of
                control of Kirikkale, and results of discontinued operations of Kirikkale.
ACWA Power - Business Update Presentation (July 2021) - July 2021
ACWA Power’s key pillars
    Agile high growth contracted power and water champion at the forefront of the energy transition

                    Market: Leader in high growth attractive markets
                                                                                                          1
                    ESG: Energy transition enabler with a strong ESG framework
                                                                                                          2
                    De-risked Business Model & Strategy: Contracted, diversified, resilient and visible
                    cash flows                                                                            3
                    NOMAC: Accretive operational platform
                                                                                                          4
                    Financials: Superior returns across the lifecycle
                                                                                                          5
                Source: Company information.
8
ACWA Power - Business Update Presentation (July 2021) - July 2021
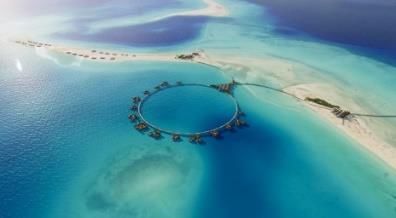
1     Sizeable growth opportunities in key target markets
      Expected Additional Power Capacity by 2030(1)                                                                  Expected Additional Water Capacity
      (GW)                                                                                                           (mm m3 / day)
                    In addition to the markets in which ACWA
                       Power already operates in, there are
                    targeted expansion markets in Asia which                         219
                      are expected to add 136 GW by 2030
                        Additional expansion
                                                                                                                                                                 10.1
                        markets in Asia:                                                                                             9.3          Capacity
                                                                                                                    Capacity                      Growth by           (5)
                                                                        Capacity     95                             Growth by                                     2.6
                  144                                                   Growth                                      2025             1.5          2030
                                                                        by 2030
    Capacity
                                                            122
    Growth
    by 2030(2)
                  58                           Capacity
                                               Growth                                                               Installed
                                        69                  58                                                      Capacity                      Installed
                          Capacity             by 2030
                                                                                                                    2018A                         Capacity                   Capacity          2.2
                          Growth
                                                                        Installed
                                                                                                                                     7.6          2018A           7.5        Growth by
                                        22                              Capacity     124
    Installed             by 2030
                                               Installed                2018A                                                                                                2025             0.5
    Capacity      86      Installed
    2018A
                          Capacity      46
                                               Capacity
                                               2018A
                                                            64                                                                                                               Installed
                                                                                                                                                                             Capacity
                          2018A                                                                                                                                              2018A             1.7
                                                   (3)            (4)                      (4)
                  KSA          GCC excl. KSA               Asia                     Africa                                           KSA                         UAE                        Oman
          Operational Markets                                                                                            Operational Markets

            ~385 GW of total power generation pipeline(1)
                                                                                                                             Aggravating water scarcity situation,
            220 GW of renewable generation pipeline(1) of which                                                              technological advances in desalination solutions
                                                                                                                              and declining production cost strengthen
                 58GW in KSA                                                                                                  rationale for desalination to meet the growing
                                                                                                                              demand for water
            ACWA Power active bid pipeline of 58.4 GW(6) across
                 20 countries                                                                                                ACWA Power active bid pipeline of
                                                                                                                              ~11 mm m3/day across 7 countries

                            Source: Company information. Notes: (1) Based on selected operating and potential expansion countries for ACWA Power where target capacity additions by 2030 are publicly
                            available. Includes capacity additions by 2040 for Philippines, 2025 for Azerbaijan, Bahrain, Cambodia, Egypt, Indonesia, Oman. Excludes Turkey; (2) As of 2019, 0.4GW installed of
                            58.7GW 2030E target; (3) GCC excl. KSA includes Bahrain, Oman, and the UAE; (4) Asia countries of operation: Jordan, Uzbekistan, Vietnam. Expansion markets: Azerbaijan, Bangladesh,
9                           Cambodia, Indonesia, Pakistan and Philippines. Africa countries of operation: Egypt, Ethiopia, Morocco, and South Africa. Excluding 12GW from expansion markets in Africa: Mauritania,
                            Ivory Coast, Kenya, and Tunisia. (5) 1.1 mm m3/day additions in Dubai by 2030, 0.8 mm m3/day in Abu Dhabi and 0.7 mm m3/day in Umm Al Quwain (UAE) by 2022. (6) Excludes 9 projects
                            which fall under KSA renewable generation pipeline.
1    Leading the KSA energy transition
     Vision 2030: Just under 60GW KSA renewables opportunity                                           Diversification into the new frontiers of energy transition
     KSA National Renewable Energy Programme – Renewable
     energy targets (GW) In 2019, KSA announced                                                         Carbon Neutral Giga-cities
                                    a 2030 target of 58.7 GW
                                    of renewables capacity 58.7                                          Vision 2030 – carbon neutral
                                                                           2.7
                                                                                                          renewables powered giga-cities
      Targets revised upward                                                                              with fully integrated utility concept
      in 2020 from initial target                                  16.0
      set in 2016
                                                                                                         ACWA Power – preferred bidder
                                        27.3                                                              for the first megaproject, the Red
                                         7.0
                                                 0.3                                                      Sea Tourism Megaproject
              9.5                                                  40.0

                                        20.0                                                            Green Hydrogen
              2.4      1.2
              5.9
                                                                                                         ~4 GW NEOM Green Hydrogen
         2024E Initial            2024E Revised                  2030E
                                                                                                          Project with Air Products
                                                                                                          announced in July 2020
                    Solar PV               Wind                CSP                                                                                          H2
                                               ACWA Power                        Just under
              Increased
                                               allocated 70%                     60GW of new
              5 year
                                               of renewables                     renewable
                                                                                                           ACWA Power is a regional champion:
              target                                                                                         Poised to capture value from the trends
                                               pipeline                          opportunity
                                                                                                             towards smart grids / distributed
      ACWA Power and the PIF entered into a strategic framework                                             generation
       agreement for ACWA Power to, in addition to being a
       shareholder, lead the development of 70% of KSA's                                                   Giga cities and green hydrogen projects
       renewables target                                                                                     further strengthen ACWA Power’s
                                                                                                             renewable position
      Awarded the first 1,500 MW PV project from the PIF pipeline
       and 800MW PV projects in the non-PIF pipeline                                                       Early mover advantage also enables value
      11.8 GW of projects identified between ACWA Power and PIF,                                            creation in other geographies
       scheduled for development subject to MoE’s(1) approval

                       Source: Company information, KSA National Renewable Energy Programme. Note: (1) Ministry of Energy.
10
1    Leading track record of winning bids across key target markets
     Compelling winning ratios since 2005(1) with 68% overall                                                Award-winning global greenfield developer
     success rate
                                                                                                                                           Best                     EMEA Best               EMEA Best
                                                                                                                                    2018                     2018   Solar Deal       2018
                                                                                                                                           Restructuring                                    Project
                                                                                                                                           in CEE                   (Sakaka)                Finance Deal

           Egypt                               KSA                               RoW(2)                                             2018   EMEA Best         2018
                                                                                                                                                                    EMEA Best
                                                                                                                                                                    Renewable        2018
                                                                                                                                                                                            EMEA Best
                                                                                                                                                                                            Water Deal
                                                                                                                                           Power Deal
                                                                                                                                                                    Energy Deal             (Salalah)

                                                                                                                                           EMEA Best                                        EMEA Best
                                                                                                                                    2017   Water Deal        2017   Africa Best      2017   Project
                                                                                                                                           (Shuaibah)               Solar Deal              Developer

            3/4                              21/29                              24/35               67%
                             75%                                72%                                                                        MENA Solar               MENA Export             MENA Water
          Won bids                          Won bids                           Won bids                                             2019   Deal of the       2019   Finance Deal     2019
                                                                                                                                                                                            Deal of the
                                                                                                                                           Year                     of the Year             Year
                                                                                                                                           (DEWA IV)                (Al Dur)                (Taweelah
                                                                                                                                           MENA Water               MENA Solar PV           IWP)
                                                                                                                                    2018   Deal of the       2018   Deal of the      2018   MENA Sponsor
                                                                                                                                           Year                     Year                    of the Year
                                                                                                                                           (Salalah IWP)            (Sakaka Solar)

          Jordan                             Oman                                 UAE                                               2019   Sponsor of        2019
                                                                                                                                                                    Power Deal of
                                                                                                                                                                    the Year         2018
                                                                                                                                                                                            ME Power
                                                                                                                                                                                            Deal of the
                                                                                                                                           the Year
                                                                                                                                                                    (DEWA)                  Year (Sakaka)

                                                                                                                                                                                            Independent
                                                                                                                                           Gas Power                Solar Power
                                                                                                                                    2019                     2019                    2019   Power
                                                                                                                                           Project of the           Project of the
                                                                                                                                                                                            Producer of
           4/6               67%             8/12               67%
                                                                                6/11                55%                                    Year (Al Dur 2)          Year (DEWA)
                                                                                                                                                                                            the Year
          Won bids                          Won bids                           Won bids                                                    Silver Gas               Bronze Solar            Independent
                                                                                                                                    2018   Power Project     2018   Power Project    2018   Power
                                                                                                                                           of the Year              of the Year             Producer of
                                                                                                                                           (Salalah II)             (Shuaa)                 the Year

                                                                                                                                           Water Project
                                                                                                                                                                                            Renewable
                                                                                                                                    2020   of the Year       2019   Developer of     2018   Company of
                                                                                                                                           (Shuaibah 3              the Year
                                                                                                                                                                                            the Year
                                                                                                                                           Expansion)

       Agile developer of utility scale projects with established track record                                                            Power
                                                                                                                                                                    Power
                                                                                                                                           Generation
                                                                                                                                    2019                     2019   Generation
                                                                                                                                           Project of the
                                                                                                                                                                    Project of the
                                                                                                                                           Year
                                                                                                                                                                    Year (Shuaa)
       Early mover advantage with leading market shares                                                                                   (Salalah II)

                                                                                                                                           Project                  Project                 Bond/Sukuk
                                                                                                                                           Finance Deal             Finance Deal            Deal of the
       Continues to be at the forefront of new technologies and innovative solutions                                               2020
                                                                                                                                           of the Year
                                                                                                                                                             2018
                                                                                                                                                                    of the Year
                                                                                                                                                                                     2017
                                                                                                                                                                                            Year by Debut
                                                                                                                                           (Taweelah)               (Benban)                Issuer

                     Source: Company information. Note: (1) Based on the total number of the Group's submitted bids since 2005G and ranked by winning ratios. Wins include where the Company was
11                   awarded the project or where the Company is the lowest bidder. Bids submitted but not yet decided have been excluded. (2) Includes ACWA Power markets excl. KSA, Oman, UAE,
                     Jordan, Egypt.
1
     ACWA Power is a constant innovator in renewables and is able to
     deliver competitive tariffs across geographies and technologies
     Select Successful Bids
     Tariff
     (USDc/kWh for power assets and
     USDc per m3 for water assets)                                                                                                                               Water
                                                        CSP                                                             Solar PV

                                                                                                                                                         49.49
                                                                                                                                                                         41.30

                              18.90                             16.31
                                               15.67
                                                                                  7.30            5.99
                                                                                                                     2.75          1.70     1.04

     Bid Year                 2012             2014             2014             2017             2015               2018          2019     2020          2018            2019

                                                                                Noor             Shuaa                                    Shuaibah
     Asset                 NOORo I          NOORo II        NOORo III                                         Kom Ombo        DEWA V                   Taweelah      Jubail 3A
                                                                              Energy 1           Energy                                    Solar PV
                            CSP IPP          CSP IPP         CSP IPP                                             PV             PV                        IWP          IWPP
                                                                                 IPP              PV IPP                                      IPP

     Country

                                                                                         (1)                                                            909k m 3         600k m 3
     Capacity                160MW            200MW           150MW            950MW             200MW              200MW      900MW       600MW
                                                                                                                                                         / day            / day

                          World’s largest CSP operating complex                World’s         Formerly the Lowest solar     Achieved       World’s       World’s        World’s
                                                                             lowest CSP           world’s    tariff in the     world’s    lowest solar lowest water lowest water
                                                                                tariff         lowest solar    African     lowest power     PV tariff       tariff         tariff
     Notable                                                                                     PV tariff    continent        tariff at                at the time    at the time
     Achievement(s)                                                          World’s CSP                                     DEWA V PV
                                                                              single site                                   (at the time)              Partially solar
                                                                             plant under                                                                 powered
                                                                            development

                     Source: Company information. Note: (1) 950MW solar hybrid project (700MW CSP and 250 MW PV).
12
2    Net zero by 2050 and an ambitious set of intermediate targets

                                                                                            95%+ Renewables
                                                                                            % of total portfolio capacity in GW

                                                  50%+ Renewables
                  No coal
                                                  Targets share of renewables on
                  No capacity                     total capacity (% of total installed
                  development based on            capacity, GW) 50%+
                  coal
                                                  Renewables represent 66% of the
                                                  total portfolio gross capacity (incl.
                                                  the PIF framework agreement)              2050

                                          2030

                                                                                                   Net Zero
                                           50% reduction in Emissions                              Maximum use of up to 5%
                                                                                                   carbon capture credits
                                           Intensity
                                           ACWA Power will reduce its emissions intensity
                                           by 50% compared to 2020

           Source: Company information.
13
2    ACWA Power – Delivering sustainable value…
     …and driving the achievements of the UN SDGs(1)

      • Best practice corporate governance                                                                  • Leading role in KSA’s Vision 2030
                                                                                                              energy transition
      • Independent board members
                                                                                                                      • No further investments in
        and management team
                                                                                                                        coal: focus on cutting-
                                                                                                                        edge climate-relevant
      • State-of-the art ESG                                                3                     1                     technologies, e.g. green
        reporting & disclosure                                          EMBODYING            LEADING THE                hydrogen
                                                                        CORPORATE             WAY TO DE-
                                                                        EXCELLENCE          CARBONISATION             • Pioneering innovative,
                                                                                                                        renewable-fuelled water
                                                                                                                        desalination
                                                                                      2
                                                                               CREATING SHARED                        • Minimising environmental
                                                                               LONG-TERM VALUE                          impact by enhancing
      • Key economic enabler in the                                                                                     portfolio efficiency
        regions in which it operates

      • Fostering local opportunities and                                                                           Contributing to UN Sustainable
                                                                                                                    Development Goals 6, 7 & 13
        employment is central to the
        company’s overall mission

      Contributing to UN Sustainable Development Goal 8

                 Source: Company information; Note: (1) UN Sustainable Development Goals.
14
2    Corporate governance framework
                                                                                                                            Interface with the group companies
        ACWA Power Intends to be a Role Model in MENA                                                                       Enterprise Risk Management
                                                                                                                            Internal Audit & Control
        Proactive recognition of the value brought by a                                                                    Continuous performance monitoring
         robust corporate governance framework - ACWA
         Power adopted a Code of Corporate Governance in
         2009
        The code was modelled on the best practices rather
         than on a minimum compliance philosophy - Saudi                                                                       Oversight and
                                                                                                                               Management
         CMA, Companies Law, DIFC, the UK Corporate
         Governance Code (formerly the Combined Code)
         and SEBI(1)
        Based on principles of transparency and
         fair administration
                                                                                                                  Internal
        A governance structure in which:                                                                           Code
         – Shareholders have direct influence and voice
         – Board of directors have been formally
           empowered through Board Committees                                                                                          Saudi Arabia’s
                                                                                                                                     Legal & Regulatory
         – Board of directors includes independent directors                                    Code of conduct                        Framework
                                                                                                 and business ethics
        Shareholders have forgone their operational                                            Employee
         involvement and have taken reliance in ACWA                                             compliance
         Power’s management reporting and                                                       Whistle-blowing
         governance structures                                                                   committee
        It is a demonstration of the benefits of an approach
                                                                                                          Constitutional Documents – Articles, By-laws
         based on legitimate enthusiasm as opposed to                                                     External Audit
         mechanical compliance to a code of corporate                                                     Annual Report
         governance and a set of best practice                                                            Sustainability Report

               High level of accountability, transparency, responsibility and fairness in all aspects of the ACWA Power's operations

              Source: Company information. Note: (1) Securities and Exchange Board of India.
15
2    Corporate Social Responsibility
     ACWA Power recognises the necessity for the ultimate consumer to benefit beyond the reliable supply of electricity and
     desalinated water at the lowest costs

                                                         Corporate Social Responsibility (CSR)

        The Group aligns its community investment and engagement strategies with issues that are important not only to the management of its assets,
         but also to the benefit of the surrounding communities. These practices build a strong, long-term foundation for the creation of shared value for
         ACWA Power and the local economies of its target geographies
                                                                         Drive Socio-economic                                  Champion a Sustainable
                    Surpass Legal and Regulatory
                                                                         Development by Creating                               Future for the Power and
                    Compliance Requirements
                                                                         Shared Value                                          Desalination Sectors

        During 2020, ACWA Power committed SAR 52.5m to support national health efforts to contain the impact of COVID-19 in Saudi Arabia and built
         an integrated mobile hospital with a 100-bed capacity in cooperation with a local construction company

                Examples of CSR Initiatives

        Higher Institute for Water & Power                  ACWA Power’s CSR approach in                        Bokpoort CSP Renewables IPP
        Technologies                                        Morocco                                             programme in South Africa
         Self-funding vocational training                 ACWA Power’s CSR approach is                       Bokpoort CSP has redefined the
          institute for the power and water                 designed to meet the needs of local                 Renewables IPP programme in South
          sector, opened in Sep 2011 with 100               communities through participatory and               Africa, where it is not exclusively about
          trainees                                          decentralised activities, and is based on           Power, but equally focused on the
                                                            partnerships with official platforms                development and improvement of
         Provides on-job-training and
                                                           Work with local communities to build                social wellbeing of the surrounding
          employment on graduation to address
                                                            long-term agricultural infrastructure and           communities
          regional unemployment and technical
          skills shortage                                   capacity                                           Partnerships with the community
                                                           Partnership with local associations to              focusing on high-impact project in
                                                            offer programmes to build children’s                consultation with local government and
                                                            capacity to pursue future opportunities             constituencies, focusing on skills
                                                            through events, activities and exposure             development, Enterprise Development,
                                                            to new places                                       and Infrastructure Projects

                   Source: Company information.
16
3    Fully contracted portfolio underpinned by long-term P(W)PAs
     Remaining contract life (years) - Top 20 assets(1) by project cost
                                                                                         Capacity            Water                      KSA and the UAE represent 75%(1) of ACWA
     Geography Remaining contract life by project (years)                                 (MW)           (‘000 m3/day)
                                                                                                                                                 Power projects by project cost
                      Noor Energy 1                                               35           950               --
                      Taweelah IWP                                           30                  --             909
                                                                                                                                             Top 5 countries represent 92%(1) of total
                        Jazan IGCC                                      25                   3,800               --
                                                                                                                                                             project cost
                         Hassyan IPP                                    25                   2,400               --
            Karakalpakstan Wind IPP                                     25                   1,500               --
                The Red Sea Project                                     25                     210               33                          Predominance of large-scale strategic
                  Sirdarya CCGT IPP                                    25                    1,500               --                                assets in key target markets
                       Sudair PV IPP                                    25                   1,500               --
                        NOORo CSP                                  22                          510               --                 Sovereign ratings of the top 5 countries by
                                                                                                                                    project cost
                Petro-Rabigh IWSPP                                20                           520              188
                 Al Dur Phase II IWPP                             20                         1,500              227                        Country              S&P         Moody’s          Fitch

                   Redstone CSP IPP                               20                           100               --
                                                                                                                                    KSA                          A-             A1             A
                         Mourjan IPP                         17                              2,060               --
                              Hajr IPP                    15        Top 5 water only         3,927               --
                                                                                                                                    Oman                         B+            Ba3            BB-
                                                                   projects weighted
                          Sohar 3 IPP                     13                                 1,710               --
                                                                     avg. remaining
                               Ibri IPP                   13      term of ~28 years(3)       1,509               --                 UAE(4)                       AA            Aa2            AA-
                          Rabigh IPP                    12                                   1,204               --
                      Shuqaiq IWPP                   10       Offtake agreements               850              212                 Egypt                         B             B2             B+
                                                               with weighted avg.            2,744              800
                       Marafiq IWPP                  10
                                                             remaining term of ~22                                                  Uzbekistan                   BB-            B1            BB-
                     Shuaibah IWPP                  9                                          900              880
                                                                     years(2)

                    Source: Company information. Gross capacities shown. Notes: (1) Includes operating, under construction and advanced development projects. (2) Excludes Kirikkale as it is a Merchant
17                  offtake model and was fully written down and deconsolidated in 2018. Remaining term weighted by project cost. Includes term for advanced development assets. (3) Includes Taweelah
                    IWP, UAQ IWP, Rabigh 3 IWP, Jubail 3A IWP, and KSA RO. (4) Abu Dhabi only.
3    Backed by a solid investment approach
     To ensure long-term success, ACWA Power aims to minimise costs that contribute to tariffs and maximise efficiency whilst
     keeping delivering electricity and desalinated water at an optimised cost

                                                                                                                               6
                                                                                                     5

                                                                             4

                                                        3                                                                    Reliable Return
                                                                                                    Revenue Covers           Generation Approach
                                                                                                    Costs and Returns
                                                                         Reliable Generation                                 Throughout the duration
                                            2          Capital Intensive of Revenue                 The income generated     of the contracts, ACWA
                                                                                                    is then used to cover    Power’s formula of
                                                       Business          Once complete,             operating costs, repay   reliably delivering power
                                                       Significant         ACWA Power uses the      non-recourse loans at    and water while keeping
                                                       invested capital    facilities to reliably   project company and      the tariffs low, ensures
                                                       upfront to          produce and sell water   recover the capital
                                           Long-term                                                                         client loyalty as well as
                                                       construct a power   and energy over          investment with a
                                           P(W)PA                                                                            timely payment
                1                                      generation and/or   decades, while           return commensurate
                                   Long-term           desalinated water   generating revenues      with the risk taken
                                   contracts to        plant               at the contracted rate
                                   purchase a                              of a few US$ cents per
                                   fixed capacity                          KWh or m3
         Focus on Renewables       of electricity /
         For ACWA Power, the focus desalinated
         is predominantly on       water
         renewables and transitional
         low CO2 projects

                 Source: Company information.
18
3    De-risked business model with fully contracted cash flows

       Price and volume production                                     Offtaker profile                             Inflation and currency exposure                               Fuel supply and resources

     Contracted nature of the portfolio                 Project jurisdictions by credit risk(3)                           Contracted capacity by                                 Pass-throughs or customer
             per project cost                                     per project cost                                             currency(1)(4)                                           provided fuel

                     (1)                                                         (1)
                                                           Non-Investment                Investment                  Floating Currency           USD Indexed /                                                    Pass
                                   Not                                                                                                                                                                                  (6,7)
        Contracted                                             Grade                        Grade                            7%                     Pegged                                                      Through
                                Contracted
          100%                                                  24%                          76%                                                   Currency                                                    Mechanisms
                                   0%
                                                                                                                                                      93%                                                         100%

       Long-term take-or-pay                              P(W)PA with predominantly                                Contracts predominantly                                 Typical full fuel pass-through
        P(W)PAs protect against                             investment grade and / or                                 indexed to USD(5)                                        mechanisms for contracted
        demand or price risk(2)                             sovereign-linked off-takers                              Embedded inflation                                       thermal assets and/or off-
       P(W)PAs contractually                              Overall off-taker risk                                    protection                                               takers supplying their
        protected against potential                         mitigated given the critical                                                                                       own fuel(7)
                                                                                                                     Contracted assets financed
        changes in regulation                               nature of the assets                                      in respective tariff currencies                         Extensive and bankable
       Offtake agreements with                            Sovereign guarantees                                                                                               resource studies for
        weighted avg. remaining life                                                                                                                                           renewables assets mitigate
        of ~22 years                                                                                                                                                           resource risk, CSP technology
                                                                                                                                                                               with storage offers around the
                                                                                                                                                                               clock baseload power

                     Source: Company information. Percentages based on project cost. Notes: Figures based operating, under construction and advanced development projects. (1) Excludes Kirikkale (fully written down
                     and deconsolidated in 2018). (2) For Hassyan, there is supply risk – pass through on the price not the supply. (3) Investment grade: countries with at least one investment grade from S&P, Moody’s or Fitch.
19                   (4) Floating currency includes Khalladi, Ben Ban 1, 2, 3, Kom Ombo, Redstone, Bokpoort, Sirdarya, Bash, Dhankeldy, Azerbaijan IPP; pegged currency includes projects where tariff is indexed to USD. (5)
                     Remaining indexation is to Euros (
3    Total ACWA Power solution to deliver winning tariffs
     Win / win partnering approach to EPC, off-taker,         Development
     OEM, lending institutions                                 Deep engagement with stakeholders to deliver the “total ACWA Power
                                                                solution” to ensure sustainable cost leadership
                                                               Highly experienced team with a track record of ingenuity and
                                                                entrepreneurship

                           Development                        EPC and Equipment
                                                    EPC &
                                                  Equipment    Extensive supply chain partner relationships to obtain most competitive
             O&M
                                                                pricing

                                         Technology            Turnkey solutions with experienced EPC/OEM providers
                    Financing

                                                              Technology
                                                               Dedicated technical in-house team focusing on optimal tailored and
                                                                innovative solutions during the bidding stage unlike conventional "off-
                                                                the-shelf" solutions.
                                                               Focus on renewables / low CO2 generation

                                                              Financing
                                                               Comprehensive project finance expertise and strong relationship with
                                                                lenders
                                                               Proven access to local and international capital markets backed by
                                                                best-in-class operational leverage

                                                              O&M
                        Winning tariffs                        Synergies from standardized, large scale operations
                                                               NOMAC’s scope & know-how reduces cost and improves bid
     Adding value pre and post-bidding by unlocking             competitiveness
        technologies & providing a total solution
                   Source: Company information.
20
3    Overview of a typical P(W)PA’s main conditions
                                                             Conventional Power and Water Assets                                Renewables Assets
                          Tenor                    Long term, usually 15 to 35 years. ACWA Power’s contracts have average remaining life of 22 years

            Resource Structure                     Usually pass through to offtaker or tolling contracts       Variable and estimated on prudent basis

                                                   Capacity payments (remuneration per MW or MIGD of  Long-term take or pay contracts i.e. the offtaker is
                                                    capacity) based on a set of performance parameters             obliged to purchase all electricity produced by the
                                                    (e.g. net heat rate/efficiency factor, availability, etc.) –   project company at a fixed/indexed price
                                                    take or pay basis                                             Fixed O&M payment
                                                   In addition, the project receives energy/output
                       Payments                     payments which are based on actual amount of
                                                    electricity produced or water desalinated (pass
                                                    through)
                                                   Moreover, payments are made for ancillary services
                                                    (frequency control, black starts) when relevant
                                                   Fixed O&M payment

                                                   Sunset date of P(W)PA by which construction has to be  Sunset date of PPA by which construction has to be
       Performance

                                                    completed                                                   completed
                           Construction            Asset delivered has to meet set specifications which will  Asset delivered has to meet specifications set by the
                                                    be tested by the offtaker                                   offtaker

                                                   Contracted performance parameters (e.g. availability  Variable and estimated on prudent basis using
                               O&M                  and efficiency) have to be sustained over the life of the reputable technical consultants/experts, obligations
                                                    P(W)PA                                                    pass through to the O&M contractor

                                                   Prolonged non-payment of the offtaker
                      Termination                                                                               Prolonged non-payment of the offtaker
                                                   Prolonged underperformance of the asset
                                                   Events (eg. fire, floods, earthquakes, tsunami, sandstorms, explosions, acts or terrorism or other events outside of
                     Force Majeure                  the control of the company), additional termination event or time relief provided under the P(W)PA
                     Tripartite Direct             Assign the P(W)PA to lenders in order to ensure project financeability
                       Agreement
      Govt. Guarantee with     Protection clauses in all of its offtake agreements (except one merchant market) against changes in law, such
     Change in Law Protection   as new taxes, increase in tax rates, etc.
                                                   Residual risks (property damage & business interruption) through insurance and reinsurance, over and above
                       Insurance                    potential liability amounts

                              Source: Company information.
21
3    A history of diversified growth primarily from development
     Operating portfolio                                                                                                                             Under construction and advanced development

                                                                                                  Gr o ss               Gr o ss           A C WA                                                                                                                                                               A C WA
                                                                  P C OD                                                                                                                                                      P C OD               Gr o ss C o n t r a c t e d   Gr o ss C o n t r a c t e d
                                       Te c hnol ogy                                          C ont r a c t e d    C ont r a c t e d      P o we r                                                  Te c hnol ogy                                                                                              P o we r
     P r oj e c t N a me                                       ( A c t ua l /                                                                        P r oj e c t N a me                                                   ( A c t ua l /                   P o we r                      Wa t e r
                                        C a t e gor y                                             P o we r              Wa t e r          St ake                                                     C a t e gor y        1Ex p e c t e d )                                                                    St ake
                                                              Ex p e c t e d )                                                                                                                                                                              ( M W)                 ( 0 0 0 ’ m3 / da y )
                                                                                                   ( M W)         ( 0 0 0 ’ m3 / da y )     ( %)                                                                                                                                                                ( %)

                                                               S a udi A r a bi a                                                                                                                                          S a udi A r a bi a
     Shuaibah IWPP                           Oil                    2010                             900                  880               30%      Rabigh 3 IWP                                       Wat er                Q12022                           --                           600                  70%
     Shuaibah Expansion IWP              Elect ricit y              2009                             --                   150               30%      Jubail 3A IWP                                      Wat er                Q4 2022                          --                           600                  40%
     Pet ro-Rabigh IWSPP                     Oil                    2008                            360                   134               99%      S uda i r P V I P P                                 PV                 Q4 2 0 2 4                      1, 5 0 0                        --                  35%
     Pet ro-Rabigh (Phase 2)                                                                                                                         Jazan IGCC                                           Oil                 Q3 2021                        3,800                           --                  25%
                                             Oil                    2018                            160                    54               99%
     IWSPP                                                                                                                                           The Red Sea Project                            PV, Wind, BESS            Q4 2023                         210                            33                  35%
     Maraf iq IWPP                       Nat ural Gas               2010                           2,744                  800               20%
                                                                                                                                                     Neom Green Hydrogen                              PV+Wind                   2025                         4,000                           --                  33%
     Shuqaiq IWPP                            Oil                    2011                            850                   212               32%
                                                                                                                                                     Shuaibah PV IPP                                      PV                  Q3 2023                         600                            --                  50%
     Rabigh IPP                              Oil                    2013                           1,204                   --               40%
                                                                                                                                                     KSA RO                                             Wat er                Q2 2024                          --                           600                  40%
     Hajr IPP                            Nat ural Gas               2016                           3,927                   --               22%
                                                                                                                                                     Qurrayyat PV IPP                                     PV                  Q4 2022                         200                            --                  50%
     Mourjan IPP                         Nat ural Gas               2018                           2,060                   --               50%
                                                                                                                                                                                                                                  Om a n
     Shuaibah 2 IWP                         Wat er                  2019                             --                   250               100%
                                                                                                                                                     Ibri 2 PV IPP                                        PV                    2021                          500                            --                  50%
     Sakaka PV IPP                           PV                     2020                            300                    --               70%
                                                                                                                                                                                                                     U n i t e d A r a b Em i r a t e s
                                                                      Om a n
                                                                                                                                                     Hassyan IPP                                         Coal                 Q12023                         2,400                           --                  27%
     Barka 1IWPP                         Nat ural Gas               2003                            427                    91               42%
                                                                                                                                                     Noor Energy 1                                    CSP + PV                Q4 2022                         950                            --                  25%
     Barka 1Expansion IWP                   Wat er                  2014                             --                    45               42%
                                                                                                                                                     Taweelah IWP                                       Wat er                Q4 2022                          --                           909                  40%
     Barka 1Phase II Expansion IWP          Wat er                  2016                             --                    57               42%
                                                                                                                                                     UAQ IWP                                            Wat er                Q3 2022                          --                           682                  40%
     Salalah 2 IPP - Exist ing           Nat ural Gas               2003                            273                    --               27%
                                                                                                                                                     DEWA V PV                                            PV                  Q12023                          900                            --                  24%
     Salalah 2 IPP - Greenf ield         Nat ural Gas               2018                            445                    --               27%
                                                                                                                                                                                                                               B a hr a i n
     Ibri IPP                            Nat ural Gas               2019                           1,509                   --               45%
                                                                                                                                                     Al Dur Phase II IWPP                            Nat ural Gas             Q2 2022                        1,500                          227                  60%
     Sohar 3 IPP                         Nat ural Gas               2019                            1,710                  --               45%
                                                                                                                                                                                                                                 Eg y p t
     Salalah IWP                            Wat er                  2021                             --                   114               50%
                                                                                                                                                     Kom Ombo                                             PV                  Q4 2022                         200                            --                 100%
                                                         U n i t e d A r a b Em i r a t e s
                                                                                                                                                                                                                             A z e r ba i j a n
     Shuaa Energy PV IPP                     PV                     2017                            200                    --               25%
                                                                                                                                                     Azerbaijan Wind IPP                                 Wind                 Q2 2023                         240                            --                 100%
                                                                    J or da n
                                                                                                                                                                                                                               Et h i o p i a
     CEGCO Asset s                       Nat ural Gas               1995                            692                    --               41%
                                                                                                                                                     Et hiopia PPP Phase 1                                PV                  Q4 2023                         250                            --                 100%
     Zarqa IPP                           Nat ural Gas               2018                            485                    --               60%
                                                                                                                                                                                                                           S out h A f r i c a
     Maf raq PV IPP                          PV                     2018                             50                    --               51%
                                                                                                                                                     Redst one CSP IPP                               CSP - Tower              Q4 2023                         100                            --                  49%
     Risha PV IPP                            PV                     2019                             50                    --               51%
                                                                                                                                                                                                                             U z b e k i st a n
                                                                   M or oc c o
                                                                                                                                                     Sirdarya CCGT IPP                               Nat ural Gas             Q3 2023                        1,500                           --                 100%
     Noor I CSP IPP                    CSP - Parabolic              2016                            160                    --               73%
                                                                                                                                                     Bash Wind IPP                                       Wind                 Q4 2023                         500                            --                 100%
     Khalladi Wind IPP                      Wind                    2018                            120                    --               26%
                                                                                                                                                     Dzhankeldy Wind IPP                                 Wind                 Q4 2023                         500                            --                 100%
     Noor II CSP IPP                   CSP - Parabolic              2018                            200                    --               75%
                                                                                                                                                     Karakalpakst an Wind IPP                            Wind                 Q3 2026                        1,500                           --                 100%
     Noor III CSP IPP                   CSP - Tower                 2018                            150                    --               75%
                                                                                                                                                     T o t a l - U n d e r C o n st r u c t i o n                                                           8,050                         3 , 0 18
     NOOR PV1IPP                             PV                     2018                            135                    --               75%
                                                                     Eg y p t                                                                        Tot a l - A dv a nc e d D e v e l opme nt                                                             13 , 3 0 0                      633
     BenBan 1                                PV                     2019                             50                    --               33%      T o t a l - I n c l u si v e                                                                          4 1, 6 2 3                     6,438
     Ben Ban 2                               PV                     2019                             50                    --               33%
     Ben Ban 3                               PV                     2019                             20                    --               18%
                                                               S out h A f r i c a
     Bokpoort CSP IPP                  CSP - Parabolic              2016                             50                    --               20%        Part of Vision 2030
                                                                   Vi e t n a m                                                                          PIF Strategic                                     Renewables represent 66% of gross capacity
     Vinh Hao 6 PV IPP                       PV                     2019                             41                    --               60%
                                                                                                                                                          Framework                                            when including the PIF programme
                                                                                                                                                          Agreement
                                                                    Tur k e y
     Kirikkale CCGT IPP                  Nat ural Gas               2017                            950                    --               70%
     T o t a l - Op e r a t i n g                                                                 20,273                2,788

                                    Source: Company information. Note: ACWA Power ownership information is updated as of 1-Jun-21.
22
4
     NOMAC, a key source of value creation for ACWA Power thanks
     to a synergetic operating model
                                                                                                                     Significant degree of stability and
                            High visibility and secure cash-flows and dividend                                        predictability: majority of revenues being
                   1        with low capital commitment                                                               fixed (as contracted revenues for services
                                                                                                                      provided)

                                                                                                                     Payment to NOMAC by a Project Company is
                                          Cash flow stream from project companies
                                2         senior to debt service
                                                                                                                      senior to debt servicing (as they are key to
                                                                                                                      the operations)

                                             Operating the ACWA Power fleet to high                                  In-House advanced digitalisation capabilities
                                      3      standards preserving residual value                                      for maximizing operations efficiency and
                                             notably through digital tools                                            mitigating maintenance risks

                                                 Accumulated expertise in a wide                                     Increased risk mitigation capabilities: holistic
                                        4        range of technologies and cost                                       coverage of the entire value chain, from
                                                                                                                      sourcing of spares to engineering and quality
                                                 reductions through LTSAs(1)                                          control

                                                                                                                     Systematically capture synergies from
                                      5          Replicable operations and learnings
                                                 across the project portfolio
                                                                                                                      portable and transferrable experience
                                                                                                                      operating the Group's Projects across its full
                                                                                                                      range of technologies and geographies

                                       Vertical integration through NMES(2)                                          NMES is a key differentiator to capture
                              6        unlocking additional margins, value                                            additional margins and increase NOMAC
                                       creation and competitive edge for NOMAC                                        competitiveness in new bids

                                                                                                                     Uncontested leader when it comes to
               7        Ensure the health and safety of our people
                                                                                                                      standards of health, safety, security and
                                                                                                                      environmental protection operating at levels
                                                                                                                      far above global industry standards

           Source: Company information. Note: (1) Long Term Service Agreements. (2) NOMAC Maintenance Energy Services
23
4    NOMAC contribution and value creation over the project lifecycle

     NOMAC fees contribute at each stage of the project…                         …through a strategic value creation platform
     1                         Enabler for ACWA Power to secure
         Development
                                remarkable hit ratio in bids as it is involved     Standardized operational model guaranteeing
                                at the early stage of the projects                    superior control and understanding of operating
            stage                                                                     assets through their life cycle
                               Engineering, operability review and plant
                                design services
                                                                                   Economies of scales: systematically reduces costs
     2                                                                                across the supply chain without ever
                               Construction supervision services                     compromising quality
         Construction &
                               Initial mobilisation and project
          mobilisation
                                commissioning                                      Monitoring and prediction digital platforms
                                                                                      mitigating operations and maintenance risks: big
                                                                                      data advanced pattern recognition capabilities
     3                                                                                to enhance performance
                               Technical and engineering services as well
                                as maintenance services preserving plant
                                availability and limiting potential outages        Continuous push towards vertical integration
         Operation and          while maintaining residual value                      provides an in-house platform for OEM level
         maintenance           Fixed or variable fees paid by the project            quality services for the generating portfolio, also
                                company as well as incentives payments                enabling better pricing and premium economics
                                depending on the performance of the                   for future projects
                                plant

     4
     Optimise process          Economies of scale and synergies from
      across assets             replicable and transferrable learnings

          NOMAC aims to create value through a standardized operational model that seeks to ensure superior control and
                                    understanding of operating assets through the life cycle

                   Source: Company information.
24
4
     Additional value creation and competitive edge thanks to
     NOMAC Maintenance Energy Services
     Background
      In April 2018G, NOMAC incorporated NOMAC Maintenance Energy Services ("NMES"), a wholly-
       owned subsidiary, whose objective is to provide turn key maintenance requirements and                        54                 44                 98
       specialised maintenance services for the entire fleet of steam turbines, combustion turbines,
       generators, large pumps and other rotating equipment
      Potential additional opportunities for the provision of field services through NMES include:                 Gas              Steam           Electric
                                                                                                                  Turbines          Turbines        Generators
       – Carrying out life time extensions:
               – NMES has signed a life time extension agreement with the Barka 1 IWPP for the upgrade
                 of two of its units
       – Initial spare parts identification and sourcing (“ISPs”):
               – Two initial spare parts agreements have been executed by NMES (Barka 1 IWPP, Al Dur
                 Phase 2 IWPP)
                                                                                                                      Gas turbine               Steam turbine
       – Long-term services and parts supply ("LTSA/LTPA"):
                                                                                                                       services                    services
               – NMES has entered into 13 LTSAs, two LTPAs as well as an LTPA with the Barka 1 IWPP for
                 parts necessary in connection with the life time extension
               – NOMAC's intention is that all LTPAs (including ISPs) for relevant major equipment, to
                 which any NOMAC company is currently a party, will be handled by NMES
       – Centralised warehousing and inventory procurement opportunities and corresponding benefits:
               – NMES has established a procurement team, which is currently focusing on organising                   Generator
                                                                                                                                                Pump services
                 procurement under LTPAs and procurement of materials for operational requirements                     services

       – Provision of services to third parties as an additional income stream.
                                                                                                            
         Potential additional                                                     Price advantages of
                                                   Eliminate intermediaries
         opportunities through                                                    economies of scale and
                                                   in the supply chain
         field services                                                           LT business opportunities
                                                                                                                     Workshop                   Spar erosion
         Additional margins and value creation for NOMAC to be unlocked with the solid                                services                     services
         scalability of the platform
                                                                                                                        Other on-site services: machining,
                                                                                                                    combustion/welding repair, compressor
         Increased competitive edge translating into more competitiveness in future bids                            coating; valve overhauling & repair, on-line
                                                                                                                         safety valve testing, rope access

                    Source: Company information.
25
4    Consistent operational excellence and culture of safety
     Health, safety and environment performance
                                                                                                                                                       Key Highlights
     Lost Time Incident Rate (LTIR)(1)(2)               Recordable Incident rate

                  OSHA industry average                    0.50
                                                                                                                                  ACWA Power and NOMAC relentlessly
                  of 0.70 for construction                                                                                         pursues operating excellence and is an
                    phase and 0.10 for                                   0.40                                                      uncontested leader when it comes to
                   operation phase(2)(3)                                                                                           standards of health, safety, security and
                                                                                       0.30                                        environmental protection operating at levels
           0.15      0.15
                                   0.10
                                                                                                                                   far above global industry standards
                                                                         0.20
          0.05       0.05
                                  0.03
                                                           0.15
                                                                                       0.12                                       Management system ISO certified to 5
                     0.03
                                                                                                                                   standards on a global basis:
           0.03                    0.03
          2018      2019          2020                    2018          2019          2020                                         1.    ISO 9001:2015 - Quality Management System
                                          NOMAC - Operation
                                          ACWA Power overall - Actual                                                              2.    ISO 14001:2015 - Environnemental Management
                                          ACWA Power overall - Target                                                                    System

                   Zero Harm Campaign – Launched in 2015 – One of the First                                                        3.    ISO 27001:2013 - Information Security
                                                                                                                                         Management system
                   GCC-based organisation to adopt this global safety maxim.
                                                                                                                                   4.    ISO 45001:2018 - Occupational Health & Safety
                                                                                                                                         Management System
     Operational    performance(4)
                                                                                                                                   5.    ISO 22301:2019- Business Continuity Management
     Availability Performance                                                                                                            System

           Power Availability                                  Water Availability
                                                                                                                                  Leading LTIR ratio of 0.03 for both ACWA
                                                                                                                                   Power overall and NOMAC (operation
                                                                                                                                   phase) as of 2020, significantly below
                                94%                           95%         94%          94%
                                                                                                                                   industry benchmarks(5) of 0.70 (construction
          90%      90%                                                                                                             phase) and 0.10 (operation phase)

                                                                                                                                  NOMAC achieved as achieved 20 Million
                                                                                                                                   safe man-hours across 24 plant sites in 9
                                                                                                                                   countries as of May 2020

          2018     2019         2020                         2018         2019         2020
                                                                                                                                  Availability performance well above
                                                                                                                                   contractual threshold limits
                      Source: Company information,. Note: (1) ACWA Power overall: ratio includes both full time employees of ACWA Power and temporary contractors. (2) Data on 200,000 Man Hours.
                      (3) OSHA benchmark. “OSHA” refers to the Occupational Safety and Health Administration agency of the United States and OSHA LTIR measures recordable lost time incident rates
26                    on the basis of labour hours so that they are comparable across any industry or group. Based on the 2019 report for days away from work case injuries and illnesses from the bureau
                      of labor statistics. (4) ACWA Power overall; (5) Refers to the OSHA benchmark (US Utility Industry).
5
                           Attractive growth-focused total shareholder return, driven by
                           expanding portfolio of contracted assets

                                 De-risked contracted earnings growth across the IPP value chain (developer,
                                investor, operator)

                                 Efficient capital structure and sound financial profile, with opportunities for
                                further optimisation

                                 Capacity to continue significant investment in greenfield growth and the energy
                                transition

                                Best-in-class project returns generated through the “ACWA Power Total Return”

                                Efficient tax structure with operations in low tax / Zakat countries

                                Attractive growth-focused total shareholder return

                                  Source: Company information.
                      27
C1 - Public Natixis
5    Key financial metrics

                           Metric                               Description                                                        Relevance
                              Operating income
                                                                         Consolidated Operating income before impairment
                            before impairment loss                   •
                                                                         loss and other expenses which also includes share in
                                                                                                                                    •   Management KPI used to track the overall operating
                             and other expenses                          net results of equity accounted investees
                                                                                                                                        results of the business from year to year

                            (“Operating income”)

                            Adjusted profit / (loss)                 •   Adjusted profit / (loss) attributable to equity holders
                                                                                                                                    •   Captures all four parts of the business cycle i.e.
                                                                                                                                        develop, invest, operate and optimise
                            attributable to equity                       of the parent represent profit / (loss) after adjusting
                                                                                                                                    •   Reflects ACWA Power’s ownership stakes in its
                                                                         for non-routine & non-operational items
                            holders of the parent                                                                                       projects

                                                                     •   Distributions received from subsidiaries and               •   Captures all relevant cash flow streams and costs of
                                                                         associates / JVs, after non-recourse debt service and          ACWA Power at parent level, before debt service of
                            Parent Operating Cash                        amortisation, plus other cash inflows at parent level          recourse borrowings
                                 Flow (POCF)                             and cash generated by sell-downs and / or disposals
                                                                                                                                    •   Distributions reflect ACWA Power’s ownership stakes
                                                                         of the Group’s investments, less parent-level
                                                                         expenses (e.g. G&A costs, taxes)                               in its projects

                                                                     •   Parent level net leverage consists of borrowings with
                                                                         recourse to the parent, plus off-balance sheet             •   Reflects recourse debt and debt-like items to which
                                Total parent net                         guarantees in relation to Equity Bridge Loans (EBLs)           ACWA Power has exposure
                                   leverage                              and Equity LCs in addition to the equity-related
                                                                                                                                    •   Excludes non-recourse project finance debt
                                                                         guarantees on behalf of its JVs and subsidiaries, net
                                                                         of cash on hand

                                                                         Parent-level leverage ratio represents net leverage
                              Parent net leverage                    •
                                                                         as a percentage of net tangible equity attributable
                                                                                                                                    •   Additional indication of the recourse leverage
                                      ratio                              to owners of the Company
                                                                                                                                        exposure of the parent

                                      Source: Company information.
                      28
C1 - Public Natixis
5    ACWA Power’s financial building blocks

                                  Develop                                                    Invest                                                        Operate                          Optimise
                                                                                                     Future Income

                                                                            Under
                                  Lead            Operating                                        Advanced                     Other                 Lead Operator                       Financial
                                                                         Construction
                                Developer          Projects                                       development                 Pipeline(1)               (NOMAC)                          optimisation
                                                                           Projects
                                                                                                                                                                                                Operational optimisation
                                                                                                                                                                                               captured within the Invest &
                                                                                                                                                                                                 Operated categories

                                                                               Sources of Income / Cash flow
                           A                        B         Share of Net Income of Projects before      C                                                                       E
                                                                                                                                                NOMAC profit
                                Development                              impairment
                                                                                                                                          attributable to owners of
                                    and                 (Refer to Appendix for asset by asset financial                                         the Company                           Capital recycling
                                construction                            information)                                                                                                     and debt
                                management          D                                                                                                                                   refinancing
                                 services(2)                                 Other operating income and Other income(3)

                                                                                                                -
                                                                                                                                                                                                   Debt refinancing
                                                                                                                                                                                                  proceeds have an
                                                                                                                                                                                               impact on cash flow only
                            F                                                                                                 G
                                   ACWA Power Holding Entities Operating and                                                                          Adjustments and certain

                                                                                                                =
                                              Financing Costs                                                                                             normalisations

                                                    Adjusted ACWA Power's Profit / (Loss) attributable to equity holders of the parent

                                       Notes: (1) Includes PIF renewable programme, greenfield growth, KSA M&A and other potential future development opportunities. (2) Includes project management and advisory and
                      29               cost reimbursement as well, where some fees are earned and collected during construction phase. (3) Other income includes finance income and ACWA Power Reinsurance profits.
C1 - Public Natixis
5
                           ACWA Power’s Profit / (Loss) attributable to equity holders of the
                           parent – building blocks

                                (SARmm)                                       2018           2019           2020            Near-term future drivers
                                                                                                                        •   Driven by (i) already contracted fees from existing projects, (ii) yet-to-be-contracted fees from
                                      Development and                                                                       existing projects, and (iii) fees from new projects expected to be won by ACWA Power
                            A           construction                           312             538           461        •   SAR 505mm, SAR 361mm and SAR 228mm of fees currently contracted for 2021, 2022 and 2023,
                                     management services                                                                    respectively, with upside from the additional projects to be contracted

                                                                                                                        •   Driven by share of income from (i) operational projects, (ii) existing under-construction and
                                                                                                                            advanced development projects coming online, and (iii) new projects expected to be won by
                                      Share of Net Income                                                                   ACWA Power (once operational)
                            B          of Projects before                      427             523           802        •   Income from operational projects is expected to increase due to inflation and deleveraging
                                         impairment(1)                                                                  •   Potential of > 10 GW and 1-2 mm m3 /day p.a. of additions of operational or under
                                                                                                                            construction projects by 2025

                                                                                                                        •   NOMAC’s net income is driven by fees received from projects less NOMAC operational cost
                                           NOMAC profit                                                                 •   Fees received by NOMAC are expected to grow due to (i) inflation indexation of existing
                            C        attributable to owners of                 203             236           337            contracts, (ii) O&M for under-construction and advanced development projects coming
                                                                                                                            online, and (iii) O&M for new projects expected to be won by ACWA Power
                                           the Company
                                                                                                                        •   NOMAC margins expected to remain stable medium-term, with potential longer-term upside

                                                                                                                        •   Driven by long-term contracted fees (TSA, MSA, SSA) from projects and profit from ACWA
                                   Other operating income                                                                   Power Reinsurance
                            D                                                  335             421           435
                                     and Other income                                                                   •   Additional TSA fees of SAR 79mm p.a. are already contracted, and further fees are expected
                                                                                                                            to be contracted from remaining advanced development projects and new projects won

                                   Capital recycling gains /                                                            •   Driven by ongoing capital recycling activities, similar to the renewables sell-down transaction
                            E                                                  387             765            20
                                             (loss)(2)                                                                      to SRF in 2019

                                   Corporate and Holding                                                                •   Includes corporate SG&A costs, development costs written off, financial charges, FX costs and
                            F       Entities Operating and                    (639)          (789)          (790)           tax / Zakat at corporate level, and all other intermediary HoldCo related expenses and
                                                                                                                            consolidated adjustments. Expected to evolve in line with the growth of the business
                                   Financing Costs and FX
                                Adjusted Profit / (Loss) attributable to
                                equity holders of the parent                  1,026          1,694          1,264

                                              Source: Company information. Notes: (1) Figures based on ACWA Power’s effective share of underlying projects’ audited net income which may differ from the audited consolidated
                      30                      financial statements. (2) Include Kirikkale, APREH, RAWEC, Hajr and Karad Gain / (Loss).
C1 - Public Natixis
Near-term evolution of Adjusted Profit / (Loss) attributable to
5
     equity holders of the parent
       (SARmm)

          •    Expected to be higher than LTM June 2020 and FY
               2020A
          •    Key drivers include:                                        Full year contribution by “Project A”:
              • ACWA Power’s share of EBITDA c. SAR 300mm in                                                                                                                                   Driven by all other items
                                                                            Gross capacity: 3,800MW                                                  Driven by incremental fees from
                 2021 subject to completion of Group I asset transfers                                                                                                                         including other income,
                                                                            ACWA Power ownership share: 25%                                        new projects under construction or
                 of Project A in early July 2021                                                                                                                                                 G&A expenses, other
                                                                            ACWA Power’s share of EBITDA in FY 2022G                                 development, partially offset by
              • Growth in NOMAC’s power portfolio under                                                                                                                                           expenses, financial
                                                                                expected to be c. SAR 860 million provided the                       the impact of fees ending due to
                 management                                                                                                                                                                      charges, Zakat and
                                                                                asset transfer is completed as expected                               projects becoming operational
              • Additional fee income generated by projects                                                                                                                                    accounting adjustments
                 achieving financial close such as Sudair, Red Sea,
                 Shuaibah PV and KSA RO projects
              • Partially offset by accelerated depreciation at (SAR
                 195mm)

         Expected to be in line with FY 2020A.
          Further details will be provided with
         the 1H-2020 results update in August

                                                                                                                                             Incremental net income from other projects
              1,264                                                                     Growth in NOMAC’s net income due to                   due to full year contribution, operational
                                                                                           double digit growth in the power                   improvements and efficiencies
                                                                                            portfolio under management &                     Part-year contribution from projects
                                                                                        desalinated water portfolio growth due                expected to become operational in 2022
                                                                                         to commencement of certain water
                                                                                        projects e.g. Jubail 3A, UAQ, Taweelah
     Elimination of 2020 normalizations and
                                                                                                      and Rabigh 3
     addition of normalization for LTIP (see
     previous slide for details)

              FY 2020A            LTM June 2021            FY 2021             Incremental          Incremental NOMAC            Incremental          Additional development     Other items                FY 2022
                                                                               contribution          profit attributable to      contribution            and construction
                                                                         from Project A (excluding owners of the Company      from other projects       management fees
                                                                                 NOMAC)

                            Source: Company information.
31
You can also read