No Exit The Coming Price Collapse of MCD 3/4/2019
←
→
Page content transcription
If your browser does not render page correctly, please read the page content below
3/4/2019   No Exit
           The Coming Price Collapse of MCD

           C. Ross Healy, CFA, Chairman
           WITH ABDULLAH CHANDNA, RESEARCH ASSOCIATE
           STARTEGIC ANALYSIS CORPORATION
1

About the Author:
C. Ross Healy, MBA, CFA
Chairman, Strategic Analysis Corporation
Associate Portfolio Manager, MacNicol and Associates Asset Management

Ross Healy began his investment industry career in 1965 as a securities analyst for Mid-
land Osler Securities. He was a co-founder of Sceptre Investment Council, a leading
Canadian money manager, in 1971. He became Director of Investment Research at Mer-
rill Lynch Canada in 1984, and during this time provided support to the late Dr. Verne
Atrill, the theorist who decoded the mathematics underlying the Theory of Accounting
Dynamics upon which the Strategic Analysis Corporation methodology is based. After
supporting and collaborating with Dr. Atrill for many years, he joined SAC as Chairman
and CEO.
He is a past president of the Toronto CFA Society, and served on the board of the Finan-
cial Analysts Federation (now the CFA Institute) as Chair of the Financial Analysts
Journal. He has served on the Financial Disclosure Advisory Board of the Ontario Se-
curities Commission, and was a member of the Executive Committee of Trinity Col-
lege, University of Toronto, chairing the Investment Committee. He was Chairman of
the Board of Trustees, Eglinton St. George’s United Church.
He continues to contribute investment analysis to print, radio, and television media, re-
cently celebrating his 19th year of monthly (and other) appearances on BNN-Bloomberg
Television.

Publications Relevant to This Analysis
The Bubble and the Bear: How Nortel Burst the Canadian Dream: Douglas Hunter,
Doubleday Canada, 2002. The Financial Post’s Business Book of the Year: Ross Healy
was the “bear” in this book.
Will the Real Laffer Curve Please Stand Up?, Financial Analysts Journal, March/April
1983
How To Beat The S&P 500 Using Credit Analysis Only, Journal of Portfolio Manage-
ment, Spring 1993
Why The Operational Activity Ratio Is So Powerful, Canadian Treasurer, Spring, 1993

Email Address: rhealy@strategicanalysis.ca
Company Website: www.strategicanalysis.ca
Blogsite: The Occasional Contrarian
Company Twitter: twitter.com/svaInsights

              Prepared by Strategic Analysis Corporation – Use at Your Own Discretion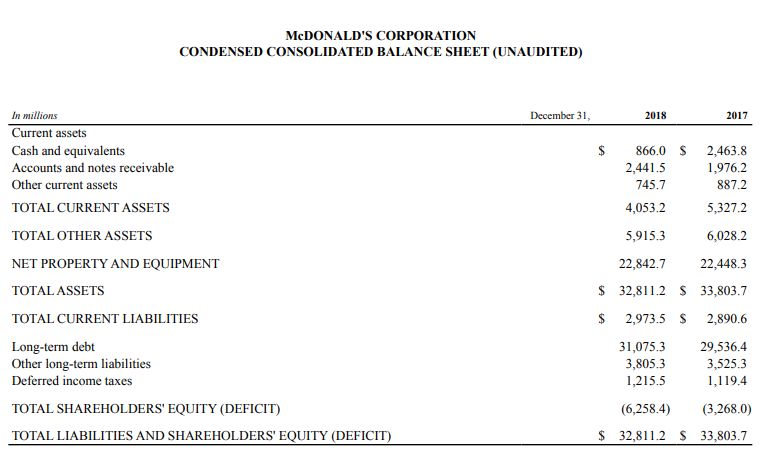
2

The Coming Stock Price Collapse of McDonald’s Corporation

                                      No Exit
We believe that McDonald’s Corporation (“MCD”) can best be described as a hollowed
out ‘bubble’ of a share valuation.
   •   Its current market price has no balance sheet support at all, its sales trend would
       indicate that there are very weak, if any, growth prospects of any significance,
       there is poor earnings support for the current valuation, and the basic credit
       quality has declined substantially. As far as we can see, management has little
       ability to do anything about it, save to buy back more stock and create an even
       more adverse investment situation.
   •   All of the valuation measures for this company that we monitor are either falling
       or are quite weak and when the broad market realizes this, we would guess that a
       severe price retreat will set in as the share price has a very long way to fall before
       it can return to any semblance of “value”. In essence, investors are buying the pre-
       sent value of a stream of increasingly stagnant earnings growth. Using the most
       optimistic of assumptions, the stock is "worth" perhaps half of its current price. In
       short, we see no good outcomes for the shareholders of MCD.
   •   A 50-year examination of the trading history of MCD shows long periods of
       steady, low volatility price growth leading to moments of extreme over-valuation,
       resulting in three massive price corrections. We are in one of those ‘moments’
       now, and we remind investors of the adage that he who does not learn from his-
       tory is doomed to repeat it.
   •   In the end, someone is going to be stuck with this stock and they are going to
       lose a minimum of 55% of the current price, and probably much, much, more
       if the stock price of the company goes to a reasonable and normal discount to its
       intrinsic value as it has in the past, in any bearish market for the stock which may
       lie ahead.
   •   Worse, management has already made up their own minds: in the last 2 years,
       insider selling has been rampant. They are universally selling stock – as, we be-
       lieve, current shareholders would be well-advised to do as well.
   •   In any reasonable time period, we believe that shareholders cannot win at the
       current valuation, they cannot (all) withdraw from the game, and there is nothing
       that management can do to mitigate the risks that those shareholders currently
       face.
   •   What MCD does have, however, is a stunningly high price in the stock market
       and consequently the ability to raise a lot of really cheap equity capital. But

              Prepared by Strategic Analysis Corporation – Use at Your Own Discretion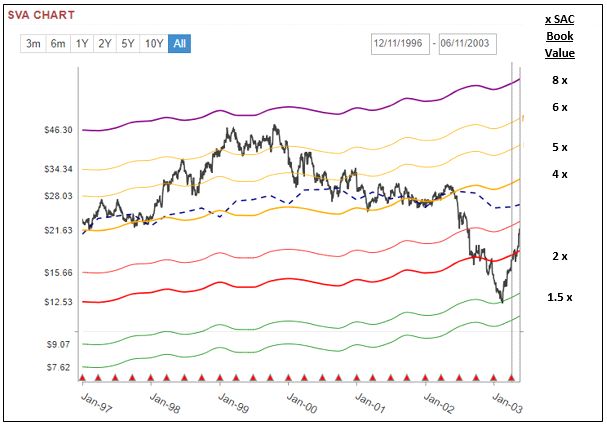
3

             that would reverse their aggressive strategy of buying back stock – which appears
             to have served, thus far, to drive the stock price higher.
In nearly 55 years in the capital markets, we have rarely seen such systematic de-
struction of shareholder equity and balance sheet quality in the name of enhancing
shareholder value, (whatever that means in this day and age). What strikes us is that
the real issue in this current market environment is that management is no longer
creating value, it is creating price – and those two terms are not synonymous. It is no
wonder that we have been seeing very significant insider selling in this stock.
In the analysis which follows, we have set out to establish what the underlying value of
the MCD stock is at the present time. Note that we are not critical of the fundamental
business of the company, nor the financial ability of the company to remain in operation.
But there is a price for everything (its intrinsic value), and everything has a price. When
the two are way out of sync, as is the case with McDonald’s stock today, then huge in-
vestment risks lie ahead for investors.

The SAC Approach to Share Evaluation
When we are evaluating a company for investment, we use a 3-step approach.

            •     First and most important, we analyze the balance sheet, its history, quality,
                  and trend. In our regular television appearances, we are frequently asked how
                  and why we avoided some market catastrophe or other. Most frequently, the
                  reason is that investors did not look at the balance sheet, its quality, structure,
                  and trend.

            •     Second, we look at the valuation of the stock. We use the price/book ratio as
                  our starting point although we modify the book value that we use, using the
                  mathematics of Structural Valuation Analysis (SVA) developed by the
                  founder of our company, Dr. Verne Atrill, which can be found in his book,
                  How ALL Economies Work1.

            •     Third, we compute the intrinsic value of each company.
As will be shown for MCD below, our Structural Valuation Charts show the historical
values for these measures, their current value, and their projected value one year forward.

The Balance Sheet
It is not in fashion to mention balance sheets, let alone actually analyze them in this day
and age of massive share buybacks. Indeed, Messrs. Miller and Modigliani must feel that
they have wakened into some sort of alternate universe which finally reaffirms their

1   How All Economies Work, V.H. Atrill, Dimensionless Science Publications Limited (1979)

                       Prepared by Strategic Analysis Corporation – Use at Your Own Discretion
4
nonsensical hypothesis that leverage does not count in share valuations. We have been
there before, however, in the era of the levered buyouts (LBOs) for instance, and heaven
knows, that ended badly enough. This time, it is even worse, and nowhere more so than
MCD, at least that we have clearly identified so far.
By way of background for MCD, starting in 2015 when its overall sales were topping out,
the company began to buy back stock in earnest. At that time, the quality of the MCD
Balance sheet was very strong in our own credit assessment framework, as well as that of
the standard rating agencies. Since that time, however, all of the shareholder’s equity has
vanished from the balance sheet and ‘hard’ equity now stands at -$6 billion. Funded debt
as a percentage of total assets has risen from roughly 35% 5-6 years ago to close to 94% -
and is still rising.
At SAC, we have a maxim: at the end of the day, what shareholders ‘go to sleep on’ is
the quality of their mattress, the corporate balance sheet. McDonald’s currently offers no
such support, nor is there any prospect that this will change.
Now, we are very far from accusing MCD management of fiscal stupidity. While debt
has been steadily mounting in the company, the vast majority of the debt is very long-
lived in terms of its maturity and so, in a sense, the holders of that debt are actually some-
what like shareholders (but without any upside). While there is the steady requirement to
pay interest, of course, we are sure that management is hopeful that their long-term busi-
ness plan will allow that interest to be paid without financial stress.
SAC calculates a “twin-line” credit score for every company for which we have balance
sheet and price/valuation data. The Base Credit Score is usually quite close to the ratings
from the established rating agencies. We do a further score, however, which takes into
account the share valuation in the stock market, a Normalized Credit Score. We do this
because the alternative to adding additional debt in a company is to raise equity capital,
and the methodology that underscores our approach to analysis determines what the im-
plications are for the credit worthiness of a given company if that ability to raise equity
funds is utilized. [Note: Our internal research shows that when the SAC ratings disagree
with the standard rating agencies, in roughly 82% of the time, the standard agencies will
eventually move towards the SAC rating.]
Using this methodology for MCD, we see that the share buyback period has led to a sharp
decline in the basic credit worthiness of the company, although it remains far from risk-
ing any credit problems. Our own Base rating of B+ corresponds closely to those ratings
from S&P and Moody’s, having fallen significantly from its AA-AAA rating prior to
2014. However, the Normalized Credit Score remains in the AA range and as long as the
share valuation remains high, we would have no quarrel with the credit quality of the
company.
The operative words, however, are “as long as”. A deep plunge in the price of a com-
pany’s shares will often cause creditors to focus more intently on the balance sheet of the
company in question and can exacerbate the share price decline. Chrysler in 1982 was the
Prepared by Strategic Analysis Corporation – Use at Your Own Discretion5
‘poster firm’ extreme for this kind of creditor and market reaction. While we don’t see
that such a plunge would actually impact MCD’s operations, we could certainly en-
visage the situation where the more skittish of investors might think so, particularly if
MCD has continued to buy back shares and produce a larger and larger negative equity
position on its balance sheet.
Source: Company filings
Examining the balance sheet as at December 31, 2018, we note that total Long Term
Debt stands at $31.075 billion against Total Assets of $32,811 billion, or 94.7%. We do
not have the full balance sheet as of yet, but from the September balance sheet, we noted
that one could add in $2 billion for Accounts Payable and Payroll and Other Liabili-
ties. In other words, the numbers show that 100% of the MCD balance sheet is debt off-
setting the asset base. At the present time, we doubt that investors are paying the slightest
amount of attention to this issue, but we would be willing to place a very large wager that
a major price downswing for the common shares will change this perception and perhaps
drastically so.
Prepared by Strategic Analysis Corporation – Use at Your Own Discretion6
Source: SAC Analytics
The Paradigm Shift
Essentially, in a sense, at present the company has no real use for equity capital as the
bond market has provided very long-term funding of the MCD balance sheet at a modest
fixed rate. Consider that after 30 years, the discounted present value of money falls close
to zero, this long-term debt is the equivalent of equity funding – low cost and fixed for
the very long term. In other words, the traditional debt/equity parameters beloved by
Benjamin Graham, B-School professors, and text books everywhere is out the window,
thanks to a pliant debt market supplying near-equity-like debt capital brought about by
the extremely low interest rates of today’s environment. In short, what we are looking at
is a paradigm shift in capital markets utilization and understanding.
Looking at MCD dispassionately, therefore, there are two unconnected ‘silos’. The first
‘silo’ is the balance sheet or operational side of the company, which is completely funded
by debt. Cash flows from the franchises should way more than cover the costs of carrying
that debt, and the company does not appear to be setting aside any monies for debt retire-
ment at the present time – nor does the company need to do so as long as the term of the
balance sheet debt can be pushed off virtually indefinitely, which seems to be very much
the case in today’s financial environment.
The second ‘silo’ is the stock market valuation of the company. The issuance of very
long-term debt has its roots in the share buybacks that the company has carried out. But
now at present, with no equity capital on the balance sheet and no visible need for it,
what is the company to do with its shareholders – of which, presumably, there is (also) no
longer any need? At the present time, the market capitalization stands at $140 billion –
sitting atop a zero-equity capital base, a sort of free-floating apex. This is an amount that
would take a goodly number of years to repurchase at current earnings levels (after
Prepared by Strategic Analysis Corporation – Use at Your Own Discretion7
dividends), especially if we consider the issue of whether or not the company can actually
issue any more long-term debt to repurchase its shares given that current debt levels al-
ready comprise 100% of assets.
Which raises the ultimate question in which we are interested: namely given the above,
what are those shares actually worth in the market of today?
Looking at the Share Valuation
A Structural Valuation Analysis (SVA) stock chart shows the price of a stock and the
price/book boundary conditions that any given stock has traded (within in the past 3
months to 35+ years). Those boundaries are not statistical in nature but flow from the
mathematics of our analysis2, and the values of those boundaries in price/book ratio
terms are the same for all stocks. The reader can visit our website for further information
(www.strategicanalysis.ca ).
We have put in the key price/book values for MCD on the 35-year chart below. Please
note:
• The Net Worth (book value per share) of any company is modified by the addi-
tion of what our mathematics refers to as the value in change (and which we re-
fer of as ‘the value of entrepreneurship’). This typically adds from 3-5% to the
nominal book value as shown in the financial statements. However, it is depend-
ent on the structure of the balance sheet and can vary significantly more than that
depending on the leverage of any given company.
• Therefore that the SVA charts do not recognize “negative net worth” per se.
Even in the absence of tangible book value, there is always “entrepreneurship”
present and that becomes the “book value” that is shown on the chart below (de-
spite the still plunging net worth which has now turned sharply negative). At the
present time, this value is $1.65 per share and is the value used as the multiplier
for our current SVA price/book boundaries where no ‘hard book’ exists.
• The slope of the structural lines is the growth rate of the book value of the
company in question.
• We plot our intrinsic value of the company on our stock charts (the dashed
line). Note that this value is somewhat analogous to a discounted present value
analysis. At present, that our intrinsic value determination is $84 a share, offering
investors a potential downside risk of -54% for the common shares based on the
12-month forward consensus earnings forecast estimate of $8.26 a share. For
nearly all mature stocks, this measure tends strongly to limit upside price
movements most of the time.
2
See footnote page 2.
Prepared by Strategic Analysis Corporation – Use at Your Own Discretion8
• Going back to 1983, the intrinsic value (FMV), the black dashed line, has largely
contained the price movements of this stock. With two exceptions, the first being
1998-2002 and the second being the present time, the intrinsic value (FMV) has
been the ceiling value for MCD. Scrolling through our chart service shows clearly
and visibly that when prices exceed that boundary condition, they tend to revert to
their FMV, and in most cases, the price then falls well below that value.
• The 9 purple coloured boundaries are power law multiples of price/book and
normally tend to be valuation extremes.
• From the legend at the top of the chart, one should observe that the time frame of
each chart can vary from 3 months to as long as 35 years (“All”), depending on
user preference. From the chart below, it is clear that the current valuation of
MCD common shares is grossly extended, at least as we measure it. The question
is, how do you get off the top of a flagpole without sliding down it?
Source: SAC research, Company filings; as of December 17, 2018
Prepared by Strategic Analysis Corporation – Use at Your Own Discretion9
Why Aren’t Analysts and Investors Today More Concerned?
Looking specifically at the SVA chart of MCD for just the 16-year period following the
bear market in 2000-3 shows why analysts and investors today do not fear that a sizeable
decline in the MCD stock price is likely to occur now. The share price had some volatil-
ity in the last bear market but nothing like the overall market itself.
Source: SAC research, Company filings; as of December 17, 2018
Looking specifically at the SVA stock chart for the single year 2008 (below), the price
did plunge some 32%, but that was still less than the 50% plunge in the overall S&P 500,
and just as quickly recovered almost everything that it had lost in the ensuring month.
Prepared by Strategic Analysis Corporation – Use at Your Own Discretion10
Source: SAC research, Company filings
One would have had to have been extremely nimble to have successfully traded the stock
in that period. Unlike the present day and the peak valuation of the stock in 2000, the
share price never did deviate far from our intrinsic value measure – which continued to
rise, drawing the price higher, and into the current bull market period. Regrettably for the
optimists of today, not only is our current intrinsic value measure now well below the
current price, but also, was slipping lower as the valuation heads higher prior to the
‘Trump Bump’ in 2018.
The beta of MCD throughout the 2003-2018 period has averaged close to .5, or half the
overall market average, and share buybacks have offered market support since 2015,
leaving investors with a feeling of invincibility despite the increasingly extreme valuation
of MCD and the overall market itself at this time. Currently, 14 of 15 analysts, all of
whose companies are market-makers for the stock, have buy recommendations on the
stock despite some stated reservations that the shares ‘may’ be a little extended. In the ab-
sence of overall market weakness, it seems perhaps ‘safest’ for the Street analysts to re-
main positive.
Using the last bear market as a reference, it is not surprising that there is little concern
about the current outlandish valuation of the stock: a cursory look at the price history of
MCD would seem to support the lack of need for a defensive approach to the stock at to-
day’s price/valuation levels!
Intrinsic Value Analysis
The final stage of our equity analysis is the determination of the intrinsic value, or, as we
prefer to call it, the Fair Market Value (FMV) of any given company at the present
time, shown as the dashed line on our charts. As noted, our own measure has some
Prepared by Strategic Analysis Corporation – Use at Your Own Discretion11
similarities with the discounted present value approach to analysis, and is based on
‘street’ consensus earnings forecasts. As can be seen in the long term MCD charts above,
the price of MCD shares has generally tended to be bounded by our measure, and this has
been the case for the past 35 years, save for the 1999-2002 period and the current time.
Note that the tendency of stock prices to be bounded by our Fair Market Value measure
tends to be a characteristic of mature companies. For faster growing and young compa-
nies, their price can often exceed the FMV determination, but sooner or later, the FMV
tends to act as a magnet, drawing their prices towards it, most usually in bear markets.
The degree to which price exceeds its FMV is one of our measure of the riskiness of any
given stock that we utilize.
The Measured Current Value of MCD Common Shares
We start with a number of assumptions.
• First, sales of MCD are not about to accelerate away and provide strong growth in
earnings. The company is in a very mature market and is already in 100 countries.
If anything, it is withdrawing from some areas that are not particularly profitable
or promising. Sales per unit have been flat to slipping, despite all manner of pro-
motions. Competition in the casual dining market remains intense, and the de-
mographics of MCD’s market share are not growing. In other words, we have a
mature company in a mature market segment.
• Second, that suggests that long term earnings growth of any significance is un-
likely, save for any growth that flows from continuing share buybacks.
• Third, the company has, like all US companies, been the recipient of a tax wind-
fall (which has caused the current upwards move in the FMV intrinsic value line
on our chart) but we are not looking forward to more of the same, whatever the
current sitting president of the US might like, because of the change in control of
Congress this year coupled with the staggering increase in the federal deficit
which has resulted going forward from the recent tax cut.
In what follows, beyond our own measure, we look at two commonly employed valuation
measures; the discounted present value of the stream of dividends (the Gordon Growth
Dividend Discount Model) and the price to sales ratio. What intrigues us, and we hope
the reader too, is the commonality of output that each of these measures yield. The divi-
dend discount method, the price to sales method, and our own Fair Market Value measure
all put the current share price at about a 100% premium to the intrinsic value as derived.
In addition, the street is disregarding the fact that the shares trade at a 2 standard devia-
tion departure excess as measured by long-term enterprise value to earnings before inter-
est taxes depreciation and amortization (EV/EBITDA), as determined by Raymond
James. As an exercise, below we have reverse engineered the share price to get a sense
of what assumptions need to be priced by the Street into the market value of the company
today.
Prepared by Strategic Analysis Corporation – Use at Your Own Discretion12
Discounted Present Value of MCD’s Dividend Stream
We would reiterate and expand our assumptions:
1. No share issuance: MCD does not appear to need any equity capital at this
juncture, as this would negate the share buyback dynamic so beloved by in-
vestors today.
2. No plans for acquisitions: MCD is not planning an acquisition large enough
to affect its overall size and growth.
3. The company will not be acquired: We are of the belief that no company (in
its right mind) would try to buy MCD, given its balance sheet structure and
extreme market valuation.
4. The company cannot speed the repurchase of shares: MCD will probably
continue to repurchase more of its shares, but the pace of repurchase will be
slower than it has been in recent years. We suspect that the balance sheet is
approaching the limits of its reasonable and sustainable debt burden, or may
not be too far from it. (Additional thoughts that we have on this are presented
after the price to sales discussion below)
5. The market does not actively disfavor the company: We assume that the
market does not change its attitude towards MCD’s credit worthiness and
therefore change the credit spread that the debt currently trades at.
6. Any repayment provisions for that huge load of debt have been kicked suffi-
ciently far down the road that the market is not taking it into account in valu-
ing the shares. That does not mean, however, that this is not an issue to be
dealt with at some point.
Our weakest assumption may well be that the company cannot continue the same pace of
share repurchases that it has in the past by issuing more debt to buy back shares, as it
would therefore go beyond the 100% debt/assets threshold where it stands today. We is-
sue this caveat for the sound reason that we never would have expected that a 100%
debt/assets ratio was acceptable to the capital markets in the first place. However, in ex-
amining the balance sheet, Property and Equipment at cost is $36 billion (before depre-
ciation and amortization of $14 billion). We believe that it is reasonable to assume that
the underlying market value here has not diminished at all as some of this is real estate,
much of which has substantially risen in value. Furthermore, the value of the buildings
themselves may not have diminished as all franchisees are required to maintain their res-
taurants in top condition. To this extent, the balance sheet aggregates, notably the equity,
are understated. Perhaps MCD has entered a new realm in debt financing whereby the
Prepared by Strategic Analysis Corporation – Use at Your Own Discretion13
company could strap on an additional $7-14 billion! While we are not projecting this, we
think that one could make a case that it is possible by stretching our (traditional) capital
markets thinking to and past any usual and reasonable breaking point. (If so, however, we
would hope that McDonald’s would institute an IFRS assessment and restatement.)
In summary, while actual sales have been slipping and MCD’s market is mature, in the
interests of bending over backward to be as supportive to the current share valuation as is
possible, we are prepared to project growth in sales, earnings and dividends into the far
foreseeable future to produce the highest present value that we can. The question now
remains, given the above, can we generate enough present value to provide reasona-
ble support for the current $140 billion of market value, the eventual repayment of
the debt, and – critically – support future share price increases from here?
We believe that we have been generous in our assumptions and therefore we close our
present value analysis by using numbers generated from trends from the more recent past.
We find that when we do, that the present value so produced is not nearly as robust. We
suspect, however, that if the share price fell to the values generated by using our own Fair
Market Value approach as well as the past Price/Sales ratio, and comparing it to that
which prevails today, all of which suggest that the intrinsic value of the MCD shares is
half of the current price, then investors would also be less generous in their assumptions
as to the outlook for the company and its share valuation. If the history generated from
Prepared by Strategic Analysis Corporation – Use at Your Own Discretion14
the 1999-2003 valuation experience holds up, then the share valuation will likely go from
a premium to a discount to all of those measures shown.
In the table below, we have reverse-engineered the share valuation taking into account
the implied market growth assumptions. We must observe from doing the calculations
that the growth rate implied for net income growth under a number of assumptions re-
mains well beyond ‘elusive’ for the company based on their own current and past rec-
ords.
In summary, using present value analysis designed to “make” the shares be fairly valued,
we have to use assumptions of future growth that are nowhere close to either recent expe-
rience or the future potential that any reasonable analyst would support.
Price/Sales Ratio
The current price/sales ratio stands at 6.8 times as of today’s price. This contrasts sharply
(and poorly) with the historic long-term average of about 3.2 times. This roughly 100%
‘premium’ Price/Sales ratio corresponds closely with the approximate 100% premium
that the stock is trading at over its intrinsic value as we measure it, as well as the dividend
discount approach outlined above.
Prepared by Strategic Analysis Corporation – Use at Your Own Discretion15
Considering the two measures, Price/Sales (shown here) and Fair Market Value (shown
elsewhere), the two graphs show that if (when?) the share price undergoes a mean revert-
ing trend change, a price decline of at least 50% is implied.
The Price/Sales ratio graph above starts in 1991, and ends at the current time. When the
data is normalized, it centres around a mean of roughly 3 times Price/Sales.
Other Issues
• What is the real liquidation value of the balance sheet? i.e., are the assets worth
more than their carrying value? For one, the real estate is worth a fair amount over
its balance sheet cost. The problem is that all of the existing assets are covered
with debt, and so to “make” the company worth more in a liquidation, those assets
have to worth a great deal more than their carrying value. The “nut” that we have
to try and cover is the $140 billion in market capitalization which has no visible
backing at all right now, and it is unlikely that we would be able to stretch those
assets by anything like that amount, especially starting with an all-debt balance
sheet and a $6 billion equity deficiency plus the eventual requirement to repay
that $36 billion in debt on the balance sheet in all its forms.
• To close the gap between whatever excess value the balance sheet may possess
(over and above its carrying value), what would be the value of the royalty stream
of payments, assuming that the company converts all of its restaurants to fran-
chises, and simply books (lives off) the stream of royalties that would result? The
issue that we have is that whatever present value metrics we try to deploy, we
have an impossible time filling that $140 billion gap unless we employ assump-
tions that seem to be very unlikely from recent history.
Prepared by Strategic Analysis Corporation – Use at Your Own Discretion16
• This leads us to the almost metaphysical question, what does the current price of
the stock imply and is it supportable?
Profitability is where the company ‘works’, as the profit margins are quite good. Of
course, it is difficult to measure an ROE using standard measures, but using our own
measure of “adjusted book”, it is a scintillating 515%. But that does not move the valua-
tion needle any higher when the stock is already selling for 110 times adjusted book (as
we measure it). That ROE still only makes the shares worth 53 times book in our evalua-
tion methodology, or less than half the current stock price.
Consultant Woody Brock once noted that only about 5% of all analysts pay attention to
the balance sheet (although that was much better than the observed 1% of asset managers
who do so). One of the great concerns that we would have for this stock is what would
happen if the share price really fell sharply in a bear market. In this case, investors would
start to focus on the balance sheet, and would then find the reality that there is no visible
equity – in fact, there is a deeply negative hole – in which to all intents and purposes
100% of the asset base is nothing but debt and “therefore sharply rising interest rates
could severely damage the company”.
Getting From Here to There
If there is one thing that stands out from looking at our analyses of the senior S&P 500
stocks over the years, it is that on the occasions when stocks reach extreme valuations
which vastly exceed their Fair Market Value, sooner or later they fall back to and usu-
ally well below that intrinsic value measure. Looking at the chart of the stock price of
MCD versus our FMV measure going back 35 years, one can see that usually the stock
price has adhered fairly closely to its FMV as a maximum for most of that time. The last
time the share price exceeded the FMV by a significant margin was in 1999-2001, the
previous ‘bubble’ kind of market. The share price then declined by some 75% to its lows
in early 2003 as the share price actually corrected to levels well below the FMV measure
at the time. We also examined the period from 1968-74, the previous time that overall
valuations reached extremes, and found that MCD declined by roughly 72% from 1973-4
after a long steady climb in price and valuation (price/book). As MCD is back to those
lofty heights again, the question for shareholders (and, we presume, management) is what
now? How long can the shares remain this expensive and what, if anything, could man-
agement do to stop another massive price setback?
First of all, can the share valuation remain this high indefinitely?
Anything in the stock market is possible, of course. But MCD is a company whose basic
sales have been declining and whose free cash flow, and cash flow from operations, is
slipping as well. Whether the sales trend since 2015 remains in place, or manages to level
out, it is improbable that it is going to pick up and actually grow to any significant de-
gree. The company would appear to have largely saturated market demand with
Prepared by Strategic Analysis Corporation – Use at Your Own Discretion17
operations or franchises in 100 countries. (It is, in fact, withdrawing from its global reach,
having sold its businesses in Hong Kong and China.) Sales per restaurant have been mod-
estly slipping as well. Although the company is doing all that it can to maintain sales lev-
els on a per restaurant basis, there is no evidence that we have found that they are now
rising or that they even can rise, especially given the competitive landscape for fast food
restaurants.
Can the company continue to buy back stock and shrink the market float in terms of num-
bers of shares? We have no reason to argue that they cannot, save that total debt as per-
centage of total assets is at 100% taking everything into account, which may cause some
investors’ heads to turn – at least those who actually look at balance sheets. With the
shares currently more than 50% above their FMV, however, it will be some trick to buy
enough stock to really change this dynamic in the next year or two (that is, before an
overall bear market rears its ugly head again). This in turn means that shareholders can-
not expect any balance sheet support for the stock price in the immediate future either.
We also note – from the recent experience at Apple – that investors take an increasingly
dim view of managements when the stock that they buy back falls significantly in price.
This is not a stock which is getting cheaper over time. With the equity continuing to melt
deeper into negative territory, if anything, the corporate financial risks are growing stead-
ily. Earlier, we showed our chart of the credit worthiness of MCD, and it is in full retreat.
A key issue which arises when stock prices plunge is that investors and creditors actually
do start to focus on the balance sheet, and what they will see when they do is a nasty
trend. We are not asserting – yet – that creditors will panic when they examine this par-
ticular balance sheet, but a weakening balance sheet conjoined with a falling stock price
can be a lethal combination from a market sentiment point of view.
Is there any possibility that this particular risk could be reversed? We believe that the
short answer is ‘no’. For this to occur would mean that management would cease to buy
back shares – probably one of the key elements in the rising share price in the past few
years – and issue new equity. The company, from our measures, does have the ability to
easily and readily raise about $2.8 billion in equity, but that would essentially dilute earn-
ings per share, and most certainly in the shorter term. As MCD’s ‘equity’ currently stands
at -$6 Billion, this would require a combination of earnings retention and share issuance
just to get back to a zero-equity base. We suspect that shareholders would not look upon
this kind of action in a kindly light, no matter how much financial sense it makes.
As noted initially, the company does have one stunningly valuable asset at its disposal, of
course, and that is its very high market valuation. MCD could use that to make a block-
buster acquisition and in the blink of an eye change the apparent growth outlook, fortify
its equity position with the equity in the target company, and thereby offer a reorientation
of the entire future outlook. The question is, who would they buy? And what credible
management expertise would MCD bring to the table for such an expanded enterprise
such that in doing so, its existing shareholders to would remain positively disposed to-
wards the stock?
Prepared by Strategic Analysis Corporation – Use at Your Own Discretion18
With no equity (but with a pile of very long-lived relatively low cost debt), the company
could “have an epiphany” and become a kind of flow-through share, taking the franchisee
fees and raising its dividend payout to close to 100% of earnings (which would be 4.3%
using current earnings forecasts) and coast through life as a sort of low energy, very low
growth, kind of company. While it’s possible, we doubt that the stock market would con-
tinue to value the shares at nearly the same price level as today. The risks in terms of
growth outlook and potential changes in the interest rate impact might well cause inves-
tors to shy away at current levels. [As an aside, one risk of doing this might well be that
the Dow 30 Index would drop MCD as it did with GE, causing a landslide of stock sales
from ETFs and other related vehicles.]
“MCD as a low volatility, modestly growing income stock” is a nice tale to spin to the
uninformed investor, but “growing” does not fit the future mold of this company, and ex-
treme valuations have always tended to lead to a massive change in price volatility. The
payout ratio could increase, of course, which would add to the lustre of “dividend
growth” but only insofar as no one examines the growth of earnings themselves. After the
‘Trump Bump’ in earnings in 2018, realistically what does lie ahead for earnings growth
in 2019 and 2020, save for anything on a per share basis due to stock buybacks?
If All Those Equity Analysts Are Bullish, What’s Their Exit
point?
After 16 years of a steadily rising price/book valuation from 1.5 times book in 2002 to
either the current infinite multiple (or 112 times book using our ‘book’ definition),
when coupled with a deteriorating balance sheet, slipping sales numbers, and an expen-
sive overall stock market, what sort of selling price/valuation level do the currently bull-
ish analysts have for this stock? We take it that no current analyst remembers 2000-3
when MCD fell 75% versus a market decline of 50% - and that when MCD shares
topped at a mere 8 times book, but, like today, had an FMV measure which was 50% of
the peak price. That period was mostly remembered for the high-tech meltdown, but high
techs were not the only over-valued stocks which suffered mightily in that period. Going
back even further, the previous time in which MCD also had a very nasty decline of more
than 70% occurred in the 1969-74 period when stocks were also highly over-valued (re-
member the Nifty-Fifty?) and MCD had reached the then lofty price/book of 4. Our take-
away from the long history of this company’s stock price volatility is that huge percent-
age declines occur from extreme valuations. But what current MCD analyst has lived
through and remembers 2000-2 let alone 1973-4? (Did we just put up the lone hand?)
We take it that those bullish analysts are blithely assuming that the future will unfold like
the immediate past, without looking back far enough to realize that in the past, MCD was
anything but a low volatility, low investment risk stock all of the time. Extreme valua-
tions do not occur all that often in market history because memories of the resulting de-
clines last a long time – clearly, however, not long enough.
Prepared by Strategic Analysis Corporation – Use at Your Own Discretion19
That the sell side analysts that track this stock are virtually unanimous in providing “buy”
recommendations to their clients, projecting higher prices ahead for the stock is some-
what of a mystery to the casual observer of the facts. We do understand their position
from one key point of view: the markets are high and expensive, and since 2003 MCD
volatility has been much lower than the overall market, dividend growth has been steady,
MCD came through the last bear market virtually unscathed and so “the same thing will
probably happen this time as well”, “valuations don’t count for much in any case”, and
“balance sheets are balderdash”. Ergo, “MCD is a sound, low volatility, decent dividend
investment, which offers considerable safety of capital in an otherwise dangerous invest-
ment environment”. What more does an investor need to know?
Insiders Have Been Selling
We recall, a few years ago, being very concerned about the share valuation of another
company and pointing this out to the CFO. He said that it sounded as if we “didn’t like
the company”. We replied that our concerns had nothing to do with our feelings about the
company itself, only its share valuation. Selling the shares therefore would have nothing
to do with whether or not we “liked the company”.
With MCD, we can put the shoe on the other foot. One thing that strikes us about MCD at
the present time is that using the share sale metric as a measure of whether one ‘likes or
dislikes’ the company would show that ‘management does not like the company’ and
has not for the past couple of years. There has been rampant selling of MCD shares by in-
siders, including $64 million in stock sales by the President and CEO, and only a single
‘buy’ during the period, that being by a new director (who, presumably, was obligated to
become a shareholder). Included in those sales was a sale by the Vice-President and
Chief Accounting Officer, the person who presumably best knows what is going on in
things financial. In total, insiders exercised a lot of options and sold 693,396 shares in the
past 2 years and to the present date, and according to Thomson Reuters, holding on to
only about 300,000 shares in total today.
Prepared by Strategic Analysis Corporation – Use at Your Own Discretion20
Source: SEC filings
Looking at the value metrics, it is very clear (to us) as to why this insider activity has
been so one-sided, given the extremes that the share valuation has reached in comparison
with what has been the norm for many years, not to mention the deterioration in the bal-
ance sheet quality that has accompanied the share buybacks. Management, like us, must
be wondering what on earth the stock market is thinking, taking the share valuation so far
above the usual norms.
In all, according to Thomson Reuters, the share of management ownership in the com-
pany has fallen to 0.4% of the total share float over the past 6 years. Sales of stock shown
above were heavily due to exercise of share options, all of which were sold immediately
into the market.
McDonald’s has had extremely limited success in its Experience of the Future (EOTF)
rollout. The sales lift expected (hoped for) in the US has been muted, and the EOTF is
now not expected to be completed before the end of 2022. In their 3rd quarter 2018 con-
ference call, the company observed that the disruption during remodeling was
greater than anticipated and the sales lift was inconsistent. The changes – supposedly
designed to improve profitability – are being slowed down, and will, of necessity
produce less of a benefit to sales growth beyond 2019 versus the prior expectations.
We are sure that management, being well aware of what is reasonable and what is not, as
well as being aware of the trend of sales, earnings, and new business potential, has wisely
decided to reduce their own risks against the vagaries of the stock market and the ex-
tremes of which it is capable. This therefore begs the question, “if management is vot-
ing with its feet, why aren’t other shareholders reducing their own investment risks
here as well”? Do the analysts and shareholders at large know something that manage-
ment doesn’t? ...Or don’t they?
Evidence of the degree to which management has been able to ‘sell’ the MCD story to in-
vestors comes – oddly enough – from an unusual direction, namely the percentage of the
shares outstanding which have been sold short by the investing community. Of the total
float, 0.8% - or less than 1% - has been sold short, an unusually tiny percentage for a ma-
jor US corporation. This means that there is no safety net under the shares if, as, and
when they start to fall, no investors (anti-investors?) who need to cover offside price po-
sitions and would gratefully use even a fairly modest price decline to do so, thereby sup-
porting the share price when a more concerted and determined decline sets in.
Prepared by Strategic Analysis Corporation – Use at Your Own Discretion21
What Happened in Previous MCD Bear Markets?
Finally, we show the last time that the Fair Market Value exceeded the price by a signifi-
cant degree, the market peak in 1999-2000. Following that excess, the shares corrected,
first back to their FMV (the dotted line) and then to a discount to the FMV.
Note that this further setback was not (apparently) due to any change in the actual earn-
ings and FMV outlook for the company and its stock. Although the earnings and the
FMV did slip a bit in the recession that accompanied the 2000-2 period, as the long-term
valuation chart (above) shows, things quickly got back on stream and the company went
from strength to strength. Unfortunately, the current data does not support a similar long-
term conclusion for the company at this time.
What we can say about bearish price movements is that in a significant price downdraft, a
new set of ideas and targets – revised dynamics – tends to set in as sellers justify their ac-
tions and the analysts attempt to ‘explain’ the reasons for the price decline. In the case of
MCD today, an examination of the recent sales and earnings trends could easily cause a
major revaluation to take place and push the shares significantly below its current FMV.
The current “2 standard deviations above their EBITDA standard multiple” (as reported
by one analyst) could as readily change to “2 Standard deviations below”, as happened in
2000-3. Just as higher prices beget higher prices, as has been occurring in the stock today,
so lower prices beget lower prices in bearish markets for the stock in question.
In 1972-5, the decline of the Nifty-Fifty stocks took MCD down by 72%, well in excess
of the overall market, as excessive valuations were corrected.
Prepared by Strategic Analysis Corporation – Use at Your Own Discretion22
And in 1987, the shares outperformed on the downside as well, although the decline had
already set in in advance of Black Monday.
Update for the 4th Quarter 2018 Results
MCD reported its 4th quarter just as we were finishing our report. The results were en-
tirely in line with the rest of our analysis, so there were no surprises in it. Sales were
down as per their results over the past few years, but earnings per share were up due to
share repurchases and the ‘Trump bump’. What the 4th quarter does underline, however,
is that our assumptions used in computing the present value of the company are overly
optimistic – as we had anticipated they should be. We do not wish to be accused of false
Prepared by Strategic Analysis Corporation – Use at Your Own Discretion23
pessimism in the interests of leading to flamboyant conclusions and so we have deliber-
ately erred on the side of excessive optimism in calculating those values shown above. If
we had assumed a long-term decline of as little as 1% per year, the present value results
would have been very substantially weaker.
We also saw that insider selling (cashing in options and taking profits) remains rampant
and we do wonder how shareholders will take this if – the big IF – the price of the MCD
shares heads down to levels which are line with the actual economic value of the com-
pany. The optics of management selling into share buybacks will – we strongly suspect –
come back to haunt more than MacDonald’s. But worse, the optics of management di-
recting the company to repurchase unbelievably expensive shares (and selling their own
shares at the same time), rather than paying out those monies directly to shareholders, and
then seeing that share price collapse will prove to be a bitter pill for the shareholders to
swallow. Don’t take our ‘wildly imaginative’ supposition as gospel: just ask Apple share-
holders what they think of their management in this regard.
Summary and Conclusions:
When we started our investigation to ascertain why the MCD share valuation was so ex-
treme, we had to assume that there was/are some more or less sound reasons for this to
occur. While we have never seen a valuation among senior equities in the S&P 500 that is
so extreme as this one, we always start by assuming that the market knows something
that we don’t. Whatever that is, however, we still have not found the reasons as of time of
publishing. Analysts reports seem to be all too happy to ride a 16-year tide rather than of-
fering dispassionate, hard-headed and objective analysis about the valuation of the shares
in today’s market environment, notably when compared to a purely objective analysis
such as that of the Gordon Growth Dividend Discount Model present value approach
shown above. Projecting the last 16 years into some indefinite future strikes us as being a
very dangerous approach to investing, particularly when
• The valuation of the company is clearly at an extraordinary extreme.
• The basic growth of the company has slowed to a crawl and seems to be turning
negative. Recent initiatives, the EOTF, to change this trajectory have fallen flat
so far.
• Luck has been on the side of investors in 2018 thanks to the Trump tax cut, but
there will be no follow-through in 2019
• Our 50-year price/valuation research underlines the reality that from time to time,
the share price movements of MCD are anything but benign and low risk
• Management itself has been a major and concerted seller of the stock
• Even if the stock price falls in half as we conservatively project, the yield would
still only be 4.5%, not exactly a show stopper, and the P.E. Ratio would be 11, not
Prepared by Strategic Analysis Corporation – Use at Your Own Discretion24
"cheap" for a no- to low-growth company with an indifferent balance sheet with
no equity
Accordingly, we must conclude that the shares of McDonald’s Corporation (MCD) are a
clear and present danger to investor’s portfolios and should be sold. Like the Roadrunner
cartoon in which Wile E. Coyote chases the Roadrunner to and over the edge of a cliff,
the preconditions necessary to keep the share price of MCD aloft have vanished. When
that realization hits investor awareness, we could expect a very sharp descent!
Note to the Reader
Lest anyone think that we have singled out McDonald’s for special negative treatment, it
is but one (albeit the most extreme) of 19 stocks in the S&P 500 Index which – we fully
expect – will suffer a similar price outcome. MCD is far from the only company which
has severely damaged its balance sheet and consequently its outlook through share buy-
backs.
For further information and access to our valuation service, contact Chris Healy at
info@strategicanalysis.ca.
What Would We Do If We Were Management?
• Sell even more of our own stock if we could. There is really nothing that anyone
can do to support the current valuation. However, it is time to play defense, so
• Stop buying back stock and…
• Raise as much equity as possible and repay all the debt possible
• If 15 investment dealers are willing to recommend this stock at these lev-
els, they would probably love to raise a pile of equity for the company
• Either look for a major acquisition in a growing industry (cannabisburgers any-
one) or…
• Raise the dividend substantially, and
• Settle down to being a nice income stock, respected, loved, but boring. There are
worse fates than this.
[However, if we were the Dow 30 Committee, we would dump this stock ASAP while
the dumping is good.]
E&OE
Prepared by Strategic Analysis Corporation – Use at Your Own Discretion25
Appendix:
Other charts
Figure 1: Trailing twelve-month revenue peaked in the second quarter of 2014, and has been
coming down since then.
Figure 2: Debt as a percentage of total assets jumped from 44% in the first half of 2015 to 94%
as of third-quarter 2018.
Prepared by Strategic Analysis Corporation – Use at Your Own Discretion26
Figure 3: Trailing twelve-month cash from operations (unadjusted) peaked in the first quarter of
2014, and has come down since then.
Figure 4: Quarterly (unadjusted) cash from operations.
Prepared by Strategic Analysis Corporation – Use at Your Own Discretion27
Figure 5: (Unadjusted) Free cash flow per share has not covered the dividend paid out.
Figure 6: Total Long Term Debt climbed from $14 billion in the first half of 2015 to about $32
billion as of third-quarter 2018.
Prepared by Strategic Analysis Corporation – Use at Your Own Discretion28
Figure 7: Quarterly revenue peaked in the third quarter of 2013, and has been coming down since
then.
Prepared by Strategic Analysis Corporation – Use at Your Own Discretion29
Figure 8: While Total debt as a percentage of total capitalization has increased from about 50%
in 2013 to over 100% in 2017, cash provided by operations as a percentage of total debt has sub-
sequently fallen from about 50% to less than 20% over the same time.
Figure 9: Insiders own about 0.4% of the float outstanding, down from over 0.7% in 2013.
Figure 9: Insiders own an increasingly smaller number of shares.
Prepared by Strategic Analysis Corporation – Use at Your Own Discretion30
Figure 10: With negative $6 billion of equity value on the balance sheet, the raw price to book
numbers have collapsed.
Figure 11: Margins have improved, but that is largely due to the decrease in company-owned res-
taurants and the exit from China and Hong Kong.
Prepared by Strategic Analysis Corporation – Use at Your Own Discretion31
Historical Period
2007 2008 2009 2010 2011 2012 2013 2014 2015 2016 2017
Payout ratio (Common stock dividends/Net income) 74% 42% 49% 49% 47% 53% 56% 68% 71% 65% 59%
Common stock dividend per share 1.52 1.63 2.08 2.28 2.56 2.89 3.15 3.34 3.56 3.73 3.89
Payout ratio growth rate -43% 16% -1% -3% 12% 5% 21% 6% -9% -9%
Net income growth rate 80% 6% 9% 11% -1% 2% -15% -5% 3% 11%
Net income $ 2,395 $ 4,313 $ 4,551 $ 4,946 $ 5,503 $ 5,465 $ 5,586 $ 4,758 $ 4,529 $ 4,687 $ 5,192
Common stock dividends $ 1,766 $ 1,823 $ 2,235 $ 2,408 $ 2,610 $ 2,897 $ 3,115 $ 3,216 $ 3,230 $ 3,058 $ 3,089
Shares outstanding 1,165 1,115 1,077 1,054 1,021 1,003 990 963 907 819 794
Average Payout ratio (2007 - 2018) 56% Standard Deviation 9%
Average Payout ratio growth (2009 - 2017) 4% Standard Deviation 10%
Average Net income growth (2009 - 2017) 2% Standard Deviation 8%
Average dividend growth rate (2013 - 2017) -1% Standard Deviation 7%
Forecast Period
Terminal Year
2018E 2019E 2020E 2021E 2022E 2023E 2024E 2025E 2026E 2027E 2028E
Net income $ 5,317 $ 5,444 $ 5,575 $ 5,709 $ 5,846 $ 5,986 $ 6,130 $ 6,277 $ 6,428 $ 6,582 $ 6,740
(i) Payout ratio (assuming 56% average from 2007 - 2018) 56% 56% 56% 56% 56% 56% 56% 56% 56% 56% 56%
(ii) Payout ratio (assuming 4% average growth from 2009 - 2017) 59% 61% 64% 67% 70% 73% 76% 79% 83% 86% 90%
Common stock dividends (i) $ 2,992.27 $ 3,064.12 $ 3,137.69 $ 3,213.03 $ 3,290.18 $ 3,369.18 $ 3,450.08 $ 3,532.92 $ 3,617.75 $ 3,704.62 $ 3,793.57
Common stock dividends (ii) $ 3,122.27 $ 3,336.15 $ 3,564.67 $ 3,808.85 $ 4,069.76 $ 4,348.54 $ 4,646.41 $ 4,964.69 $ 5,304.78 $ 5,668.15 $ 6,056.42
Shares outstanding 773 773 773 773 773 773 773 773 773 773 773
Common stock dividend per share (i) $ 3.87 $ 3.96 $ 4.06 $ 4.16 $ 4.26 $ 4.36 $ 4.46 $ 4.57 $ 4.68 $ 4.79 $ 4.91
Common stock dividend per share (ii) $ 4.04 $ 4.32 $ 4.61 $ 4.93 $ 5.26 $ 5.63 $ 6.01 $ 6.42 $ 6.86 $ 7.33 $ 7.83
Risk-free rate (U.S Treasury Yield Curve Rates) 2.32% 2.59% 2.56% 2.53% 2.53% 2.54% 2.54% 2.60% 2.60% 2.60% 2.70%
Risk premium (i) 2.9% 2.9% 2.9% 2.9% 2.9% 2.9% 2.9% 2.9% 2.9% 2.9% 2.9%
Risk premium (ii) 2.8% 2.8% 2.8% 2.8% 2.8% 2.8% 2.8% 2.8% 2.8% 2.8% 2.8%
Discount rate (i) 5.21% 5.48% 5.44% 5.42% 5.42% 5.43% 5.43% 5.48% 5.48% 5.48% 5.59%
Discount rate (ii) 5.15% 5.43% 5.39% 5.37% 5.37% 5.38% 5.38% 5.43% 5.43% 5.43% 5.53%
Discounted Present Value (i) - $ 3.76 $ 3.65 $ 3.55 $ 3.45 $ 3.35 $ 3.25 $ 3.15 $ 3.05 $ 2.96 $ 69.44
Discounted Present Value (ii) - $ 4.09 $ 4.38 $ 4.68 $ 5.00 $ 5.34 $ 5.70 $ 6.09 $ 6.51 $ 6.95 $ 69.97
Years - 1 2 3 4 5 6 7 8 9 10
(i) Cost of equity ((Dividends per share for next year/Current price per share) + Growth rate of dividends) 0.80%
(ii) Cost of equity ((Dividends per share for next year/Current price per share) + Growth rate of dividends) 0.99%
Total Debt (Long-term debt; as of September 30, 2018) $ 31,895
Total Equity (as of September 30, 2018) -$ 6,793
Cost of Debt (Weighted-average annual interest rate of total debt ; as of December 31, 2017) 3.3%
Tax Rate (between 25 - 27% expected in 2018; as of December 31, 2017) 26%
D+E D/D+E E/D+E WACC
WACC (i) $ 25,102 1.271 -0.271 2.9%
WACC (ii) $ 25,102 1.271 -0.271 2.8%
Valuation
Fair Value (i) $ 99.61 Current Price (January 08, 2019) $ 181.75
Fair Value (ii) $ 118.71 Premium to current price (i) -45%
Premium to current price (ii) -35%
Model Assumptions:
Net income: We assume net income grows at a 2% annual rate in perpetuity. The average net income growth rate from 2009 to 2017 was 2%. Net income has fallen at an average of 1% from 2013 - 2017.
In (i):
- We assume that the payout ratio of 54% (average payout ratio from 2007 - Q3'2018) remains constant in perpetuity
In (ii)
- We assume that the payout ratio increases at a 4% annual rate in perpetuity (payout ratio average growth from 2007 - 2017 was 4%)
Shares Outstanding: We assume that shares outstanding remain at 773 million in perpetuity
Weighted Average Cost of Capital: We use WACC of 2.9% in (i) and 2.8% in (ii). The cost of debt, according to December 31, 2017 filings is 3.3%, and the cost of equity calculated for (i) is 0.78%, and for (ii) 0.98%.
Risk-free rate: U.S. Treasury yield curve as of January 09, 2018
Figure 11: The dividend discount model used (above).
Prepared by Strategic Analysis Corporation – Use at Your Own DiscretionYou can also read