Monthly Highlights - EUMOFA
←
→
Page content transcription
If your browser does not render page correctly, please read the page content below
Monthly Highlights
No. 5 / 2021
In this issue
In February 2021, according to data collected by Contents
EUMOFA from 13 EU Member States, Atlantic
herring and Atlantic horse mackerel together First sales in Europe
accounted for 39% of "small pelagics" total first- Atlantic herring (Estonia, Latvia, Poland)
sales value. and Atlantic horse mackerel
(Netherlands, Spain, Portugal)
In 2018 – 2021, the price of frozen fillets of
mackerel from Iceland fluctuated from 1,86 to Extra-EU imports
12,07 EUR/kg. Weekly average EU import prices of
selected products from
From March 2018 to February 2021, French selected countries of origin
consumers spent 51% more for a kilogram of fresh
monk (17,76 EUR/kg on average) than Spanish Consumption
consumers (11,74 EUR/kg). Monk in France and Spain
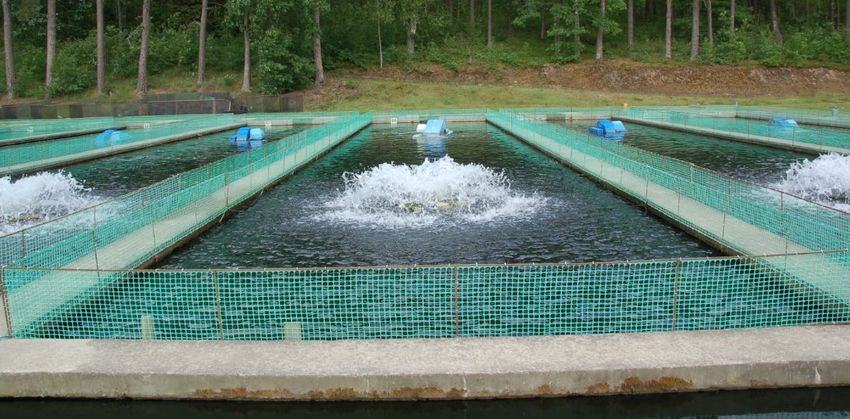
25% of all offshore catches in Greenland are landed Case studies
in towns and settlements by law to support the local Fisheries and catch in Greenland
labour markets. The remaining 75% of offshore Canned sardine and sardine-like
catches are processed on board. products in the EU
Canned sardine products are among the most
Global highlights
consumed preserved fish products in EU and include
more than just sardine (Sardina pilchardus). In 2019,
EU produced 73.669 tonnes of canned sardine, sprat
Macroeconomic context
and sardinella (all species combined).
On 22 April 2021, the EU and Greenland have signed
a new sustainable fisheries partnership agreement
(SFPA) and protocol.
Find all data, information, and more at:
www.eumofa.eu
@EU_MARE #EUMOFA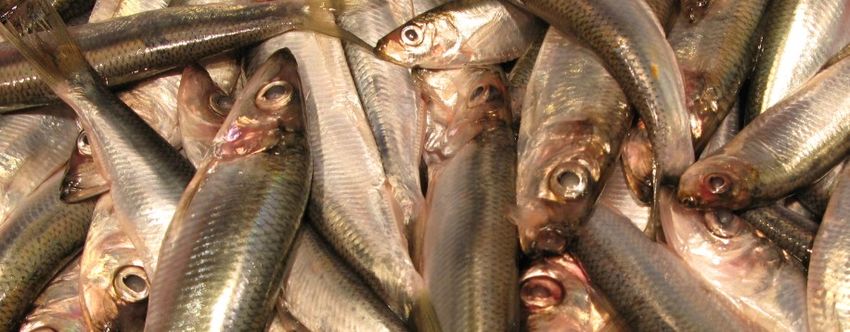
European Market Observatory for                                                                              MONTHLY HIGHLIGHTS | NO.5/2021
     Fisheries and Aquaculture Products                                                                                      FIRST SALES IN EUROPE

 1. First sales in Europe
 During January–February 2021, 13 EU Member States (MS), the United Kingdom, and Norway reported
 first-sales data for 10 commodity groups 1. First-sales data are based on sales notes and data collected from auction
 markets. First-sales data analysed in the section “First sales in Europe” are extracted from EUMOFA 2.

 1.1. January-February 2021 compared to the same period in 2020

 Increases in value and volume: Denmark, Estonia, Latvia, Lithuania, and Sweden were the countries that recorded an
 increase in both first-sales value and volume. Small pelagics species, namely herring and sprat, were principally
 responsible for increases in the Baltic Sea.

 Decreases in value and volume: Belgium, Bulgaria, Italy, the Netherlands, Poland, Portugal, Spain, and the United
 Kingdom recorded decreases in first-sales value and volume. Bulgaria stood out with the most significant drop, which
 was due to a lower supply of clam.

 Table 1.      JANUARY-FEBRUARY OVERVIEW OF FIRST SALES FROM THE REPORTING COUNTRIES
               (volume in tonnes and value in million EUR) *

                                                                                                                                Change from
                       January - February                 January - February               January - February
                                                                                                                             January - February
                             2019                               2020                             2021
                                                                                                                                   2020
Country                Volume              Value          Volume            Value          Volume             Value           Volume           Value
Belgium                        2.589            9,59           2.246           10,66            2.121              7,59            -6%            -29%
Bulgaria                        121             0,14               93            0,21               53             0,11           -43%            -49%
Denmark                    153.112             77,21          57.157           50,91         101.136              52,24            77%               3%
Estonia                       11.103            2,00           8.415                3          17.097              3,86          103%              54%
France                        32.294         106,15           27.561               97          27.426             90,76             0%              -6%
Italy                         11.667            48,3          12.982             50,2          10.170             41,17           -22%            -18%
Latvia                         9.943              1,7          7.708              1,4           9.384              2,02            22%             43%
Lithuania                       233               0,3             325             0,2             719              0,41          121%              97%
Netherlands                   31.020            53,9          33.863             52,3          26.858             36,38           -21%            -30%
Poland                        21.900              5,6         19.884              4,8          14.416              3,40           -28%            -29%
Portugal                      14.437            37,5           9.625             34,0           7.800             28,59           -19%            -16%
Spain                         66.529           212,4          61.731           202,7           48.332           163,32            -22%            -19%
Sweden                        54.262            18,8          22.000             10,8          44.485             14,56          102%              35%
Norway                     525.532             481,0        566.543            592,7         572.767            515,39              1%            -13%
United                        61.078           120,2          62.769           112,3           61.785             87,41            -2%            -22%
Kingdom
   Possible discrepancies in % changes are due to rounding.
 * Volumes are reported in net weight for EU Member States, and in live weight equivalent (LWE) for Norway. Prices are reported in EUR/kg (without VAT). For
 Norway, prices are reported in EUR/kg of live weight.

 1
   Bivalves and other molluscs and aquatic invertebrates, cephalopods, crustaceans, flatfish, freshwater fish, groundfish, salmonids, small pelagics, tuna and
 tuna-like species, and other marine fish.
 2
   First sales data updated on 16.4.2021.

                                  Overview | 1. First sales in Europe | 2. Extra-EU imports | 3. Consumption
                                                                                                                                                                 2
                       | 4.   Fisheries and catch in Greenland | 5. Canned sardine in the EU | 6. Global highlights                        |
                                                           7. Macroeconomic context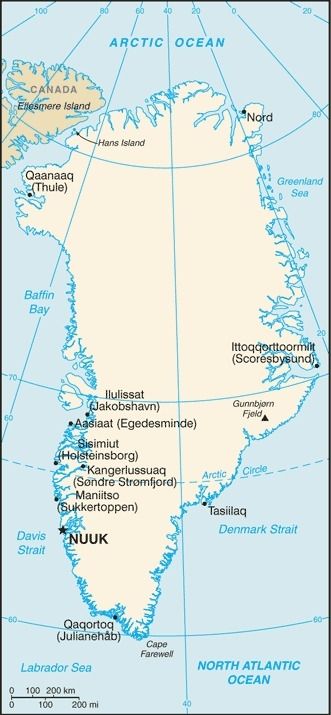
European Market Observatory for                                                                             MONTHLY HIGHLIGHTS | NO.5/2021
   Fisheries and Aquaculture Products                                                                                     FIRST SALES IN EUROPE

 1.2. February 2021 compared to February 2020

 Increases in value and volume: First sales increased in Denmark, Estonia, France, Latvia, Lithuania, and Sweden.
 Herring and sprat were behind the sharp increases in Estonia, Lithuania, and Sweden, while herring and blue whiting
 were the main causes of higher first sales (mainly in terms of value) in Denmark.

 Decreases in value and volume: First sales decreased in Bulgaria, Italy, the Netherlands, Poland, Portugal, Spain,
 Norway, and the United Kingdom. Bulgaria saw decreases due to clam, Poland due to sprat and herring, while mackerel
 was among the key species behind the decline in the United Kingdom.

 Table 2.      FEBRUARY OVERVIEW OF FIRST SALES FROM THE REPORTING COUNTRIES
               (volume in tonnes and value in million EUR) *

                             February 2019                 February 2020                   February 2021                     Change from
                                                                                                                            February 2020
Country                 Volume            Value          Volume           Value          Volume          Value          Volume              Value
Belgium                       1.123             4,5             924             4,9          1.139              4,2          23%              -16%
Bulgaria                         95           0,08                50            0,1              27           0,06          -46%              -46%
Denmark                      81.399           35,1           30.144            19,6         50.398            22,5           67%               15%
Estonia                       4.894             0,9           2.739             0,6          7.693              1,7         181%             162%
France                       16.646           53,1           13.021            45,5         13.782            46,5             6%               2%
Italy                         5.933           24,6            6.353            24,4          5.657            22,5          -11%               -8%
Latvia                        5.183             0,9           3.888             0,7          5.555              1,2          43%               71%
Lithuania                       108             0,1             191             0,1            370              0,2          94%             141%
Netherlands                  19.668           30,6           21.396            30,0         20.060            22,2            -6%             -26%
Poland                       12.358             3,2          12.610             3,0          6.457              1,5         -49%              -50%
Portugal                      7.169           18,0            5.128            17,9          3.662            13,6          -29%              -24%
Spain                        35.323          100,2           33.738          100,6          24.850            83,2          -26%              -17%
Sweden                       29.828             9,7          10.545             5,1         22.661              7,3         115%               43%
Norway                    268.159            244,0         337.299           341,8        305.704            297,3            -9%             -13%
United Kingdom               20.740           44,2           29.613            50,1         15.154            26,1          -49%              -48%
 Possible discrepancies in % changes are due to rounding.
 * Volumes are reported in net weight for EU Member States and the UK, and in live weight equivalent (LWE) for Norway. Prices are reported in EUR/kg (without
 VAT). For Norway, prices are reported in EUR/kg of live weight.

The most recent weekly first-sales data (up to week 21 of 2021) are available via the EUMOFA website, and can
be accessed here.

The most recent monthly first-sales data for March 2021 are available via the EUMOFA website, and can be
accessed here.

                                 Overview | 1. First sales in Europe | 2. Extra-EU imports | 3. Consumption
                                                                                                                                                                3
                      | 4.   Fisheries and catch in Greenland | 5. Canned sardine in the EU | 6. Global highlights                      |
                                                          7. Macroeconomic context
European Market Observatory for                                                                          MONTHLY HIGHLIGHTS | NO.5/2021
    Fisheries and Aquaculture Products                                                                                  FIRST SALES IN EUROPE

        1.3. First sales in selected countries
First sales data analysed in this section are extracted from EUMOFA 3.

Table 3.        FIRST SALES OF THE MAIN COMMERCIAL SPECIES 4 IN BELGIUM
                              First-sales             First-sales              Main contributing         Notes
                              value / trend %         volume / trend %         species
          Belgium

    Jan-Feb 2021 vs           EUR 7,6 million,        2.121 tonnes,            Common sole,              The increase in first sales of European
    Jan-Feb 2020              -29%                    -6%                      squid, cuttlefish,        plaice was due to changes in fishing zones
                                                                               ray, megrim.              and targeted fishery. The increase in first-
    Feb 2021 vs               EUR 4,2 million,        1.139 tonnes,            Value: Common             sales value (+106%) did not follow volume
    Feb 2020                  -16%                    +23%                     sole, cuttlefish,         (+184%) due to a 27% drop of the first-sales
                                                                               squid,                    price (1,63 EUR/kg in February 2021
                                                                               Volume: European          compared to 2,24 EUR /kg in February 2020).
                                                                               plaice, gurnard.          This can be explained by the following
                                                                                                         reasons: 1) due to post-Brexit negotiations
                                                                                                         including fishing licenses, medium size
                                                                                                         trawlers were not allowed in the British 6-12
                                                                                                         nm zone until the end of January, which
                                                                                                         delayed decisions to enter British waters in
                                                                                                         early February. 2) Some large beam trawlers
                                                                                                         opted to go to the North Sea instead of
                                                                                                         British waters where they caught more plaice
                                                                                                         and less sole. 3) Unfavourable weather
                                                                                                         conditions, especially in early and mid-
                                                                                                         February.

Figure 1.       FIRST SALES OF THE MAIN COMMERCIAL SPECIES IN BELGIUM, FEBRUARY 2021

      250                 -31%                                                                                                               2.000
               +13%                                                                                           +184%
      200                                                                                                                                    1.500
      150                                        -11%
                                                                                                                                             1.000
      100
                                                          -13%                                                            +106%              500
       50
                                                                                -39%       -43%

                 Common sole                      Cuttlefish                       Squid                      European plaice

                                                     Volume (tonnes)                 Value (EUR 1000)
Percentages show change from the previous year.

Table 4.        FIRST SALES OF THE MAIN COMMERCIAL SPECIES IN BULGARIA
                                  First-sales value /       First-sales                Main contributing species
                                  trend %                   volume / trend %
            Bulgaria

    Jan-Feb 2021 vs               EUR 0,1 million,          53 tonnes,                 Clam, sprat, other molluscs and aquatic invertebrates*.
    Jan-Feb 2020                  -49%                      -43%
    Feb 2021 vs                   EUR 0,06 million,         27 tonnes,                 Clam, sprat.
    Feb 2020                      -46%                      -46%                       Red mullet slightly offset the decline.

3
    First-sales data updated on 16.4.2021.
4
    Data on fisheries and aquaculture products harmonised in EUMOFA allow comparisons along the different supply chain stages in EUMOFA.

                                  Overview | 1. First sales in Europe | 2. Extra-EU imports | 3. Consumption
                                                                                                                                                         4
                       | 4.   Fisheries and catch in Greenland | 5. Canned sardine in the EU | 6. Global highlights                  |
                                                           7. Macroeconomic context
European Market Observatory for                                                                     MONTHLY HIGHLIGHTS | NO.5/2021
    Fisheries and Aquaculture Products                                                                             FIRST SALES IN EUROPE

Figure 2.       FIRST SALES OF THE MAIN COMMERCIAL SPECIES IN BULGARIA, FEBRUARY 2021

      30                       -45%                                                                                                         60
                -39%

      20                                                                                                                                    40

      10                                                                                                                                    20

                                                         -82%            -83%                     +145%         +683%

                      Clam                                       Sprat                                Red mullet
                                                  Volume (tonnes)                  Value (EUR 1000)
Percentages show change from the previous year. *EUMOFA aggregation for species.

Table 5.        FIRST SALES OF THE MAIN COMMERCIAL SPECIES IN DENMARK
                              First-sales           First-sales             Main contributing species        Notes
                              value / trend %       volume / trend %
           Denmark

    Jan-Feb 2021 vs           EUR 52,2 million,     101.136 tonnes,         Sprat, herring, mussel           First sales of blue whiting in February
    Jan-Feb 2020              +3%                   +77%                    Norway lobster, blue whiting,    2021 (8.200 tonnes) were significantly
                                                                            other marine fish*.              higher than the production recorded in
    Feb 2021                  EUR 22,5 million,     50.398 tonnes,          Sprat, blue whiting, Norway      February 2020 (around 2.300 tonnes)
    vs Feb 2020               +15%                  +67%                    lobster, other marine fish*.     but is closer to the production recorded
                                                                                                             in February 2017 (10.300 tonnes). While
                                                                                                             the changes in volume observed
                                                                                                             between the months of February look
                                                                                                             important in relative terms, it should be
                                                                                                             noted that they are low in absolute
                                                                                                             terms compared to other periods
                                                                                                             (99.000 tonnes in March-April 2020).
                                                                                                             First sales of sprat, which is assessed
                                                                                                             as being at full reproductive capacity 5,
                                                                                                             is back to levels observed in February
                                                                                                             2019, and in line with the production
                                                                                                             recorded in February 2017 and 2018.

Figure 3.       FIRST SALES OF THE MAIN COMMERCIAL SPECIES IN DENMARK, FEBRUARY 2021

      24.000      +116%                                                                                                                6.000
                             +134%
      20.000                                                                                                                           5.000
      16.000                                                                                                                           4.000
      12.000                                                                           +63%                                            3.000
                                              +261%                                                                +36%
        8.000                                            +174%                                                                         2.000
        4.000                                                                                          +183%                           1.000
                                                                           +94%

                      Sprat                       Blue whiting              Norway lobster            Other marine fish*
                                                   Volume (tonnes)                  Value (EUR 1000)
Percentages show change from the previous year. *EUMOFA aggregation for species (Metadata 2, Annex 3: http://eumofa.eu/supply-balance-and-other-
methodologies).

5
    ICES Advice 2020 – spr.27.22-32 – https://doi.org/10.17895/ices.advice.5879

                                 Overview | 1. First sales in Europe | 2. Extra-EU imports | 3. Consumption
                                                                                                                                                   5
                      | 4.   Fisheries and catch in Greenland | 5. Canned sardine in the EU | 6. Global highlights             |
                                                          7. Macroeconomic context
European Market Observatory for MONTHLY HIGHLIGHTS | NO.5/2021
Fisheries and Aquaculture Products FIRST SALES IN EUROPE
Table 6. FIRST SALES OF THE MAIN COMMERCIAL SPECIES IN ESTONIA
First-sales First-sales Main Notes
value / trend % volume / contributing
Estonia trend % species
Jan-Feb 2021 vs EUR 3,9 million, 17.097 tonnes, Herring, smelt. The sharp increase in first sales of pike-perch in
Jan-Feb 2020 +54% +103% February 2021 over February 2020 is due to a
Feb 2021 vs EUR 1,7 million, 7.693 tonnes, Herring, sprat, broader distribution of sales in January and February
Feb 2020 +162% +181% pike-perch, pike. 2021, compared to 2020 when most sales occurred
in January only. Favourable weather conditions on
Lake Peipsi have made it possible to fish for the
semi-annual pike perch quota of 2021 already in the
first half of February. Herring sales increased due to
better weather conditions in February 2021
compared with February 2020, and were also aided
by existing resources in fishing capacity, market
demand and total allowable catches.
Figure 4. FIRST SALES OF THE MAIN COMMERCIAL SPECIES IN ESTONIA, FEBRUARY 2021
5.000 +237% 800
+228%
4.000 +162%
+140% 600
3.000
400
2.000
+22726%
1.000 200
+32525% +118% +157%
Herring Sprat Pike-perch Pike
Volume (tonnes) Value (EUR 1000)
Percentages show change from the previous year.
Table 7. FIRST SALES OF THE MAIN COMMERCIAL SPECIES IN FRANCE
First-sales value First-sales volume Main contributing species
/ trend % / trend %
France
Jan-Feb 2021 vs EUR 90,8 million, 27.426 tonnes, Value: Common sole, hake, monk.
Jan-Feb 2020 -6% 0% Volume: Scallop, hake, monk, saithe, herring.
Feb 2021 vs EUR 46,5 million, 13.782 tonnes, Squid, scallop, Norway lobster, hake.
Feb 2020 +2% +6%
Figure 5. FIRST SALES OF THE MAIN COMMERCIAL SPECIES IN FRANCE, FEBRUARY 2021
+9%
3.000 +10% 8.000
6.000
2.000
+20% 0% 4.000
1.000 +52%
+50% 2.000
+34% +54%
Squid Scallop Norway lobster Hake
Volume (tonnes) Value (EUR 1000)
Percentages show change from the previous year.
Overview | 1. First sales in Europe | 2. Extra-EU imports | 3. Consumption
6
| 4. Fisheries and catch in Greenland | 5. Canned sardine in the EU | 6. Global highlights |
7. Macroeconomic contextEuropean Market Observatory for MONTHLY HIGHLIGHTS | NO.5/2021
Fisheries and Aquaculture Products FIRST SALES IN EUROPE
Table 8. FIRST SALES OF THE MAIN COMMERCIAL SPECIES IN ITALY
First-sales First-sales Main contributing species
value / trend % volume / trend %
Italy
Jan-Feb 2021 vs EUR 41,2 million, 10.170 tonnes, Clam, miscellaneous shrimps*, deep-water rose shrimp, hake.
Jan-Feb 2020 -18% -22%
Feb 2021 vs EUR 22,5 million, 5.657 tonnes, Clam, miscellaneous shrimps*, Norway lobster, deep-water rose
Feb 2020 -8% -11% shrimp.
Figure 6. FIRST SALES OF THE MAIN COMMERCIAL SPECIES IN ITALY, FEBRUARY 2021
800 -46% -43% 2.000
600 -39% -17% 1.500
400 -32% -25% 1.000
200 -32% 500
-36%
Clam Miscellaneous shrimps* Norway lobster Deep-water rose shrimp
Volume (tonnes) Value (EUR 1000)
Percentages show change from the previous year. *EUMOFA aggregation for species.
Table 9. FIRST SALES OF THE MAIN COMMERCIAL SPECIES IN LATVIA
First-sales First-sales Main contributing species
value / trend % volume / trend %
Latvia
Jan-Feb 2021 vs EUR 2,0 million, 9.384 tonnes, Herring, sprat, smelt, other marine fish*.
Jan-Feb 2020 +43% +22%
Feb 2021 vs EUR 1,2 million, 5.555 tonnes, Herring, sprat, smelt.
Feb 2020 +71% +43%
Figure 7. FIRST SALES OF THE MAIN COMMERCIAL SPECIES IN LATVIA, FEBRUARY 2021
3.200 +74% 800
+153%
2.400 +14% 600
+18%
1.600 400
800 200
+31% +49%
Herring Sprat Smelt
Volume (tonnes) Value (EUR 1000)
Percentages show change from the previous year. *EUMOFA aggregation for species.
Overview | 1. First sales in Europe | 2. Extra-EU imports | 3. Consumption
7
| 4. Fisheries and catch in Greenland | 5. Canned sardine in the EU | 6. Global highlights |
7. Macroeconomic contextEuropean Market Observatory for MONTHLY HIGHLIGHTS | NO.5/2021
Fisheries and Aquaculture Products FIRST SALES IN EUROPE
Table 10. FIRST SALES OF THE MAIN COMMERCIAL SPECIES IN LITHUANIA
First-sales First-sales Main contributing Notes
value / trend volume/ trend % species
Lithuania %
Jan-Feb 2021 vs EUR 0,4 million, 719 tonnes, Smelt, herring, sprat. Herring first sales increased due to
Jan-Feb 2020 +97% +121% higher fishing activities, market demand,
Feb 2021 vs EUR 0,2 million, 370 tonnes, Smelt, herring, sprat. and good weather conditions in February
Feb 2020 +141% +94% 2021. In addition to the increase of
catches, Latvian and Estonian fish
processing companies expanded and
acquired a subsidiary fish company in
Lithuania; landings recorded in Lithuania
increased and, therefore, sales increased
by 100%.
Figure 8. FIRST SALES OF THE MAIN COMMERCIAL SPECIES IN LITHUANIA, FEBRUARY 2021
400 +216% 150
+100%
300 120
+69% 90
200
60
100 30
+13% +128% +182%
Smelt Herring Sprat
Volume (tonnes) Value (EUR 1000)
Percentages show change from the previous year.
Table 11. FIRST SALES OF THE MAIN COMMERCIAL SPECIES IN THE NETHERLANDS
First-sales First-sales Main contributing species
value / trend % volume / trend %
the Netherlands
Jan-Feb 2021 vs EUR 36,4 million, 26.858 tonnes, Mackerel, herring, common sole, Atlantic horse mackerel.
Jan-Feb 2020 -30% -21%
Feb 2021 vs EUR 22,2 million, 20.060 tonnes, Mackerel, Atlantic horse mackerel, common sole, sprat.
Feb 2020 -26% -6%
Figure 9. FIRST SALES OF THE MAIN COMMERCIAL SPECIES IN THE NETHERLANDS, FEBRUARY 2021
-24% -28% -24%
5.000 5.000
4.000 -66% 4.000
3.000 -73% 3.000
2.000 2.000
1.000 +41% 1.000
-99.9% -99,9%
Mackerel Atlantic horse mackerel Common sole Sprat
Volume (tonnes) Value (EUR 1000)
Percentages show change from the previous year.
Overview | 1. First sales in Europe | 2. Extra-EU imports | 3. Consumption
8
| 4. Fisheries and catch in Greenland | 5. Canned sardine in the EU | 6. Global highlights |
7. Macroeconomic contextEuropean Market Observatory for MONTHLY HIGHLIGHTS | NO.5/2021
Fisheries and Aquaculture Products FIRST SALES IN EUROPE
Table 12. FIRST SALES OF THE MAIN COMMERCIAL SPECIES IN NORWAY
First-sales First-sales Main contributing species
value / trend % volume / trend %
Norway
Jan-Feb 2021 vs EUR 515,4 million, 572.767 tonnes, Value: cod, mackerel, haddock.
Jan-Feb 2020 -13% +1% Volume: miscellaneous small pelagics*, herring, seaweed
and other algae*.
Feb 2021 vs EUR 297,3 million 305.704 tonnes, Cod, mackerel, blue whiting, haddock.
Feb 2020 -13% -9%
Figure 10. FIRST SALES OF THE MAIN COMMERCIAL SPECIES IN NORWAY, FEBRUARY 2021
80.000 -42% 120.000
-18%
60.000 90.000
40.000 60.000
20.000 -67% -10% -24% 30.000
-95% -95% -76%
Cod Mackerel Blue whiting Haddock
Volume (tonnes) Value (EUR 1000)
Percentages show change from the previous year. *EUMOFA aggregation for species
Table 13. FIRST SALES OF THE MAIN COMMERCIAL SPECIES IN POLAND
First-sales First-sales Main contributing species
value / trend % volume / trend %
Poland
Jan-Feb 2021 vs EUR 3,4 million, 14.416 tonnes, Sprat, herring, European flounder, European plaice.
Jan-Feb 2020 -29% -28%
Feb 2021 vs EUR 1,5 million 6.457 tonnes, Sprat, herring, European flounder, cod.
Feb 2020 -50% -49%
Figure 11. FIRST SALES OF THE MAIN COMMERCIAL SPECIES IN POLAND, FEBRUARY 2021
5.000 -48% -45% 1.000
4.000 800
3.000 600
2.000 -18% -42% 400
-69% -68%
1.000 200
-79% -78%
Sprat Herring European flounder Cod
Volume (tonnes) Value (EUR 1000)
Percentages show change from the previous year.
Overview | 1. First sales in Europe | 2. Extra-EU imports | 3. Consumption
9
| 4. Fisheries and catch in Greenland | 5. Canned sardine in the EU | 6. Global highlights |
7. Macroeconomic contextEuropean Market Observatory for MONTHLY HIGHLIGHTS | NO.5/2021
Fisheries and Aquaculture Products FIRST SALES IN EUROPE
Table 14. FIRST SALES OF THE MAIN COMMERCIAL SPECIES IN PORTUGAL
First-sales First-sales Main contributing species Notes
value / trend volume / trend %
Portugal %
Jan-Feb 2021 vs EUR 28,6 7.800 tonnes, Squid, anchovy, seabream* Higher first sales value of Atlantic
Jan-Feb 2020 million, -19% (other than gilthead), horse mackerel relative to
-16% Atlantic horse mackerel. decreased volume was due to its
Feb 2021 vs EUR 13,6 3.662 tonnes, Anchovy, scabbardfish, average first-sales price increase
Feb 2020 million -29% squid, Atlantic horse (+77%). Since this species can be
-24% mackerel, mackerel. considered a low-price product, the
combination of high seafood
consumption, low prices, and
benefits to health generates a
higher demand of this product and,
therefore, is driving price increases.
The peak of catches for this species
is concentrated in springtime (and
to a lesser extend in autumn), so
catches in February will probably be
compensated for in the forthcoming
months.
Figure 12. FIRST SALES OF THE MAIN COMMERCIAL SPECIES IN PORTUGAL, FEBRUARY 2021
-34% +17%
800 1.500
600 1.200
900
400 -47%
600
-45%
200 -67%
300
-99,9% -99,9% -77%
Anchovy Scabbardfish Squid Atlantic horse mackerel
Volume (tonnes) Value (EUR 1000)
Percentages show change from the previous year. *EUMOFA aggregation for species.
Table 15. FIRST SALES OF THE MAIN COMMERCIAL SPECIES IN SPAIN
First-sales First-sales Main contributing Notes
value / trend in % volume / trend % species
Spain
Jan-Feb 2021 vs EUR 163,3 million, 48.332 tonnes, Hake, clam, other The first sales decrease of both
Jan-Feb 2020 -19% -22% sharks*, skipjack tuna, value and volume for skipjack tuna
Atlantic horse mackerel. could be explained by the
Feb 2021 vs EUR 83,2 million 24.850 tonnes, Skipjack tuna, other adaptation of fishing operations to
Feb 2020 -17% -26% sharks*, yellowfin tuna, adjusted management measures
Atlantic horse mackerel. and the fishing season. Regarding
the management adjustments, in
January 2021 the Spanish Fisheries
Department released a set of
management measures with
reduction for tuna species including
skipjack for the fleet operating in
the Indian Ocean Tuna Commission
area (IOTC 6). The adaption of
catches to the fishing season also
explains this abrupt decrease.
6
https://www.iotc.org/
Overview | 1. First sales in Europe | 2. Extra-EU imports | 3. Consumption
10
| 4. Fisheries and catch in Greenland | 5. Canned sardine in the EU | 6. Global highlights |
7. Macroeconomic contextEuropean Market Observatory for MONTHLY HIGHLIGHTS | NO.5/2021
Fisheries and Aquaculture Products FIRST SALES IN EUROPE
Figure 13. FIRST SALES OF THE MAIN COMMERCIAL SPECIES IN SPAIN, FEBRUARY 2021
2.000 -27% 4.000
-38%
1.500 -43% 3.000
-44% -43%
1.000 -78% -19% 2.000
-76%
500 1.000
Skipjack tuna Sharks, other* Yellowfin tuna Atlantic horse mackerel
Volume (tonnes) Value (EUR 1000)
Percentages show change from the previous year. *EUMOFA aggregation for species.
Table 16. FIRST SALES OF THE MAIN COMMERCIAL SPECIES IN SWEDEN
First-sales First-sales Main contributing Notes
value / trend in % volume / trend in % species
Sweden
Jan-Feb 2021 vs EUR 14,6 million, 44.485 tonnes, Sprat, herring, Norway Favourable weather conditions in
Jan-Feb 2020 +35% +102% lobster, February 2021 allowed for a rise in
Feb 2021 vs EUR 7,3 million, 22.661 tonnes, Sprat, herring, Norway fishing activities targeting sprat,
Feb 2020 +43% +115% lobster, other marine and therefore led to an increase in
fish*. its first sales compared to 2020. In
February 2021, the volume of sprat
landed was similar to February
2019. As such, the abnormal supply
was in February 2020, when sprat
catches decreased significantly due
to bad weather that prevented
usual fishing activities.
Figure 14. FIRST SALES OF THE MAIN COMMERCIAL SPECIES IN SWEDEN, FEBRUARY 2021
12.000 +87% +78% 3.000
+177%
+187%
9.000
2.000
6.000
+20%
1.000
3.000
+41% -54% +113%
Sprat Herring Norway lobster Other marine fish*
Volume (tonnes) Value (EUR 1000)
Percentages show change from the previous year. *EUMOFA aggregation for species.
Overview | 1. First sales in Europe | 2. Extra-EU imports | 3. Consumption
11
| 4. Fisheries and catch in Greenland | 5. Canned sardine in the EU | 6. Global highlights |
7. Macroeconomic contextEuropean Market Observatory for MONTHLY HIGHLIGHTS | NO.5/2021
Fisheries and Aquaculture Products FIRST SALES IN EUROPE
Table 17. FIRST SALES OF THE MAIN COMMERCIAL SPECIES IN THE UNITED KINGDOM
First-sales First-sales Main contributing species
value / trend % volume / trend %
The United Kingdom
Jan-Feb 2021 vs EUR 87,4 million, 61.785 tonnes, Mackerel, scallop, Norway lobster, haddock.
Jan-Feb 2020 -22% -2%
Feb 2021 vs EUR 26,1 million, 15.154 tonnes, Mackerel, Norway lobster, saithe, haddock.
Feb 2020 -48% -49%
Figure 15. FIRST SALES OF THE MAIN COMMERCIAL SPECIES IN THE UNITED KINGDOM, FEBRUARY 2021
8.000 -71% 8.000
-69%
6.000 6.000
4.000 4.000
-35%
-29%
2.000 -26% -24% 2.000
-55% -70%
Mackerel Norway lobster Saithe Haddock
Volume (tonnes) Value (EUR 1000)
Percentages show change from the previous year.
1.4. Comparison of first-sales prices of selected species in selected countries 7
Figure 16. FIRST-SALES PRICES OF MUSSEL MYTILUS SPP. IN DENMARK, ITALY, AND SPAIN
3,00
2,50
2,00
1,50
EUR/kg
1,00
0,50
0,00
2018-M03
2018-M04
2018-M05
2018-M06
2018-M07
2018-M08
2018-M09
2018-M10
2018-M11
2018-M12
2019-M01
2019-M02
2019-M03
2019-M04
2019-M05
2019-M06
2019-M07
2019-M08
2019-M09
2019-M10
2019-M11
2019-M12
2020-M01
2020-M02
2020-M03
2020-M04
2020-M05
2020-M06
2020-M07
2020-M08
2020-M09
2020-M10
2020-M11
2020-M12
2021-M01
2021-M02
Denmark Italy Spain
EU first sales of mussel Mytilus spp. occur predominantly in Denmark, as well as in Italy and Spain. Average prices in
February 2021 (the most recent available data) were 0,23 EUR/kg in Denmark (up from both the previous month and year by
22% and 49%, respectively), and 0,95 EUR/kg in Italy (–28% from January 2021 and +6% from February 2020). The high
difference in mussel Mytilus spp. prices between analysed countries is because blue mussel (Mytilus edulis) is sold in Denmark,
while Italy and Spain see sales of the more valued Mediterranean mussels (Mytilus galloprovincialis). In Spain, the average
price was 0,90 EUR/kg (down from both the previous month and year by 15% and 29%, respectively). In February 2021, supply
increased remarkably in Italy (+189%), and decreased in Denmark (–57%), and Spain (–86%) compared to February 2020.
Supply is seasonal with peaks between March–May in Denmark, March–April in Spain, and June–July in Italy. First sales of
blue mussel in Denmark amount to almost 93.000 tonnes, while first sales of Mediterranean mussel amounted to 2.500
7
First sales data updated on 16.4.2021.
Overview | 1. First sales in Europe | 2. Extra-EU imports | 3. Consumption
12
| 4. Fisheries and catch in Greenland | 5. Canned sardine in the EU | 6. Global highlights |
7. Macroeconomic contextEuropean Market Observatory for MONTHLY HIGHLIGHTS | NO.5/2021
Fisheries and Aquaculture Products FIRST SALES IN EUROPE
tonnes in Italy and 382 tonnes in Spain. Over the 36-month period, mussel Mytilus spp. prices exhibited different trends in all
three countries: a stable trend in Denmark and in Italy (despite monthly fluctuations), and a slightly decreasing trend in Spain
(with fluctuations). During the same period, supply showed a decreasing trend in all the three countries, especially in Denmark.
Figure 17. FIRST-SALES PRICES OF SAITHE IN DENMARK, FRANCE, AND SWEDEN
4,00
3,50
3,00
2,50
2,00
EUR/kg
1,50
1,00
0,50
0,00
2018-M04
2018-M05
2018-M06
2018-M07
2018-M08
2018-M09
2018-M10
2018-M11
2018-M12
2019-M01
2019-M02
2019-M03
2019-M04
2019-M05
2019-M06
2019-M07
2019-M08
2019-M09
2019-M10
2019-M11
2019-M12
2020-M01
2020-M02
2020-M03
2020-M04
2020-M05
2020-M06
2020-M07
2020-M08
2020-M09
2020-M10
2020-M11
2020-M12
2021-M01
2021-M02
Denmark France Sweden
EU first sales of saithe occur in multiple countries, including Denmark, France, and Sweden. In February 2021, the average
first-sales prices of saithe were: 1,73 EUR/kg in Denmark (down from both the previous month and year by 16% and 27%,
respectively); 2,38 EUR/kg in France (20% lower than January 2021, and 5% higher than February 2020); and 2,23 EUR/kg in
Sweden (11% down from the previous month and 3% up from the previous year). In France and Sweden, the price spikes in
both January 2020 and 2021 correlated with drops in supply. In Denmark, the price spikes occur mainly in January, and are
not due to drops in supply, but rather an increase in demand. In February 2021, supply decreased in all three countries: –2%
in Denmark, –94% in Italy, and –89% in Sweden, relative to the previous year. Volumes sold in the three markets are seasonal.
In Denmark and France, they peak in March–April, and in Sweden in October–November. Over the past 36 months, saithe
prices showed an upward trend. At the same time, supply had an opposite trend in all the three countries.
Figure 18. FIRST-SALES PRICES OF SARDINE IN FRANCE, PORTUGAL, AND SPAIN
4,50
4,00
3,50
3,00
2,50
EUR/kg
2,00
1,50
1,00
0,50
0,00
2018-M04
2018-M05
2018-M06
2018-M07
2018-M08
2018-M09
2018-M10
2018-M11
2018-M12
2019-M01
2019-M02
2019-M03
2019-M04
2019-M05
2019-M06
2019-M07
2019-M08
2019-M09
2019-M10
2019-M11
2019-M12
2020-M01
2020-M02
2020-M03
2020-M04
2020-M05
2020-M06
2020-M07
2020-M08
2020-M09
2020-M10
2020-M11
2020-M12
2021-M01
2021-M02
France Portugal Spain
EU first sales of sardine occur predominantly in Spain, as well as in France and Portugal. In February 2021, the average
first-sales prices of sardine were: 0,87 EUR/kg in France (up from both the previous month and year by 36% and 65%,
respectively); 3,95 EUR/kg in Portugal (+14% from January 2021, and +90% from February 2020); and 1,24 EUR/kg in
Spain (15% higher than January 2021, and 18% up from February 2020). In February 2021, supply decreased in all three
countries: –22% in France, –78% in Portugal, and –14% in Spain, compared to February 2020. Supply is seasonal with
peaks between July–August in France, June–September in Portugal, and October–November in Spain. Prices exhibited a
downward trend in France and Spain, while a strong downward trend from March 2018 to October 2020 which recovered
slightly between November 2020 and February 2021 was observed in Portugal. Over the past three years, supply was
stable in Spain and had a slight upward trend in France and Portugal.
Overview | 1. First sales in Europe | 2. Extra-EU imports | 3. Consumption
13
| 4. Fisheries and catch in Greenland | 5. Canned sardine in the EU | 6. Global highlights |
7. Macroeconomic contextEuropean Market Observatory for MONTHLY HIGHLIGHTS | NO.5/2021
Fisheries and Aquaculture Products FIRST SALES IN EUROPE
1.5. Commodity group of the month: small pelagics 8
Figure 19. FIRST-SALES COMPARISON AT CG, MCS, AND ERS LEVELS FOR REPORTING COUNTRIES 9, MARCH
2018 - FEBRUARY 2021
120,0
100,0
Value (million EUR)
80,0
60,0
40,0
20,0
0,0
2018 2019 2020 2021
Small pelagics (CG) Herring (MCS) Horse mackerel, Atlantic (MCS)
Atlantic horse mackerel (ERS) Atlantic herring (ERS)
The “small pelagics” commodity group (CG 10) recorded the highest first-sales value and volume out of the 10 CGs recorded
in February 2021 11. Of reporting countries covered by EUMOFA database, first sales of “small pelagics” reached a value of
EUR 43,8 million and a volume of 95.474 tonnes, representing a value decrease of 7% and a volume increase of 20%
compared to February 2020.
In the past 36 months, the highest first-sales value of small pelagics was registered at EUR 105,6 million (August 2019).
The “small pelagics” commodity group includes seven main commercial species (MCS): anchovy, herring, horse mackerel,
mackerel, sardine, sprat, and miscellaneous small pelagics 12.
At Electronic Recording and Reporting System (ERS) level, Atlantic herring (21%) and Atlantic horse mackerel (18%) together
accounted for 39% of "small pelagics" total first-sales value recorded in February 2021.
8
First sales data updated on 16.4.2021.
9
Norway and the UK excluded from the analyses.
10
Annex 3: http://eumofa.eu/supply-balance-and-other-methodologies
11
More data on commodity groups can be found in Table 1.2 of the Annex.
12
Greater argentine accounts for the highest first-sales value and volume within the miscellaneous small pelagics category.
Overview | 1. First sales in Europe | 2. Extra-EU imports | 3. Consumption
14
| 4. Fisheries and catch in Greenland | 5. Canned sardine in the EU | 6. Global highlights |
7. Macroeconomic contextEuropean Market Observatory for MONTHLY HIGHLIGHTS | NO.5/2021
Fisheries and Aquaculture Products FIRST SALES IN EUROPE
1.6. Focus on Atlantic herring
Atlantic herring (Clupea harengus) is economically the most important herring species in the
family Clupeidae. It is widely distributed in the Northwest and Northeast Atlantic, congregates in
large schools, and migrates between spawning and wintering grounds in coastal areas and
feeding grounds in open waters. Atlantic herring can live for up to 10 years and reach 40 cm in length (average size is 20-30
cm) and almost 700 g in weight. They are demersal spawners, depositing their sticky eggs on coarse sand, gravel, shells and
small stones at depths of 15--40 m. Herring represent an important prey species for many predators, including cod, dogfish
and other sharks, marine mammals, and seabirds 13.
Atlantic herring is mainly caught by pelagic trawlers (mid-water, pair and otter trawl) and purse seiners. The main stocks
fished in EU waters are found in the Baltic, the North Sea, and West of Scotland. Herring catches are seasonal and subject to
total allowable catches (TACs) set based on precautionary considerations. In the Baltic Sea, according to Council Regulation
(EU) 2019/1838 of 30 October 2019, in subdivisions 25 and 26, it was prohibited to fish cod quota from 1 May to 31 August
2020 for all vessels, with derogation for small-scale vessels (less than 12 metres in length) that use passive and other allowed
gear in waters less than 20 metres deep. This restriction also affected the herring fishery as it was not possible to avoid cod
by-catch in such fisheries 14.
Gear restrictions and a minimum conservation reference size (20 cm) limit are also in place in the EU waters 15. In Norway
there is a minimum size of 25cm 16 for spring-spawning herring. The North Sea Atlantic herring fisheries are managed jointly
through a trilateral agreement by the EU, Norway, and the United Kingdom, through long-term management plans which are
based on a catch quota system which is set annually 17.
Denmark, Norway, Iceland, and the United Kingdom are among the main fishing nations of Atlantic herring. On the market,
herring is sold mainly whole, fresh, marinated and smoked.
We have covered Atlantic herring in the following Monthly Highlights:
First sales: MH 3/2019 (Denmark, the Netherlands, Sweden)
Topic of the month: “Atlantic herring in the EU” MH4/2018.
Selected countries
Table 18. COMPARISON OF ATLANTIC HERRING FIRST-SALES PRICES, MAIN PLACES OF SALE, AND
CONTRIBUTION TO OVERALL SALES OF "SMALL PELAGICS" IN SELECTED COUNTRIES
Changes in Atlantic herring Contribution of Atlantic
Atlantic herring first sales Jan-Feb 2021 (%) herring to total “small Principal places of sale
Compared to Compared to pelagics” first sales in Jan-Feb 2021 in terms of
Jan-Feb Jan-Feb February 2021 (%) first-sales value
2020 2019
Estonia Value +147% +68% 56% Haapsalu, Lemmetsa, Paldiski
Lõunasadam.
Volume +134% +56% 57%
Latvia Value +102% +75% 59% Roja, Ventspils, Skulte.
Volume +43% +34% 58%
Poland Value -33% -30% 19% Kolobrzeg, Hel, Wladyslawowo.
Volume -43% -49% 16%
13
https://www.ices.dk/about-ICES/projects/EU-RFP/EU%20Repository/ICES%20FIshMap/ICES%20FishMap%20species%20factsheet-herring.pdf
14
Council Regulation (EU) 2019/1838 https://eur-lex.europa.eu/legal-content/EN/TXT/?uri=CELEX:32019R1248%20
15
Regulation (EU) 2019/1241 https://eur-lex.europa.eu/legal-content/EN/TXT/?uri=CELEX%3A02019R1241-20210101
16
https://www.fiskeridir.no/English/Fishing-in-Norway/Minimum-sizes
17
https://ec.europa.eu/commission/presscorner/detail/en/IP_21_1206
Overview | 1. First sales in Europe | 2. Extra-EU imports | 3. Consumption
15
| 4. Fisheries and catch in Greenland | 5. Canned sardine in the EU | 6. Global highlights |
7. Macroeconomic contextEuropean Market Observatory for MONTHLY HIGHLIGHTS | NO.5/2021
Fisheries and Aquaculture Products FIRST SALES IN EUROPE
Figure 20. ATLANTIC HERRING: FIRST SALES IN ESTONIA, MARCH 2018 - FEBRUARY 2021
10.000 2,00
8.000
1,50
Volume
6.000
1,00
Value
4.000
0,50
2.000
0 0,00
Feb
Feb
Feb
Mar
May
Mar
May
Mar
May
Aug
Aug
Apr
Sep
Dec
Apr
Sep
Dec
Aug
Apr
Sep
Dec
Jun
Oct
Jul
Jun
Oct
Jun
Oct
Jan
Jul
Jan
Jul
Jan
Nov
Nov
Nov
2018 2019 2020 2021
Volume (tonnes) Value (milllion EUR)
Over the past 36 months, the highest first-sales value of Atlantic herring in Estonia occurred in May 2020. There were
low sales in July-August due to restrictions set by the EU. Typically, first sales were higher in spring, when fishing
activities are more intensive. The Estonian fleet fishes for herring in the Gulf of Riga using both trawls and trap nets 18.
Figure 21. FIRST SALES: COMPOSITION OF “SMALL PELAGICS” (ERS LEVEL) IN ESTONIA IN VALUE AND
VOLUME, FEBRUARY 2021
European Atlantic European Atlantic
herring sprat herring
sprat
56% 43% 57%
44% Total value Total volume
EUR 1,4 mil 7.589 tonnes
Figure 22. ATLANTIC HERRING: FIRST SALES IN LATVIA, MARCH 2018 - FEBRUARY 2021
3.500 1,00
3.000
0,80
2.500
Volume
2.000 0,60
Value
1.500 0,40
1.000
0,20
500
0 0,00
Feb
Feb
Feb
Mar
May
Mar
May
Mar
May
Aug
Aug
Apr
Sep
Dec
Apr
Sep
Dec
Aug
Apr
Sep
Dec
Jun
Oct
Jul
Jun
Oct
Jan
Jul
Jun
Oct
Jan
Jul
Jan
Nov
Nov
Nov
2018 2019 2020 2021
Volume (tonnes) Value (million EUR)
18
http://firms.fao.org/firms/resource/10469/164147/en
Overview | 1. First sales in Europe | 2. Extra-EU imports | 3. Consumption
16
| 4. Fisheries and catch in Greenland | 5. Canned sardine in the EU | 6. Global highlights |
7. Macroeconomic contextEuropean Market Observatory for MONTHLY HIGHLIGHTS | NO.5/2021
Fisheries and Aquaculture Products FIRST SALES IN EUROPE
Over the past 36 months in Latvia, the highest first-sales volume of Atlantic herring was in October 2020 when 3.138
tonnes were sold. About 85% of the total Latvian herring catches are taken by pelagic trawls and 15% trap-nets. Latvian
fleets fish in the Gulf of Riga and in Subdivisions 26 and 28.2 of the Baltic Proper 19.
Figure 23. FIRST SALES: COMPOSITION OF “SMALL PELAGICS” (ERS LEVEL) IN LATVIA IN VALUE AND VOLUME,
FEBRUARY 2021
European European Atlantic
Atlantic sprat
sprat herring herring
41% 42% 58%
Total value 59% Total volume
EUR 1,2 mil 5.220 tonnes
Figure 24. ATLANTIC HERRING: FIRST SALES IN POLAND, MARCH 2018 - FEBRUARY 2021
8.000 2,00
6.000 1,50
Volume
4.000 1,00
Value
2.000 0,50
0 0,00
Feb
Feb
Feb
Mar
May
Mar
May
Mar
May
Aug
Aug
Aug
Apr
Sep
Dec
Apr
Sep
Dec
Apr
Sep
Dec
Jun
Oct
Jul
Jun
Oct
Jan
Jul
Jun
Oct
Jan
Jul
Jan
Nov
Nov
Nov
2018 2019 2020 2021
Volume (tonnes) Value (million EUR)
Over the past 36 months in Poland, first sales fluctuated throughout each year depending on various factors including
fisheries’ seasonality, authorities’ measures, and weather conditions. The highest first-sales volume of common Atlantic
herring occurred in December 2020 when 7.028 tonnes were sold. However, the lowest first-sales volume was recorded
in August 2020 and no sales occurred in July 2020 due to EU restrictions 20.
19
https://www.fishsource.org/fishery_page/4771
20
Council Regulation (EU) 2019/1838 https://eur-lex.europa.eu/legal-content/EN/TXT/?uri=CELEX:32019R1248%20
Overview | 1. First sales in Europe | 2. Extra-EU imports | 3. Consumption
17
| 4. Fisheries and catch in Greenland | 5. Canned sardine in the EU | 6. Global highlights |
7. Macroeconomic contextEuropean Market Observatory for MONTHLY HIGHLIGHTS | NO.5/2021
Fisheries and Aquaculture Products FIRST SALES IN EUROPE
Figure 25. FIRST SALES: COMPOSITION OF “SMALL PELAGICS” (ERS LEVEL) IN POLAND IN VALUE AND
VOLUME, FEBRUARY 2021
Atlantic Atlantic
herring herring
19% 16%
European
sprat
European
81%
Total value sprat
Total volume
EUR 1,1 mil 84%
5.247 tonnes
Price trend
Figure 26. ATLANTIC HERRING: FIRST-SALES PRICES IN SELECTED COUNTRIES, MARCH 2018 - FEBRUARY
2021
0,40
0,30
EUR/kg
0,20
0,10
0,00
Feb
Feb
Feb
Mar
May
Aug
Mar
May
Aug
Mar
May
Apr
Sep
Dec
Apr
Sep
Dec
Aug
Apr
Sep
Dec
Jun
Oct
Oct
Jul
Jun
Jun
Oct
Jan
Jul
Jan
Jul
Jan
Nov
Nov
Nov
2018 2019 2020 2021
Estonia Latvia Poland
Over the 36-month observation period (March 2018 to February 2021), the weighted average first-sales price of Atlantic
herring in Poland was 0,28 EUR/kg, 54% higher than in Latvia (0,18 EUR/kg), and 53% greater than that of
Estonia (0,18 EUR/kg).
In Estonia in February 2021, the average first-sales price of Atlantic herring (0,18 EUR/kg) slightly increased by 3%
compared with February 2020, and 5% compared with February 2019. Over the past 36 months, average price ranged
from 0,15 EUR/kg for 2.101 tonnes in December 2018, to 0,28 EUR/kg for 0,8 tonnes in July 2018. The latter high price
was closely linked with low supply.
In Latvia in February 2021, the average first-sales price of Atlantic herring (0,23 EUR/kg) increased
by 46% compared to the same month in 2020 and 37% when compared to February 2019. During the observed period,
the lowest average price (0,14 EUR/kg for 915 tonnes) was seen in September 2019, while the highest average price was
recorded in February 2021 at 0,23 EUR/kg, for 3.011 tonnes.
In Poland in February 2021, the average first-sales price of Atlantic herring (0,27 EUR/kg) increased by 3% compared to
February 2020 and by 25% relative to February 2019. During the observed period, the lowest average price
of 0,21 EUR/kg for 2.950 tonnes was seen in December 2018, while the highest average price was recorded in September
2020, at 0,37 EUR/kg for 4.200 tonnes.
Overview | 1. First sales in Europe | 2. Extra-EU imports | 3. Consumption
18
| 4. Fisheries and catch in Greenland | 5. Canned sardine in the EU | 6. Global highlights |
7. Macroeconomic contextEuropean Market Observatory for MONTHLY HIGHLIGHTS | NO.5/2021
Fisheries and Aquaculture Products FIRST SALES IN EUROPE
1.7. Focus on Atlantic horse mackerel
The Atlantic horse mackerel (Trachurus trachurus), also known as the European horse mackerel
or common scad, is a species of jack mackerel in the family Carangidae. The common name,
horse mackerel, comes from the old Dutch word “Horsmakreel”. This means a mackerel that
spawns on a ‘hors’, which is a shallow area in the sea or a bank 21. The species prefers more
temperate waters and can be found off the Atlantic coasts from Senegal up to Norway, and in the Mediterranean, but rarely
in the Black Sea. The species spreads from the coast to more than 300 metres and prefers the deepest areas of the continental
shelf 22. This species attains a maximum fork length of 60 cm (most commonly around 30 cm) and a weight of 1,5 kilograms 23.
It feeds on small fish and crustaceans. There are two main populations, with the west stock spawning in the eastern Atlantic
and the north stock spawning in the North Sea. All have pelagic eggs and spawning generally occurs during the summer 24,
with peaks in May and June in the North Sea 25.
Atlantic horse mackerel is an important species in commercial fisheries where it is targeted by purse seiners, longlines, traps
and coastal trawlers 26. In purse seine fisheries it is caught together with other small pelagic species such as sardines and
anchovies at night, when the fish are attracted by lamplight. It is fished all year round, but especially during the summer
months 27. Belgium, France, Germany, Ireland, Netherlands, Norway, Portugal, Spain, and Scotland are the main European
fishing nations for Atlantic horse mackerel 28.
In the EU, management measures include fishing effort restrictions such as mesh size for towed gear (at least 55 mm for
South Western waters and 32 mm for the Baltic Sea) and a minimum conservation reference size of 15 cm. No minimum
conservation reference size applies to horse mackerel caught in waters adjacent to the Azores and under the sovereignty or
jurisdiction of Portugal 29.
Most catches are used for human consumption. The species is utilised fresh, frozen, dried and salted, smoked, and canned,
and can be fried, broiled and baked.
Selected countries
Table 19. COMPARISON OF ATLANTIC HORSE MACKEREL FIRST-SALES PRICES, MAIN PLACES OF SALE AND
CONTRIBUTION TO OVERALL SALES OF SMALL PELAGICS IN SELECTED COUNTRIES
Changes in Atlantic horse Contribution of Principal places of sales
Atlantic horse mackerel first sales Jan-Feb Atlantic horse in Jan-Feb 2021 in
2021 (%) mackerel to total terms of first-sales
mackerel “small pelagics” first value
Compared to Compared to sales in February
Jan-Feb 2020 Jan-Feb 2019 2021 (%)
Value -19% -50% 61% Scheveningen,
Netherlands IJmuiden/Velsen,
Volume -15% -47% 56% Vlissingen.
Value +5% +17% 76% Nazaré, Aveiro, Peniche.
Portugal
Volume -34% -36% 64%
Value -27% -17% 21% A Coruña, Vigo, Santa
Spain Eugenia Ribeira.
Volume -44% -30% 25%
21
https://www.nioz.nl/en/expertise/wadden-delta-research-centre/news-media/wadden-sea-species/fish-series/horse-mackerel
22
http://www.fao.org/3/Y2668B/y2668b06.htm
23
http://species-identification.org/species.php?species_group=fnam&id=1794
24
http://www.fao.org/fishery/species/2306/en
25
https://www.ices.dk/about-ICES/projects/EU-RFP/EU%20Repository/ICES%20FIshMap/ICES%20FishMap%20species%20factsheet-horsemackerel.pdf
26
http://www.fao.org/fishery/species/2306/en
27
http://www.abcomunicazioni.it/content/progetti/sicilianfishontheroad/en/il-pescato-siciliano/il-pesce-azzurro/suro.html
28
ICES WGWIDE 2019 Horse Mackerel in the Northeast Atlantic
29
Regulation (EU) 2019/1241 https://eur-lex.europa.eu/legal-content/EN/TXT/?uri=CELEX%3A02019R1241-20210101
Overview | 1. First sales in Europe | 2. Extra-EU imports | 3. Consumption
19
| 4. Fisheries and catch in Greenland | 5. Canned sardine in the EU | 6. Global highlights |
7. Macroeconomic contextEuropean Market Observatory for MONTHLY HIGHLIGHTS | NO.5/2021
Fisheries and Aquaculture Products FIRST SALES IN EUROPE
Figure 27. ATLANTIC HORSE MACKEREL: FIRST SALES IN THE NETHERLANDS, MARCH 2018 - FEBRUARY 2021
12.000 10,00
10.000 8,00
8.000
Volume
6,00
6.000
Value
4,00
4.000
2.000 2,00
0 Feb 0,00
Feb
Feb
Mar
May
Mar
May
Mar
May
Aug
Aug
Apr
Sep
Dec
Aug
Apr
Sep
Dec
Apr
Sep
Dec
Jun
Oct
Jul
Jun
Oct
Jun
Oct
Jan
Jul
Jan
Jul
Jan
Nov
Nov
Nov
2018 2019 2020 2021
Volume (tonnes) Value (million EUR)
In the Netherlands, over the observed 36-month period, the highest first sales of Atlantic horse mackerel occurred in
February 2021, 2020, and 2019. The lowest sales were observed in September 2018. In general, first sales fluctuate regularly,
and there were low sales recorded during the spring spawning season (mainly May-June) off the Netherlands coast 30.
Figure 28. FIRST SALES: COMPOSITION OF “SMALL PELAGICS” (ERS LEVEL) IN THE NETHERLANDS IN VALUE
AND VOLUME, FEBRUARY 2021
Atlantic Atlantic
Others herring Others herring
1% 4% 1% 4%
Atlantic
mackerel
Atlantic 39%
mackerel Total value Total volume
34% 8.841 tonnes
EUR 7,8 mil
Atlantic horse Atlantic horse
mackerel mackerel
61% 56%
Figure 29. ATLANTIC HORSE MACKEREL: FIRST SALES IN PORTUGAL, MARCH 2018 - FEBRUARY 2021
2.500 3,50
3,00
2.000
2,50
Volume
1.500 2,00
Value
1.000 1,50
1,00
500
0,50
0 0,00
Feb
Feb
Feb
Mar
May
Mar
May
Mar
May
Aug
Aug
Apr
Sep
Dec
Apr
Sep
Dec
Aug
Apr
Sep
Dec
Jun
Oct
Jul
Jun
Oct
Oct
Jan
Jul
Jun
Jan
Jul
Jan
Nov
Nov
Nov
2018 2019 2020 2021
Volume (tonnes) Value (million EUR)
30
https://www.ices.dk/about-ICES/projects/EU-RFP/EU%20Repository/ICES%20FIshMap/ICES%20FishMap%20species%20factsheet-horsemackerel.pdf
Overview | 1. First sales in Europe | 2. Extra-EU imports | 3. Consumption
20
| 4. Fisheries and catch in Greenland | 5. Canned sardine in the EU | 6. Global highlights |
7. Macroeconomic contextEuropean Market Observatory for MONTHLY HIGHLIGHTS | NO.5/2021
Fisheries and Aquaculture Products FIRST SALES IN EUROPE
In Portugal over the past 36 months, there were “high seasons” with months with unusually high first-sales volumes
when roughly 2.000 tonnes were sold, one in July and August 2019 and another in October 2018. In general, supply is
lower during colder periods (December-February) when weather conditions are not favourable for fishing activities. Atlantic
horse mackerel is the main target species in the Portuguese bottom trawl demersal fish fleet, which accounts for more
than 50% of the Portuguese annual catches 31.
Figure 30. FIRST SALES: COMPOSITION OF “SMALL PELAGICS” (ERS LEVEL) IN PORTUGAL IN VALUE AND
VOLUME, FEBRUARY 2021
Chub mackerel Others Others
5% 5% 3%
Chub
mackerel
12%
Blue jack
mackerel
14%
Blue jack
mackerel Total volume
Total value 21%
EUR 1,9 mil 1.148 tonnes
Atlantic horse Atlantic horse
mackerel mackerel
76% 64%
Figure 31. ATLANTIC HORSE MACKEREL: FIRST SALES IN SPAIN, MARCH 2018 - FEBRUARY 2021
9.000 6,00
8.000
5,00
7.000
6.000 4,00
Volume
5.000
3,00
Value
4.000
3.000 2,00
2.000
1,00
1.000
0 0,00
Feb
Feb
Feb
Mar
May
Mar
May
Mar
May
Aug
Aug
Aug
Apr
Sep
Dec
Apr
Sep
Dec
Apr
Sep
Dec
Jun
Oct
Oct
Jul
Jun
Oct
Jan
Jul
Jun
Jan
Jul
Jan
Nov
Nov
Nov
2018 2019 2020 2021
Volume (tonnes) Value (million EUR)
Among surveyed countries, Spain has the highest first-sales value and volume of Atlantic horse mackerel. Over the past
36 months, the highest first sales were registered in October 2019, when 8.664 tonnes were sold. The main fishing season
occurs in August-September. Most of the catches by Spanish fleets are from purse-seine vessels (70% of total) 32.
31
Stock Annex: Southern Horse Mackerel 2017 http://www.ices.dk/sites/pub/Publication%20Reports/Stock%20Annexes/2017/hom.27.9a_SA.pdf
32
Stock Annex: Southern Horse Mackerel 2017 http://www.ices.dk/sites/pub/Publication%20Reports/Stock%20Annexes/2017/hom.27.9a_SA.pdf
Overview | 1. First sales in Europe | 2. Extra-EU imports | 3. Consumption
21
| 4. Fisheries and catch in Greenland | 5. Canned sardine in the EU | 6. Global highlights |
7. Macroeconomic contextEuropean Market Observatory for MONTHLY HIGHLIGHTS | NO.5/2021
Fisheries and Aquaculture Products FIRST SALES IN EUROPE
Figure 32. FIRST SALES: COMPOSITION OF “SMALL PELAGICS” (ERS LEVEL) IN SPAIN IN VALUE AND VOLUME,
FEBRUARY 2021
Atlantic horse Atlantic horse
Round mackerel mackerel
Round
sardinella 21% 25%
sardinella
4%
10%
Others Others
11% 12%
European
pilchard
21% European Total volume
Total value
pilchard 4.850 tonnes
EUR 8,3 mil 25%
European
European anchovy anchovy
43% 28%
Price trend
Figure 33. ATLANTIC HORSE MACKEREL: FIRST-SALES PRICES IN SELECTED COUNTRIES, MARCH 2018 -
FEBRUARY 2021
2,20
1,80
1,40
EUR/kg
1,00
0,60
0,20
Feb
Feb
Feb
Mar
May
Mar
May
Mar
May
Aug
Apr
Sep
Dec
Aug
Apr
Sep
Dec
Aug
Apr
Sep
Dec
Jun
Oct
Jul
Jun
Oct
Jun
Oct
Jan
Jul
Jan
Jul
Jan
Nov
Nov
Nov
-0,20
2018 2019 2020 2021
Netherlands Portugal Spain
Over the 36-month observation period (March 2018–February 2021), the weighted average first-sales price of Atlantic
horse mackerel in Portugal was 1,19 EUR/kg, 46% higher than that of Spain (0,82 EUR/kg), and 25% greater than that
of the Netherlands (0,95 EUR/kg).
In the Netherlands, in February 2021, the average first-sales price of Atlantic horse mackerel (0,95 EUR/kg) decreased
by 5% compared to February 2020 and 2019. The lowest average price was registered in May 2018 at 0,43 EUR/kg for
51 tonnes, while the highest average price of 1,00 EUR/kg was registered for several months. This was the maximum
price due to internal sales and internal procedures within the company that owns the catching vessels.
In Portugal, in February 2021, the average first-sales price of Atlantic horse mackerel was 1,92 EUR/kg, 77% and 95%
higher than in February 2020 and 2019, respectively. The lowest price in the past 36 months was registered in November
2018, at 0,62 EUR/kg for 1.583 tonnes. The highest price (2,01 EUR/kg for 733 tonnes) was observed in January 2021.
In Spain, in February 2021, the average first-sales price of Atlantic horse mackerel (1,44 EUR/kg) increased by 43%
compared to February 2020 and by 33% compared to February 2019. The lowest average price was registered in October
2019 at 2,14 EUR/kg for 83 tonnes. The highest average price of 6,74 EUR/kg for 68 tonnes was registered in April 2018.
Overview | 1. First sales in Europe | 2. Extra-EU imports | 3. Consumption
22
| 4. Fisheries and catch in Greenland | 5. Canned sardine in the EU | 6. Global highlights |
7. Macroeconomic contextEuropean Market Observatory for MONTHLY HIGHLIGHTS | NO.5/2021
Fisheries and Aquaculture Products EXTRA-EU IMPORTS
2. Extra-EU imports
The weekly extra-EU import prices (weighted average values per week, in EUR per kg) for nine different species are examined
every month. The three most relevant species in terms of value and volume remain consistent: fresh whole Atlantic salmon
from Norway, frozen Alaska pollock fillets from China, and frozen tropical shrimp (Penaeus spp.) from Ecuador. The other six
species change each month; three are chosen from the commodity group of the month, and three are randomly selected.
The commodity group this month is “small pelagics”, and the featured species are fresh or chilled herring from Norway,
frozen sardines from Morocco, and frozen fillets of mackerel from Iceland. The three randomly selected species this month
are frozen redfish from Iceland, prepared or preserved skipjack (whole or in pieces) from Ecuador, and prepared or preserved
tuna (whole or in pieces) from Mauritius.
Table 20. EVOLUTION OF WEEKLY PRICE AND VOLUME OF THE THREE MOST RELEVANT FISHERIES AND
AQUACULTURE PRODUCTS IMPORTED INTO THE EU
Extra-EU Imports Week Preceding 4- Week 12/2020 Notes
12/2021 week average
Fresh whole Price 6,18 5,95 (+4%) 5,68 (+9%) In the observed period from 2018 to
Atlantic salmon (EUR/kg) 2021, prices tend to range between
imported from 6-7,00 EUR/kg. Upward trend since
Norway (Salmo the beginning of the year, in contrast
salar, CN code with a downward trend over the past
04021440) three years.
Volume 13.622 11.490 (+19%) 11.524 (+18%) Most of the weekly volumes range
(tonnes) from 11.000 to 12.000 tonnes.
Downward trend since the beginning
of the year, in contrast with the
upward trend since week 13 of
2018.
Frozen Alaska Price 2,53 2,48 (+2%) 3,00 (–15%) In the observed past three years,
pollock fillets (EUR/kg) most prices are greater than 2,50
imported from EUR/kg, with four prices over 3,00
China (Theragra EUR/kg. Upward trend over the past
chalcogramma, CN three years.
code 04047500) Volume 2.098 2.878 (–27%) 3.646 (–42%) Fluctuations in supply from 370 to
(tonnes) 7.300 tonnes. About 46% of
volumes are between 2.000 and
3.000 tonnes. Downward trend over
the past three years.
Frozen tropical Price 5,11 4,76 (+7%) 5,80 (–12%) In the past three years, most prices
shrimp imported (EUR/kg) range between 5,50 and 6,00
from Ecuador EUR/kg. Downward trend since week
(genus Penaeus, CN 1 of 2021.
code 04061792) Volume 1.771 3.093 (–43%) 2.296 (–23%) Volumes fluctuate from 700 to
(tonnes) 4.000 tonnes/week, with most
ranging between 1.000 to 2.000
tonnes. Upward trend since week 1
of 2021I.
Source: European Commission (updated 20.04.2021).
Overview | 1. First sales in Europe | 2. Extra-EU imports | 3. Consumption
23
| 4. Fisheries and catch in Greenland | 5. Canned sardine in the EU | 6. Global highlights |
7. Macroeconomic contextEUR/kg EUR/kg EUR/kg
1,50
2,00
2,50
3,00
3,50
4,00
5,00
6,00
7,00
8,00
9,00
4,00
4,50
5,00
5,50
6,00
6,50
7,00
2018/13 2018/13 2018/13
2018/17 2018/17 2018/17
| 4.
2018/21 2018/21 2018/21
2018/25 2018/25 2018/25
2018/29 2018/29 2018/29
2018/33 2018/33 2018/33
European Market Observatory for
2018/37 2018/37 2018/37
Fisheries and Aquaculture Products
2018/41 2018/41 2018/41
2018/45 2018/45 2018/45
2018/49 2018/49 2018/49
Source: European Commission (updated 20.04.2021).
Source: European Commission (updated 20.04.2021).
Source: European Commission (updated 20.04.2021).
2019/01 2019/01 2019/01
2019/05 2019/05 2019/05
2019/09 2019/09 2019/09
2019/13 2019/13 2019/13
2019/17 2019/17 2019/17
2019/21 2019/21 2019/21
2019/25 2019/25 2019/25
2019/29 2019/29 2019/29
2019/33 2019/33 2019/33
2019/37 2019/37 2019/37
2019/41 2019/41 2019/41
2019/45 2019/45 2019/45
7. Macroeconomic context
2019/49 2019/49 2019/49
2020/01 2020/01 2020/01
2020/05 2020/05 2020/05
2020/09 2020/09 2020/09
2020/13 2020/13 2020/13
2020/17 2020/17 2020/17
2020/21 2020/21 2020/21
Figure 36. IMPORT PRICE OF FROZEN TROPICAL SHRIMP FROM ECUADOR, 2018 - 2021
2020/25 2020/25 2020/25
2020/29
Overview | 1. First sales in Europe | 2. Extra-EU imports | 3. Consumption
2020/29 2020/29
Figure 35. IMPORT PRICE OF FROZEN ALASKA POLLOCK FILLETS FROM CHINA, 2018 - 2021
2020/33 2020/33 2020/33
2020/37 2020/37 2020/37
Fisheries and catch in Greenland | 5. Canned sardine in the EU | 6. Global highlights
2020/41 2020/41 2020/41
|
Figure 34. IMPORT PRICE OF FRESH AND WHOLE ATLANTIC SALMON FROM NORWAY, 2018 - 2021
2020/45 2020/45 2020/45
2020/49 2020/49 2020/49
2020/53 2020/53 2020/53
Week 12:
Week 12:
Week 12:
2021/04 2021/04 2021/04
5,11 EUR/kg
2,53 EUR/kg
6,18 EUR/kg
2021/08 2021/08 2021/08
MONTHLY HIGHLIGHTS | NO.5/2021
EXTRA-EU IMPORTS
2021/12 2021/12 2021/12
24You can also read


