ANALYSIS OF THE MEAT MARKET IN THE UNITED STATES - October 2018 - Meat with ...
←
→
Page content transcription
If your browser does not render page correctly, please read the page content below
ANALYSIS
OF THE MEAT
MARKET
IN THE UNITED
STATES

October 2018

                1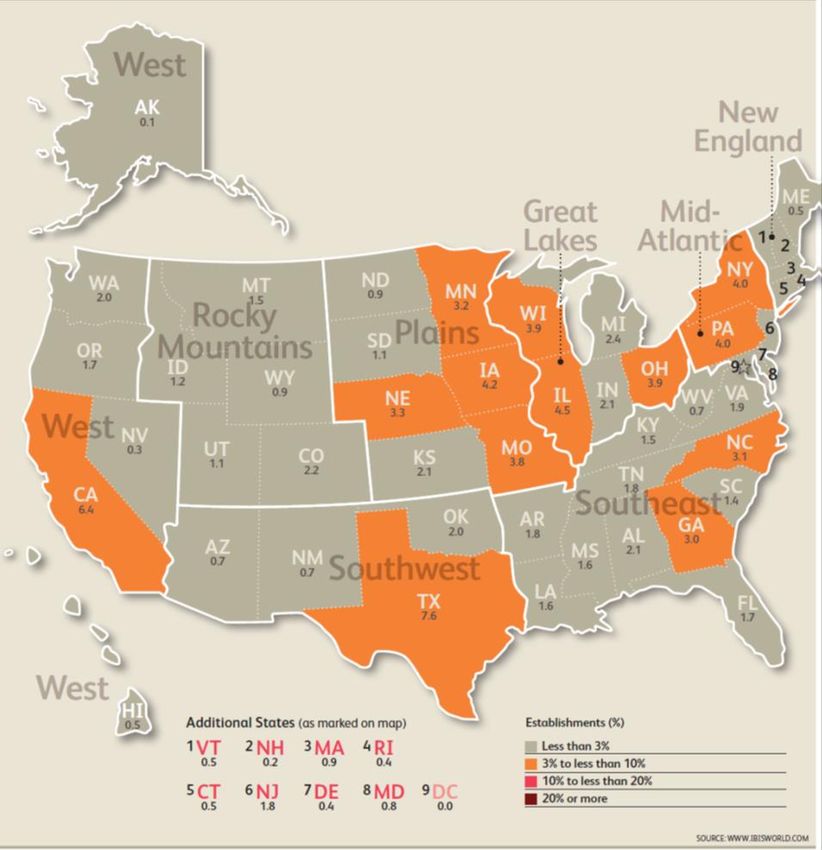
This report is primarily based on:
IBISWorld,
Euromonitor International,
Eurostat,
United States International Trade Commission (USITC),
United States Department of Agriculture (USDA),
ReferenceUSA,
Economic Research Service.
2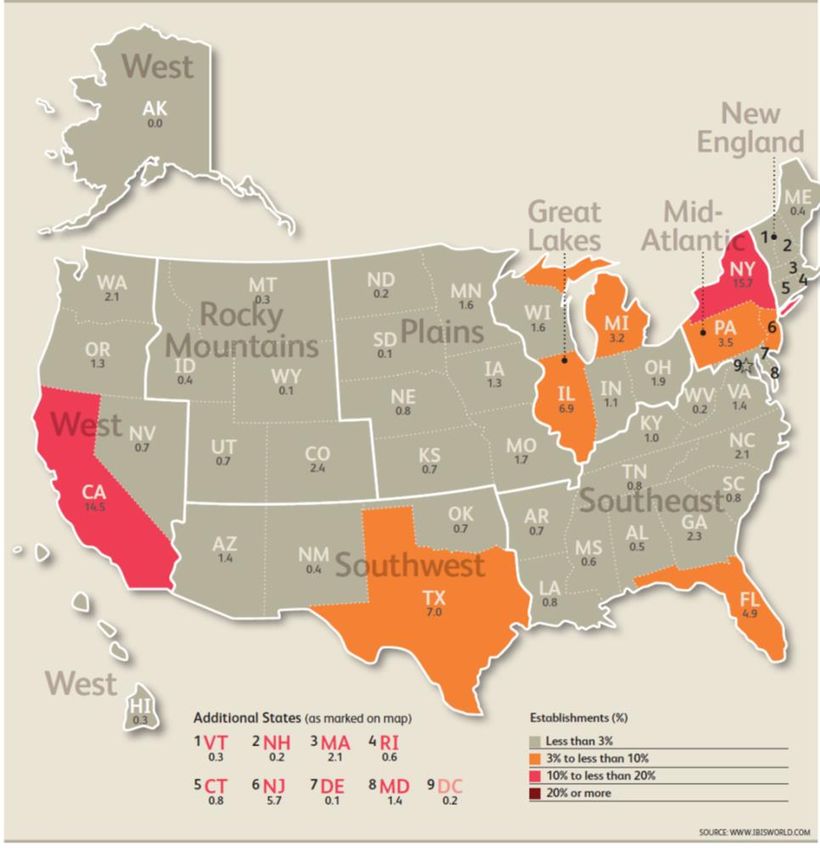
CONTENTS

1.           Production and import from the EU                                   …………………………………………………………………………………………4

     1.1.       Pork........................................................................................................................................................ 4

     1.2.       Beef ........................................................................................................................................................ 7

     1.3.       Meat preparations ................................................................................................................................. 9

2. The situation in the industry ………………………………………………………………………………………………………………………11

     2.1. Introduction ‒ characteristics of the market ............................................................................................. 11

     2.2. Situation on the red meat market in the U.S. ............................................................................................ 14

     2.3. Market situation for red processed meat/meat preparations in the U.S. ................................................. 18

     2.4. Competition on the market for processors, producers and slaughterhouses ........................................... 22

     2.5. Competition on the retail market .............................................................................................................. 24

     2.6. Competition on the market of distribution and wholesale of pork and beef ............................................ 25

     2.7. Location of processors, producers and slaughterhouses .......................................................................... 27

     2.8. Location of sales centers............................................................................................................................ 29

     2.9. Location of THE distribution/wholesale industry ...................................................................................... 31

     2.10. Barriers to entry for processors, producers and slaughterhouses in the U.S. ......................................... 33

     2.11. Barriers to entry into the market for sales centers ................................................................................. 34

     2.12. Barriers to entry into the wholesale meat distribution market............................................................... 35

     2.13. Key determinants of market success ....................................................................................................... 35

     2.14. The future of the industry........................................................................................................................ 36

3.           Consumer trends and factors influencing the consumption of red meat and meat products ……………..37

4.           Distribution channels …………………………………………………………………………………………………………………………40

5.           What and where to export? ……………………………………………………………………………………………………………….46

List of tables, drawings and maps ……………………………………………………………………………………………………………………49

                                                                                                                                                                                  3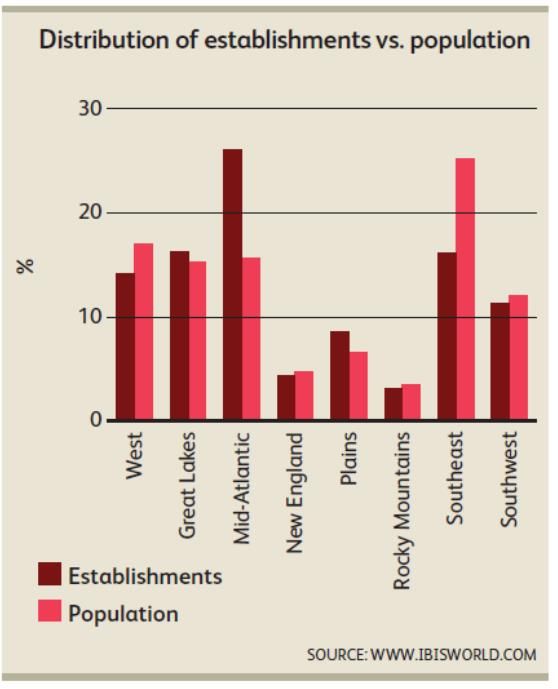
1. PRODUCTION AND IMPORT FROM THE EU

      1.1.    PORK
Production

     The situation on the American pork market has been significantly influenced in recent years by
the growing pig population. The pig population in the first quarter of 2018 in the U.S. increased by
3.1% (y/y) and reached a record 72.8 million pigs. At the same time, it is expected that the supply of
hogs will increase by almost 4% by the end of 2018. The increase in the number of pigs in the U.S.
reflects the increased slaughter capacity of slaughterhouses and the low cost of producing pig
livestock. As a result, production efficiency has reached historically high levels1.
     USDA experts predict a significant increase in pork production in the U.S. in 2018. Production is
expected to increase by approximately 600,000 metric tonnes or 5.2% to a record level of 12.21
million tonnes.2
    Customs duties imposed by China on pork from the U.S. are likely to result in the loss of this
market. However, it is assumed that Americans will be able to partially compensate for the loss of
the Chinese market by selling cheaper American pork to alternative Asian markets. In addition,
Americans export more than 40% of their pork to the Mexican duty-free market. Therefore,
maintaining the current NAFTA trade regime with Mexico is a critical element for the US industry.3
     According to the U.S. Department of Agriculture (USDA), the increase in meat processing
capacity in the U.S. will allow to increase pork production by 3% (y/y) in 2019. Taking into account
the fact that the average prices of hogs in 2019 will remain at a low level of USD 1.22 1.30 per kg
(HCW), it can be concluded that the high competitiveness of American pork in relation to other
countries exporting to world markets will be maintained. In 2019, it will allow for the increase the
export of pork from the U.S. by 4% above the 2018 level. It is predicted that in 2019 the export of
pork from the U.S. will represent 22% of the total production of this meat.4.

1
  https://www.agropolska.pl/produkcja-zwierzeca/trzoda-chlewna/produkcja-wieprzowiny-w-usa-bije-
rekordy,1383.html
2
  http://www.farmer.pl/agroskop/analizy-i-komentarze/coraz-wiecej-wieprzowiny-z-usa,77663.html
3
  https://www.agropolska.pl/produkcja-zwierzeca/trzoda-chlewna/produkcja-wieprzowiny-w-usa-bije-
rekordy,1383.html
4
 https://www.cenyrolnicze.pl/wiadomosci/rynki-rolne/trzoda-chlewna/12453-kzp-ptch-produkcja-
wieprzowiny-w-usa-wzrosnie-o-3-1-w-2019-roku

                                                                                                         4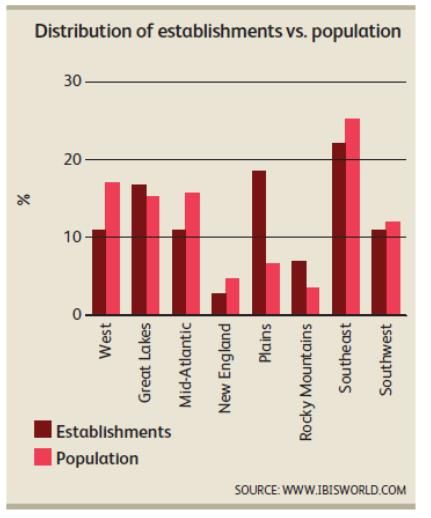
Import from the EU

    In 2017, the United States imported more than 107,000 tonnes of pork from the EU at a value of
almost EUR 370 million; almost 55% by volume and over 48% by value of EU exports came from
Poland.
    During the period under review, EU pork exports to the US increased by 157% by volume and
128% by value. Poland in particular recorded impressive results, with growth rates of almost 1,400%
and 1,100% respectively (see Table 1).
     Below is an overview of EU pork exports from the EU to the U.S. (in terms of volume and value)
in 2013 ‒ 2017.

Table 1 Exports of pork (code 0203) from the EU to the U.S. in 2013 ‒ 2017 (in kg)
                                                                              change           change
                                                                            2017/2013        2017/2016
  COUNTRY          2013       2014       2015        2016       2017
                                                                             (2013 =          (2016 =
                                                                              100%)            100%)
                 4167010     6634660    7166290    8235690 10726840
EU28                                                                                 157%          30%
                       0           0          0          0        0
                             1888060    2416110    3000770
Poland           3906100                                   58555700              1399%             95%
                                   0          0          0
                 2398190     2887790    2574750    2382120
Denmark                                                    23826600                   -1%             0%
                       0           0          0          0
 Spain           1250500     2783700    3226100    5354900 8540400                   583%          59%
 United
                3112100 3266900 5997500            8177100      7711000              148%           -6%
 Kingdom
 Ireland        3900600 6280300 6826600            6359000      4812100               23%          -24%
 Netherlands    4655700 5151200 4922900            8040100      3126100              -33%          -61%
 Finland          758900    760600   598900         474700       477900              -37%            1%
 Italy             27200    164600     84700         74000       144500              431%           95%
 Portugal                                600                      48300
 Germany            2100      7000     23900          19700       19700              838%            0%
 France            51000    124200     73100          27400        6100              -88%          -78%
 Austria                       400                                                       -
 Belgium                     49200                                                       -
 Hungary                                               1100                              -        -100%
 Sweden            24000                                  0                              -
Source: own study based on EUROSTAT data

                                                                                                      5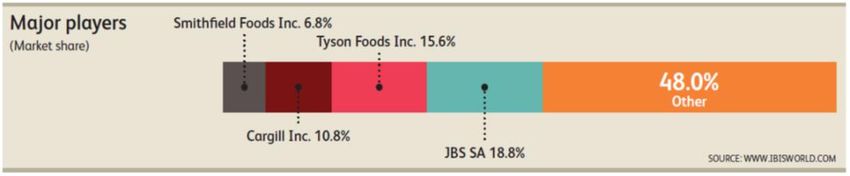
Analyzing USDA FAS data 5 for the years 2013 ‒ 2017, it should be noted that pork imports
account for a small share in consumption on the US market. The main sources of imports are
primarily Canada and the leading pork producers in the EU and Mexico. Canada is by far the largest
source of pork import to the US, although its position is weakening. According to the USDA FAS data,
in 2013 imports from Canada covered 82% of pork imports to the United States in terms of volume,
down to 66% in 2017. For example, at the same time the share of Poland increased from about 3% to
over 14%. Imports into the United States often depend on transport costs and production distances
from central urban areas. Most of the goods imported from the EU are frozen pork (HS 0203 29) as
well as pork products, which are usually specialties of a specific region. A large part of the pork
imports from the EU to the US, and in particular from Denmark, are the popular baby back ribs.

Table 2 Exports of pork (code 0203) from the EU to the U.S. in 2013 ‒ 2017 (in EUR)
                                                                                         Change     Change
                                                                                        2017/2013 2017/2016
     COUNTRY           2013         2014        2015         2016           2017
                                                                                       (2013=100% (2016=100%
                                                                                            )          )
EU28                 161200306    243600845   268046300    293906995       367855741         128%        25%
Poland                14833182     53807517     64167231    81965323       177458634        1096%       117%
Denmark               91413070    100314803   104898781    103148514       101013416          11%        -2%
Spain                  5502050     13111509     14070898    21333150       32991382          500%        55%
United Kingdom        12868900     12754407     24451793    28264939       27103938          111%        -4%
Ireland               13759110     21182531     27464809    25414312       18869088           37%       -26%
Netherlands           19395128     38627887     29472603    30832784        7207326          -63%       -77%
Finland                3075777      2722198      2651066     2198084        2110896          -31%        -4%
Italy                    148236      736169       621184      533631         829812          460%        56%
Portugal                                           14733                     148874
Germany                    6221       20229        68389       50830          65771          957%        29%
France                   107754      238616       164813      147376          56604          -47%       -62%
Croatia                     785
Hungary                                                        18048
Sweden                    90093                                     4
Austria                                3200
Belgium                               81779
Source: own study based on EUROSTAT data

5
    United States Department of Agriculture. Foreign Agriculture Service

                                                                                                               6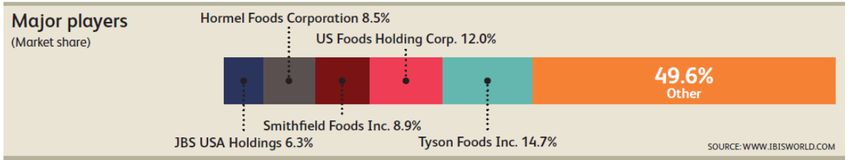
1.2.     BEEF
Production

      The United States is one of the world's leading beef producers. They produce more than 25
billion lbs. (more than 11.4 million tonnes) of this type of meat every year. According to Livestock
Marking Information Center data from 2017, the states that make the greatest contribution to beef
production in the U.S. are: Texas, Nebraska, Kansas, California and Oklahoma. Nevertheless, the US
does not cover the demand of its over 300 million market. Due to the popularity of beef among
Americans, the U.S. is obliged to import significant quantities of this product.6
     Generally speaking, the price of beef sold in the U.S. falls every year. In 2016, the average price
per pound (lb.) of beef was $5.96, which means that it fell by $0.33. The United States exported
1,187,050 metric tons of beef in 2016, which is an increase compared to 2015, when exports of this
product amounted to 1,067,614 metric tons. The biggest recipients of American beef are (in the
following order): Japan, Mexico, South Korea, Canada and Hong Kong.7
     In 2016, the U.S. imported a total of 360,921 metric tons of fresh beef. The Table below shows
the 4 largest suppliers of this product to the U.S. market in 2016.8

Table 3 Main exporters of fresh beef to the U.S. in 2016
                  Country                                     The volume of import in metric tonnes
    Canada                                                                         90,757
    Australia                                                                      80,987
    New Zealand                                                                    77,521
    Mexico                                                                         71,075
Source: Analysis of the American food and agricultural market ‒ beef, pork, poultry ‒ opportunities
for Polish entrepreneurs, Poland. Trade & Investment Section, Consulate General of Poland in New
York, June 2017
     The volume of beef production in the United States increased by almost 4% in 2016 due to
higher supplies of cattle and carcasses of higher weight. This increase in production was also
 associated with strong domestic demand for beef.
     It should be assumed that US beef exports will grow in the coming years, supported by increased
supplies to South Korea, Japan and Mexico. It is likely that lower beef production in Australia will
result in a reduction in exports of this meat, thereby increasing demand for US beef on Asian

6
  Analysis of the American food and agricultural market ‒ beef, pork and poultry meat ‒ opportunities for Polish
entrepreneurs, Poland. Trade & Investment Section, Consulate General of Poland in New York, June 2017
7
 Ibid
8
  Ibid

                                                                                                                   7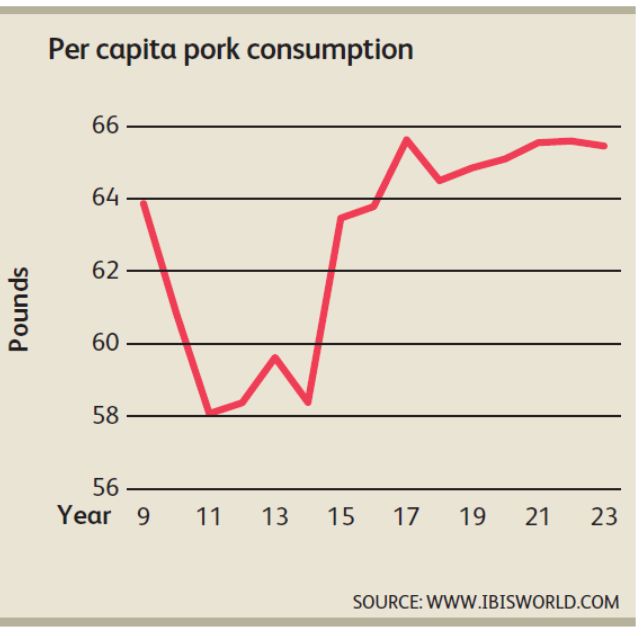
markets, where these two exporters compete fiercely for market share. In addition, it can be
assumed that a drop in wholesale beef prices will increase the competitiveness of American beef on
world markets.
Import from the EU

     In 2017, the United States imported more than 1.3 thousand tonnes of beef from the EU at a
value of more than EUR 8 million. More than 49% by volume and almost 41% by value of EU exports
came from Ireland (see Table 4).
    Over the period under review, EU beef exports to the US increased by 1,067% by volume and
423% by value.
        Below is an overview of beef exports from the EU (in terms of volume and value) in 2013 ‒ 2017.

Table 4Exports of beef (code 0202) from the EU to the U.S. in 2013 ‒ 2017 (in kg)
                                                                                Change             Change
    COUNTRY            2013       2014       2015       2016       2017       2017/2013          2017/2016
                                                                             (2013 = 100%)      (2016 = 100%)
EU28                    113700     126400    1069500    1505300   1326800           1067%                 -12%
Ireland                                       520500    1001300    654000                   -               20%
Netherlands                                      700     137100    398900                   -             -23%
United Kingdom          108500     115400     497000     325200    249900            130%
Germany                   5200      11000      26200      20000     24000            362%                 -35%
Greece                                                      500                             -
Italy                                          25100      21200                             -             191%

Source: own study based on EUROSTAT data

Table 5 Exports of beef (code 0202) from the EU to the U.S. in 2013 ‒ 2017 (in EUR)
                                                                               change            change
    COUNTRY            2013       2014       2015       2016       2017       2017/2013         2017/2016
                                                                             (2013=100%) (2016=100%)
EU28                   1525737    1187157    5967894    8095626    8121322           432%                 0%
Netherlands               1888                  4530     637336    3559034        188408%             168%
Ireland                                      2972339    5697270    3292624                             -36%
Germany                  32548      69708     135784     102445     274210           742%
United Kingdom         1491301    1117449    2746836    1556411     995454           -33%              -42%

                                                                                                               8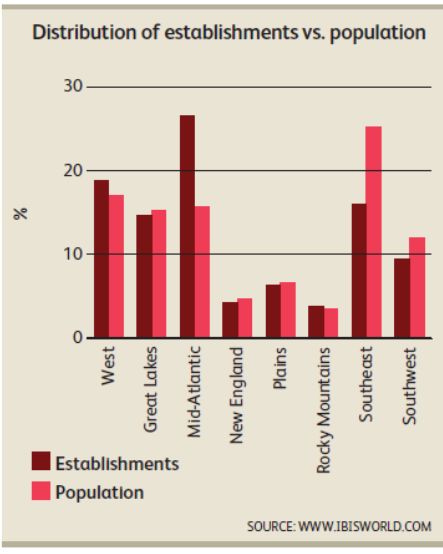
Greece                                                        1320
Italy                                          108405      100844                                       458%

Source: own study based on EUROSTAT data

        1.3.   MEAT PREPARATIONS

Production

      Data on the production of meat preparations are very dispersed, making it practically impossible
to determine the level of production of this category of products.9 Taking into account the
segmentation of the meat market presented in the Figure below, it is only possible to estimate the
value of processed meats production in the United States in 2018, which amounted to USD 53.75
billion.

Drawing 1. U.S. meat market segmentation

                                                                                                 Source:
                                                                                                 www.ibiswor
                                                                                                 ld.com

9
  It was not possible to obtain statistical data on the production of meat preparations. American statistics
classify meat products under the "Meat processed from carcasses” category (North American Industry
Classification System code: 311612). The products in this category are derived from the processing of beef and
pig carcasses. The "Meat processed from carcasses" category contains products such as: Bacon, slab and sliced.
Beef stew. Beef, primal and sub-primal cuts. Bologna. Boxed beef. Boxed meat. Collagen sausage. Cooked
meats. Corned meats. Cured meats (e.g., brined, dried and salted). Dried meats. Frozen meat pies (i.e.,
tourtires). Hams, canned. Hams, preserved. Hot dogs. Lamb, primal and sub-primal cuts. Luncheon meat. Meat
canning. Meat extracts. Meat products canning. Meats cured or smoked. Meats, fresh or chilled, frozen.
Pastrami. Pig's feet, cooked and pickled. Pork, primal and sub-primal cuts. Potted meats. Processed meats.
Salted meats. Sandwich spreads, meat. Sausage and similar cased products. Sausage casings, collagen. Smoked
meats. Variety meats, edible organs. Veal, primal and sub-primal cuts, made from purchased carcasses.

                                                                                                                 9
The 'Processed meats’ product category refers to processed meat products (except poultry),
including frozen products and cooked hams and sausages. The share of this segment in the total
market revenue has remained unchanged over the last five years. These products constitute a low-
cost, basic nutritional base in the diets of consumers. Although meat preparations are seen as less
healthy than self-prepared food made from raw meat, low prices are expected to ensure a stable
market share for this product category.
Import from the EU
In 2017, the United States imported more than 9.3 thousand tons of meat products from the EU
for a value of more than EUR 114 million. Almost 77% by volume and almost 83% by value of EU
exports came from Italy (see Table 6).
Over the period under review, EU exports of meat preparations to the U.S. increased by 50% by
volume and 44% by value.
The Table below presents how EU exports of meat products (in terms of volume and value) took
place in 2013 ‒ 2017.
Table 6 Exports of meat preparations (code 0210) from the EU to the U.S. in 2013 ‒ 2017 (in kg)
change change
COUNTRY 2013 2014 2015 2016 2017 2017/2013 2017/2016
(2013 = 100%) (2016 = 100%)
EU28 6237300 7551000 9222600 8822300 9363600 50% 6%
Italy 5259300 6370700 7899000 7029800 7182100 37% 2%
Spain 559600 538300 631900 812400 1126900 101% 39%
Sweden 0 274800 322700 578800 590600 - 2%
Germany 316600 277700 197100 178600 221700 -30% 24%
Poland 22900 46000 63500 37300 115100 403% 209%
Denmark 8700 5900 82000 165200 111600 1183% -32%
France 18400 0 2300 15600 13800 -25% -12%
United Kingdom 42400 37600 16500 3500 1800 -96% -49%
Austria 7600 0 -
Netherlands 9400 11 - -100%
Source: own study based on EUROSTAT data
10Table 7 Exports of meat preparations (code 0210) from the EU to the U.S. in 2013 ‒ 2017 (in EUR)
change change
COUNTRY 2013 2014 2015 2016 2017 2017/2013 2017/2016
(2013 = 100%) (2016 = 100%)
EU28 79257952 92233614 115011638 110447415 114092214 44% 3%
Italy 67246584 81112733 101122286 92074611 94661308 41% 3%
Spain 8468611 7579263 10466671 14529673 15044238 78% 4%
Germany 3130856 2909206 2400398 2268809 2901338 -7% 28%
Sweden 326 273535 326674 612740 623272 191088% 2%
Denmark 30482 20352 271735 542332 361393 1086% -33%
Poland 91286 174552 242684 154650 307211 237% 99%
France 8846 30 29795 202571 185302 1995% -9%
United Kingdom 175232 163943 51082 44969 8146 -95% -82%
Netherlands 101894 16663 6 -100% -100%
Croatia 3835 -
Ireland 24 -
Portugal 681 128 -
Austria 99632 245 -
Source: own study based on EUROSTAT data
2. THE SITUATION IN THE INDUSTRY
2.1. INTRODUCTION - CHARACTERISTICS OF THE MARKET
The US meat market grew by 2% overall in 2017, reaching 20.5 million tonnes.
The meat market continues to benefit from consumer demand for higher protein intake.
Beef and veal is the most dynamic category, with an overall increase of 4% in 2017,
reaching 6.7 million tonnes.
The meat market is expected to grow by 2% overall over the forecast period (2017 ‒ 2022),
reaching 22.3 million tonnes in 2022.
The US meat industry, including meat producers and retailers, sells a variety of fresh, frozen and
cured meat mainly to households and other markets. In recent years, growth in the meat market
11sector has become increasingly difficult. Competition on the part of traditional and non-traditional
retailers has limited the development of meat markets and butcher shops. In addition, the traditional
dynamics of links between food retailers, wholesalers and producers are changing, making the food
retail market more competitive in general.
Companies operating on the meat market have faced increasing competition from
supermarkets, grocery stores and large retail stores in recent years. Each of these retail channels
provides a wide range of products, while benefiting from economies of scale.
Competition is expected to continue to further reduce the number of operators by 2023. The
price of red meat is expected to fall during this period, while the price of poultry is expected to rise.
Competition from supermarkets is expected to intensify as alternative retail channels diversify
selected products to attract more consumers. In addition, per capita meat consumption is expected
to increase only slightly, despite the rise in consumer incomes. In general, the revenues of the meat
industry are expected to remain under strong pressure and stagnation. Industry revenues are
projected to increase by 0.2% per annum to USD 6.9 billion over the five years to 2023.10
The wholesale trade in beef and pork is also experiencing difficult operating conditions. The
industry ‒ which was supposed to be an intermediary between beef and pork producers and retailers
‒ will slow down when red meat prices fall and consumers will prefer substitutes. Scientific studies
linking the consumption of beef and pork to heart disease have placed representatives of the meat
industry (beef and pork) in a difficult situation, as the health problems associated with red meat
consumption have strongly influenced consumer tastes. While demand for red meat has been falling,
but not as originally expected, alternative sources of protein, such as poultry and seafood, recorded a
relatively higher increase in demand. Moreover, the fall in prices of red meat, resulting from
increased supplies from livestock farms, have hindered the prospects of income growth. As a result,
IBISWorld estimates that revenues in the industry will fall by 1.0% to USD 55.3 billion in 2018.
The wholesale sector is undergoing major structural changes due to a growing trend among
manufacturing companies, which are turning into wholesalers. Both large and small retailers are
increasingly buying directly from food producers, allowing these players to avoid wholesale costs
and high margins. This development has led to a general consolidation of the industry. Independent
wholesalers compete for a smaller pool of contracts or join new entrants through mergers.
Demand for red meat is expected to increase slightly over the five years to 2023, as sales
divisions and producer offices (DSBOs) are becoming increasingly important in the industry. The
structure of DSBO will continue to stabilize, and DSBO will benefit from economies of scale and
increased operational efficiency. In addition, expected increases in household disposable income will
keep demand for beef and pork products at a stable level. It is also expected that the fall in red meat
prices will decrease over this period.
10
Meat, Beef & Poultry Processing in the U.S., IBISworld, www.ibisworld.com
12As a result, industry revenue is expected to grow at an average rate of 0.4% to USD 56.3 billion
over the five years to 2023.11
Pork and beef are the categories that generate the highest revenue for the entire meat sector
in the United States, accounting for 14% and 26.3% of the total revenue of the meat sector
respectively.12
It is worth noting that beef is the largest segment in the "meat" category in the U.S., accounting
for 37.8% of the total category revenue. The United States is the world's largest beef producer, and
beef is the second largest type of meat consumed per capita per year, followed only by poultry meat.
Over the last five years, however, consumers have started to move towards a healthier
lifestyle and increased consumption of alternative sources of protein such as poultry and fish,
resulting in a fall in per capita beef consumption. As a result, beef consumption may continue to
fall.
Drawing 1 Changes in the consumption of beef in pounds
Source: www.ibisworld.com
Pork, on the other hand, is the second largest segment in the "meat ‒ wholesale distribution"
category in the United States with over 20% share of revenue in the market in 2018. The increase in
11
Meat, Beef & Poultry Processing in the U.S., IBISworld, www.ibisworld.com
12
Beef & Pork Wholesaling in the U.S., IBISworld, www.ibisworld.com
13pork production contributed to an increase in sales of pork products. Moreover, over the period
2013 ‒ 2018, there was a 1.6% increase in the consumption of pork per capita.13
As in the case of beef, consumers are also worried about pork for health reasons, looking to
alternative sources of protein. However, per capita consumption of pork is expected to increase in
2018, which represents a potential opportunity for industry and European exporters.
Drawing 2 Changes in the consumption level of pork in pounds
Source: www.ibisworld.com
2.2. SITUATION ON THE RED MEAT MARKET IN THE U.S.
Americans are increasingly eating meat, choosing more frequent and often larger portions of
products such as chicken, beef and pork in their daily meals. As a result, the American meat industry
recorded a relatively steady growth in the analyzed period (2012 ‒ 2017). In response, farmers and
breeders have increased the size of their farms to meet the growing demand for protein. At the same
time, many retailers and operators have sought new, creative uses for meat. It is worth noting that
protein consumption remains a priority for many Americans, so the meat industry has good
conditions for sustainable growth in the coming years.
13
Beef & Pork Wholesaling in the U.S., IBISworld, www.ibisworld.com
14Table 8 Red meat sales in 2012 ‒2017
2012 2013 2014 2015 2016 2017
Red meat sales ‒ volume (in thousand tons)
Beef and veal 6,436.1 6,360.7 6,157.8 6,176.9 6,397.1 6,665.3
Pork 3,179.3 3,266.4 3,231.3 3,508.2 3,569.0 3,615.0
Retail sales of red meat ‒ volume (in thousand tons)
Beef and veal 3,465.0 3,427.3 3,306.1 3,336.1 3,463.7 3,601.7
Pork 2,617.2 2,690.0 2,662.1 2,896.7 2,938.2 2,982.0
Retail sales of red meat ‒ value (USD billion)
Beef and veal 29,931.6 30,232.5 29,597.9 30,358.1 29,580.2 30,362.2
Pork 17,912.4 18,800.6 18,882.2 20,885.1 20,332.6 19,919.4
Source: Meat in the U.S., Euromonitor International, Passport, April 2018
The total volume of sales of beef and veal in 2012 ‒ 2014 declines. It is only between 2015 and
2017 that an increase in sales of this type of meat can be observed. Sales of pork, on the other hand,
decreased in 2014 and then gained in total sales volume from 2015 onwards. Retail sales of red meat
‒ both beef, veal and pork ‒ have been increasing since 2015. The value of retail sales of red meat is
subject to greater fluctuations due to price fluctuations on the meat market.
Table 9 Red meat sales in 2012 ‒ 2017 ‒ changes in the value of sales (in %)
2017/2016 2012 - 2017 CAGR 2017/2012
Red meat sales ‒ in thousand tons
Beef and veal 4.2 0.7 3.6
Pork 1.3 2.6 13.7
Retail sales of red meat ‒ in thousand tons
Beef and veal 4.0 0.8 3.9
Pork 1.5 2.6 13.9
Retail sales of red meat ‒ USD billion
Beef and veal 2.6 0.3 1.4
Pork -2.0 2.1 11.2
15Source: Meat in the U.S., Euromonitor International, Passport, April 2018
In the years 2012 ‒ 2017 sales of red meat increased. The growth was particularly noticeable on
the pork market. In total volume, the increase was 13.7%; in retail sales it was also 13.7%. On the
other hand, valuable sales of pork in this period increased by 11.2%.14
Table 10 Retail sales of organic meat in 2012 ‒ 2017
2012 2013 2014 2015 2016 2017
Retail sales of organic meat ‒ volume (in thousands tons)
Organic meat 446.1 481.4 527.6 592.9 632.7 667.9
Organic meat retail sales ‒ value (billion USD)
Organic meat 7,029.2 7,714.5 8,518.0 9,694.1 9,896.9 10,193.5
Source: Meat in the U.S., Euromonitor International, Passport, April 2018
The growth on the red meat market was particularly noticeable on the organic meat market, the
volume and value of which increased year-on-year in the analyzed period.
Table 11 Retail sales of organic meat in 2012 ‒ 2017 ‒ changes in value of sales (in %)
2017/2016 2012 - 2017 CAGR 2017/2012
Retail sales of organic meat ‒ in thousand tons
Organic meat 5.6 8.4 49.7
Retail sale of organic meat ‒ USD billion
Organic meat 3.0 7.7 45.0
Source: Meat in the U.S., Euromonitor International, Passport, April 2018
The level of this increase is presented in the Table above. Analyses show that in 2017, compared
to the base year (2012), the volume of organic meat retail sales increased by almost 50%, while the
value of organic meat retail sales increased by 45%.
14
Meat in the U.S., Euromonitor International, Passport, April 2018
16Table 12 Forecast of red meat sales in 2017 ‒ 2022
2017 2018 2019 2020 2021 2022
Forecast of red meat sales ‒ volume (in thousand tons)
Beef and veal 6,665.3 6,781.4 6,865.6 6,924.9 6,983.6 7,047.5
Pork 3,615.0 3,700.2 3,760.0 3,823.4 3,872.3 3,910.3
Forecast of retail sales of red meat ‒ volume (in thousand tons)
Beef and veal 3,601.7 3,683.7 3,757.8 3,834.9 3,876.3 3,907.4
Pork 2,982.0 3,054.0 3,126.7 3,178.1 3,219.6 3,259.4
Forecast of retail sales of red meat ‒ value (USD billion)
Beef and veal 30,362.2 31,053.8 31,678.5 32,328.1 32,677.0 32,939.6
Pork 19,919.4 20,400.4 20,886.1 21,229.6 21,507.2 21,772.5
Source: Meat in the U.S., Euromonitor International, Passport, April 2018
Based on Euromonitor International data, it is worth noting that in 2017 ‒ 2022 it is expected
that the sale of red meat, both beef and veal, as well as pork, will be subject to constant stable
growth.
Table 13 Forecast of red meat sales in 2017 ‒ 2022 ‒ changes in the value of sales (in %)
2018/2017 2017 - 2022 CAGR 2022/2017
Forecast of red meat sales ‒ in thousand tons
Beef and veal 1.7 1.1 5.7
Pork 2.4 1.6 8.2
Forecast of retail sales of red meat ‒ in thousand tons
Beef and veal 2.3 1.6 8.5
Pork 2.4 1.8 9.3
Forecast of retail sales of red meat ‒ USD billion
Beef and veal 2.3 1.6 8.5
Pork 2.4 1.8 9.3
Source: Meat in the U.S., Euromonitor International, Passport, April 2018
17Retail sales of both beef, veal and pork in the analyzed period will grow at a faster rate than the
total volume of red meat sales.
Table 14 Meat distribution by distribution channel in 2012 ‒ 2017 (% of total volume)
2012 2013 2014 2015 2016 2017
Retailers 60.5 60.6 60.6 60.7 60.7 60.7
Operators 34.4 34.3 33.9 34.1 34.4 34.1
Institutions/Organizations 5.1 5.1 5.5 5.2 4.9 5.2
Altogether 100.0 100.0 100.0 100.0 100.0 100.0
Source: Meat in the U.S., Euromonitor International, Passport, April 2018
Meat is sold through distribution through three channels: retailers, operators and
institutions/organizations. The share of these distribution channels in the analyzed period is subject
to slight fluctuations. The share of individual channels is also an indication for European exporters in
which distribution channel to look for business partners and markets for exported meat.
2.3. MARKET SITUATIO N FOR RED PROCESSED MEAT/MEAT PREPARATIONS IN THE U.S.
Growing demand for meat did not translate into demand for meat products in the U.S., which
has been subject to turbulence in recent years, mainly due to growing health awareness among
consumers. The growing trend of health awareness causes consumers to put the consumption of
fresh and natural ingredients and the least processed food in the first place. After several decades of
falling sales, meat products are projected to return to modest but positive growth in 2017 ‒ 2022.
The evolution of sales of processed red meat between 2012 and 2017 is shown in the Table
below.
Table 15 Sales of processed red meat by category in 2012 ‒ 2017
2012 2013 2014 2015 2016 2017
Sales of processed meat by category: volume (in thousand
Product categories
tons)
15
Shelf-Stable Processed Red Meat 263.1 255.2 252.7 245.1 237.3 234.6
Chilled Processed Red Meat 2,613.5 2,679.3 2,590.9 2,461.4 2,432.8 2,406.2
Frozen Processed Red Meat 189.6 192.2 195.1 191.1 196.4 190.8
15
Food that can be safely stored at room temperature in a closed container. This includes foods that would
normally be stored chilled but have been processed in such a way that they can be safely stored at room
temperature or ambient temperature for a long shelf-life.
18Product categories Sales of processed meat by category: value (USD million)
Shelf-Stable Processed Red Meat 1,268.4 1,265.1 1,271.4 1,257.4 1,236.5 1,251.5
Chilled Processed Red Meat 16,096. 15,800. 15,696.
14,606. 15,434. 16,064.
8 1 7 8 6 3
Frozen Processed Red Meat 2,090.9 2,153.5 2,224.6 2,280.2 2,253.6 2,238.5
Source: Processed meat and seafood in the U.S., Euromonitor International, Passport, December
2017
The sales volume of Shelf-Stable Processed Red Meat from 2012 and Chilled Processed Red
Meat from 2014 decreased in the analyzed period. The volume of sales of Frozen Processed Red
Meat is subject to fluctuations in the analyzed period.
Sales of Chilled Processed Red Meat and Frozen Processed Red Meat increased until 2015 and
then started to decline. In the Shelf-Stable Processed Red Meat category, on the other hand, there
was a drop in sales value between 2015 and 2016 and an increase in 2017.
The Table below presents sales forecasts for processed red meat in 2017 ‒ 2022.
Table 16 Forecast of sales of processed red meat by category in 2017 ‒ 2022
2017 2018 2019 2020 2021 2022
Product categories volume (in thousand tons)
Shelf-Stable Processed Red Meat 234.6 231.9 229.6 228.0 227.2 226.7
Chilled Processed Red Meat 2,406.2 2,400.4 2,411.8 2,432.2 2,457.4 2,491.6
Frozen Processed Red Meat 190.8 189.2 189.8 191.0 192.8 195.3
Product categories value (USD million)
Shelf-Stable Processed Red Meat 1,251.5 1,234.4 1,218.7 1,206.4 1,196.7 1,190.1
Chilled Processed Red Meat 15,696. 15,595. 15,627. 15,764. 15,944. 16,181.
3 3 3 5 7 6
Frozen Processed Red Meat 2,238.5 2,210.1 2,214.5 2,232.3 2,256.2 2,290.8
Source: Processed meat and seafood in the U.S., Euromonitor International, Passport, December
2017
According to Euromonitor International, the value and sales volume of Shelf-Stable Processed
Red Meat is expected to decline further between 2017 and 2022.
In addition, sales of Chilled Processed Red Meat and Frozen Processed Red Meat are projected
to increase slightly.
19Table 17 Forecast of sales of processed red meat by category in 2017 ‒ 2022 - changes in sales
volume and value (in %)
2018/2017 2017 - 2022 CAGR 2022/2017
Product categories volume
Shelf-Stable Processed Red Meat
-1.1 -0.7 -3.4
Chilled Processed Red Meat -0.2 0.7 3.5
Frozen Processed Red Meat -0.9 0.5 2.3
Product categories value
Shelf-Stable Processed Red Meat stored at room
-1.4 -1.0 -4.9
temperature
Chilled Processed Red Meat
-0.6 0.6 3.1
Frozen Processed Red Meat -1.3 0.5 2.3
Source: Processed meat and seafood in the U.S., Euromonitor International, Passport, December
2017
During the forecast period, the value and sales volume of Shelf-Stable Processed Red Meat will
further decrease by 3.4% and almost 5%, respectively. The other two categories, Chilled Processed
Red Meat and Frozen Processed Red Meat, will show a slight increase.
The following Figure shows the distribution channels for red processed meat / meat
preparations in the U.S.
20Drawing 3 Red meat/meat preparations distribution channels in the U.S.
3,9% Convenience Stores
increasing
2,7% Discounters
decreasing
no change 76,1% Modern Grocery Retailers 34,9% Hypermarkets
34,5% Supermarkets
91,2% --- Grocery Retailers
0,1% --- Forecourt Retailers
14,9% Independent Small Grocers
15,1% Traditional
4,7% Mixed Retailers Grocery Retailers
0,2% Other Grocery Retailers
3,4% Non-Grocery Specialists
0,1% Direct Retailing
0% Non-Store Retailing 0,5% Internet Retailing
0% --- Home Retailing
Calculation based on sales value for 2017 according to retail prices
Percentage share in 2017
Changes in the percentage share for 2012 ‒ 2017
21The analysis of the information in the Figure above shows that retail store sales (99.3%) remain
the dominant distribution channel for processed red meat / meat preparations in the United States,
although their share is declining.
The three main distribution channels included in retail sales (shares in 2017) are:
• hypermarkets (34.9%) ‒ increase
• supermarkets (34.5%) ‒ decrease
• independent small grocery stores (14.9%) ‒ decrease
It is worth noting that in the years 2012 ‒ 2017 an increase in online sales was noted.
2.4. COMPETITION ON THE MARKET FOR PROCESSORS, PRODUCERS AND
SLAUGHTERHOUSES
Processors operating on the market are well-established companies. The dominant trend is
market consolidation aimed at gaining a competitive advantage in a mature environment. Instead of
developing their product offer, companies take over smaller players, which is defined by the “big
can more" policy among operators. As a consequence of market acquisitions, economies of scale are
strengthened, where more of the same products are produced at lower unit costs.
The four largest companies in the sector account for 52% of the total market. Two companies,
Tyson and Smithfield, leaders in pork and poultry processing, took over the beef and turkey
processing facilities. One of the acquisitions that was temporarily stopped by the Antitrust Court is
the transaction of JBS S.A., which wanted to buy out National Beef Packing Company LLC. If the
takeover had taken place, JBS would have had more than 80% of the beef processing market.
Source: www.ibisworld.com
JBS USA HOLDING - MARKET SHARE 18.8%
JBS USA Holdings is a branch of the Brazilian JBS S.A. JBS USA Holdings is the third largest beef
and pork processor on the market. The company was established in 2007 when JBS S.A. entered the
US market and took over Swift & Company. Through the two main companies ‒ Swift Beef and Swift
Pork ‒ the company serves the wholesale market with 9 distribution centers throughout the country.
In 2017, the total revenue of JBS S.A. amounted to USD 27.9 billion. In 2008, the company purchased
its own transport fleet of 150 large refrigerated trucks. Currently, the company's fleet is 700 vehicles
22of this type operating under the JBS Carriers brand. In the U.S., the company employs over 60
thousand people. In its portfolio of brands JBS has a number of well-known market brands in the U.S.
such as Aspen Ridge, 5star and 1855. Experts indicate that the revenue level of JBS USA Holdings
increased annually by 5.4% between 2013 and 2018. In 2009, the company acquired Pilgrim's Pride
and Cargill.
TYSON FOODS, INC. - MARKET SHARE 15.6%
Tyson Foods, Inc. is a company founded in 1935, which is the second largest global processor
and wholesaler of pork, beef, poultry and processed products. Beef represents the largest (about
38.8) percentage of the companies' sales. Pork is in second place with a 13.7% share. In 2017, the
company's total revenue was USD 38.3 billion. Tyson Foods, Inc. through its distribution centers
supplies retail chains, wholesalers, the army, restaurants, schools and hospitals. An important
recipient of the company's products is Walmart, to which over 10% of sales is directed. In June 2014,
Tyson Foods Inc. acquired the meat processor Hillshire Brands Company, a producer of well-known
brands in the U.S. market: Hillshire Farm, Ball Park, Jimmy Dean and Aidells. The transaction cost was
estimated at USD 8.6 billion. In 2017, the company made further purchases totaling USD 155 million,
taking over Advance Pierre and San Diego Prepared Foods. The company's revenue in 2013 ‒ 2018
increased
by 0.4%.
CARGILL, INC. - MARKET SHARE 10.8%
Cargill, Inc. is a company founded in 1865, which is an international food processor and
distributor. The company employs 155 thousand people in 70 countries. Cargill, Inc. processes over 8
million beef carcasses annually, supplying distribution networks and grocery stores. The company
produces, processes and sells mainly poultry. It sells turkeys and turkey parts under the Honeysuckle
White and Riverside brands at turkey processing plants in the United States. The company also
processes meat in Central America, Asia and Europe. In October 2015, Cargill, Inc. sold its pork
business, including two pork processing plants in Illinois and Iowa, to JBS USA for USD 1.5 billion.
SMITHFIELD FOODS, INC. - MARKET SHARE 6.8%
Smithfield Foods, Inc. is a company founded in 1936. Since 2013 it has been part of the WH
Group Limited. The company is known and appreciated for its hams and meat products. With the
acquisition of more than 40 companies, Smithfield Foods, Inc. has become one of the world's largest
pork producers. The company currently employs over 52,000 employees. WH Group Limited
generated USD 22.4 billion of total revenue in 2017. The company owns more than 200 product
brands, the most famous of which are: Smithfield, Eckrich, Farmland, Cooks, Nathan's Famous and
Healthy Ones Brands. All pork products are processed and packed in the U.S. and some of them are
distributed to Canada, Japan, Mexico, Russia and China. The company's income is closely related to
the health of pigs. In 2014, the company experienced the PEDV epidemic, which significantly reduced
production and triggered a public discussion on the safety of pork. Since 2014, the company's
revenue has fallen by 2.4% per annum.
232.5. COMPETITION ON THE RETAIL MARKET
The level of competition on the U.S. meat retail market is relatively high. There is strong internal
competition between retailers and external competition from a small number of large foreign retail
chains and convenience stores. The two main players in the market generate 13% of the industry's
revenue. For this reason, exporters wishing to enter the U.S. market may consider the areas in which
they will compete with the entities (retailers) already operating on the market. The second, less risky,
solution may be to decide to cooperate with a selected retailer(s) who knows the market and how it
operates.
The main fields of competitiveness for European exporters may be:
price,
diversification of the product basket,
product quality: freshness, color, taste,
comprehensive and transparent product information,
corporate social responsibility expressed in humane slaughter,
showing the origin of the product ‒ organic/eco trend,
offering ready-to-eat meat meals, so-called ready-to-cook.
The meat sector in the United States is characterized by a low level of internationalization.
This means that almost all operators are small American entities, quite fragmented, directing their
sales exclusively to the American market, and this market is very often the most important for them.
Even the Omaha Steaks industry magnate limits its sales to the U.S., Canada, Puerto Rico and the
Virgin Islands (USA).
Source: www.ibisworld.com
Omaha Steaks International, Inc. is a family business established in 1917. Currently, the
company with an 8.8% market share in retail sales sells high quality meat and processed meat
products. It has two production plants, a distribution center and a complex of cold storehouses. Their
offer includes over 400 products sold in about 80 company stores in the U.S. and via the Internet. It
employs over 1,800 employees.
24The company's revenue in 2018 is estimated at approximately USD 601.8 million. The company
is growing rapidly with an estimated annual revenue growth of 6%. By investing in organic and eco
categories, it successfully adapts to the needs of consumers. The company's organizational structure,
including processing, distribution and retail, also contributes to its leading position. Omaha Steaks
International, Inc. controls the entire production and distribution chain.
The Honey Baked Ham Company is the second company with a significant share in the revenues
of the industry. It was founded in 1957 in Detroit, Michigan. The company's revenues account for
4.6% of the industry's revenues. Currently, the company owns 400 franchise stores in the U.S. and
sells through an online store. Estimated revenue for 2018 will amount to approximately USD 315
million.
2.6. COMPETITION ON THE MARKET OF DISTRIBUTION AND WHOLESALE OF PORK AND
BEEF
The internationalization of the sector, as already mentioned, remains at a low level. Despite the
fact that the majority of operators are national companies, a few of them are a part of global
consortia such as Smithfields (Chinese) or representatives of foreign capital such as JBS S.A.
(Brazilian). The globalization of the sector is expected to intensify in the coming years with the trend
towards market consolidation and the growing importance of MSBO (Manufacturers Sales Branches
and Offices).
Internal competition
Operators in the beef and pork sector compete primarily on price, assortment and services.
Due to the variety of sizes of producers, the competition for beef and pork wholesalers is high. The
industry also competes with self-service retail outlets based primarily on location and operational
costs associated with efficient transport. Moreover, most of the internal competition in the industry
took place between Manufacturers Sales Branches and Offices (DSBO) and independent wholesalers.
Wholesalers base their business on the proximity of their customers, as this saves on transport
costs, which in turn allows the wholesalers to reduce their prices. In addition, brands are
increasingly important as branding allows operators to set higher prices for their products, thereby
achieving higher profit margins.
Technology is also rapidly becoming the basis of competition in this industry. This includes the
integration of advanced logistics systems to effectively monitor inventory levels, sales trends and
customer order management. Plants/wholesalers are increasingly engaging in complementary
retail services such as brand development, warehousing, retail store development and various
financial and technical support services.
External competition
There are wholesalers on the market offering frozen food products, including pre-packaged
frozen meat and meat products, which are direct substitutes for fresh meat and meat products. For
this reason, operators in the frozen food wholesale industry are the main competitors of fresh beef
25and pork wholesalers. Other key competitors include operators in the egg and poultry wholesalers
and seafood wholesalers, which are wholesale alternative sources of protein. Price, location, quality
and perceived nutritional value of products are the main pillars of external competition in these
industries.
Source: www.ibisworld.com
Characteristics of companies: Tyson Foods, Inc., Smithfield Foods, Inc. and JBS USA Holdings
have already been described under "Competition on the market of processors, producers and
slaughterhouses."
Hornel Foods Corporation is a company founded in 1891, which is currently mainly involved in
the trade of pork and turkey meat. It is one of the leaders in the wholesale of pork meat and
products based on it. It employs about 21,000 people. In 2017, the company's total revenue reached
USD 9.1 billion. It owes its sales success to signed contracts with large retail chains ‒ 11%
of pork products are collected by Walmart. Hornel's 5 key customers are responsible for more than
a quarter of the company's sales results. In 2017, the company acquired 3 other companies with a
total value of USD 906 million. As Hornel's offer basket consists mainly of pork products, the
company was hit hard by the outbreak of the swine diarrhea epidemic virus (PEDv) in 2014. It can be
concluded that the situation is now completely under control and that the stock of livestock has been
completely restored.
US Foods Holding Corp., founded in 1989, the company is a leading distributor of meat for
catering companies. It employs over 25,000 people. It offers 350,000 products distributed to over
250,000 regular customers. The main products include meat, seafood and numerous food products.
The company has numerous brands in various product categories. In the context of pork and beef
distribution, the well-known trademarks are Cattleman's Selection, Patuxent Farms, Stock Yards and
Metro Deli Brands. The company is a supplier of products for the institutional and restaurant
segment as well as regional fast food outlets. US Foods currently concentrates its activity on the
restaurant and health care market, which significantly influences the growth and development of the
company. The company's annual revenue growth in 2013 ‒ 2018 was at the level of 0.5%.
Performance Food Service is a company with an estimated share of 3.5% of the sector's
revenues. This entity mainly delivers its product to restaurant chains, hotels and resorts
and other entities in the food service industry. It has over 150,000 corporate customers. With a wide
network of 25 centers and 10 specialist distribution facilities, the company operates throughout the
country. The company serves such restaurant giants as Burger King, Subway and Popeye's. The main
26meat supplier for Food Service is Tyson.
McLane Company, Inc., the company with an estimated share in the sector revenue of 2.3%,
initially belonged to Walmart. Then, in 2003, it was taken over by Warren Buffet`s Berkshire
Hathaway. It is one of the largest food distribution companies, serving over 110 thousand service
outlets throughout the United States. Among the customers there are such well-known brands as:
Pizza Hut, Taco Bell, KFC, 7-Eleven and Walmart. In 2017, more than 25% of the company's revenue
was generated by Walmart. Experts from Ibisworld estimate the company's total revenue at the end
of 2018 at USD 1.3 billion.
Golden State Foods Corporation, a company with an estimated market share of approximately 1.5%,
is known to be a major supplier of products to the McDonald's network, supplying the network with
more than 130 products. In addition, the company distributes its products to 25,000 other fast food
outlets using 21 distribution centers throughout the United States. Currently, the company is
expanding its clients' portfolio with the next fast foods restaurant chains such as Popeys's and Arby's.
Experts estimate the company's total revenue at the end of 2018 at USD 823 million.
2.7. LOCATION OF PRO CESSORS, PRODUCERS AND SLAUGHTERHOUSES
In view of the potential entry 16 of European exporters into the US meat market, the
information presented in the following section is only complementary to the industry situation. It
is also worth noting that the location of processors, producers and slaughterhouses largely
coincides with the location of sales centers and the distribution/wholesale industry.
South-East Region: 22.1% of production and processing plants are located in this region. This
number is related to the large number of poultry meat processing facilities in states such as Arkansas,
Georgia and Alabama. As part of internal competition, these states compete strongly with big strong
processing centers: California ‒ 6.4% of the sector facilities and Texas ‒ 7.6% of the sector facilities.
Region Plain: is the main breeding region for pigs and cows; this fact has a significant impact on
the distribution of producer-processing plants, which significantly reduces transport costs. 18.5% of
the sector's facilities are located in the region despite the fact that the population in this region is
much lower than the U.S. average.
Great Lakes Region: it is the third largest region of production and processing of pork, beef and
poultry meat. 16% of production and processing facilities are located in the region. As in the Plain
Region, the population of the Great Lakes Region is much lower than the U.S. average. The Great
Lakes region is characterized by the highest concentration of plants producing finished meat
products, hams and sausages. The States of Illinois and Wisconsin are third in the U.S. in terms of the
concentration of meat processing plants. The region is regarded as a key hub in the meat processing
sector because of its geographical location ‒ between regions with low population density and a
16
Mainly exports of beef and pork produced in the EU rather than production and slaughter in the U.S.
27highly developed agricultural sector and regions with high population density and a large number of
recipients of processed meat products.
Map 1. Location of processors, producers and slaughterhouses in the USA (data for 2018)
Source: IBISWorld
28Drawing 4 Number of facilities vs. population
Source: IBISWorld
2.8. LOCATION OF SALES CENTERS
The location of entities belonging to the meat industry is inseparably linked with population
density, having the highest representation in the states with the highest population density. The
largest number of economic operators is in the regions of the Mid-Atlantic, Great Lakes and South-
East.
The largest area in terms of population density is the Mid-Atlantic, where 26.1% of businesses
are located, with particular emphasis on cities: New York 13.2%, Pennsylvania 6.4%, New Jersey 4.6%
and the District of Columbia.17
The Great Lakes Region is the second most densely populated area with the location of more
than 16.3% of the business entities.
17
Beef & Pork Wholesaling in the U.S., IBISworld, www.ibisworld.com
29The South-East region is the third most densely populated area with around 16.1% of
the meat market. The specificity of the region distinguishes it from the two above as its
inhabitants buy meat more frequently in large supermarkets.
Since the location of meat sales centers is determined by population density, European beef
and pork exporters should first look for future business partners/sales centers in these locations to
ensure that the goods exported are disposed of and ‒ given the degree of population ‒ that
demand is stable.
Map 2. Location of the main meat sales centers in the U.S. (data for 2018)
Source: www.ibisworld.com
30Drawing 5 Number of sales points vs. population
Source: www.ibisworld.com
2.9. LOCATION OF THE DISTRIBUTION/WHOLESALE INDUSTRY
Representatives of the wholesale distribution sector are located in the regions where they have
the largest number of their target customers. This arrangement of business facilitates and
accelerates transport and reduces operating costs, as well as reduces the risks associated with a
short product life cycle on store shelves. It seems that representatives of the wholesale distribution
sector should be the first potential business partners for European exporters. As already indicated
above, there is also a correlation between the number of retail outlets and the number and density
of population.
The largest area in terms of population density is the Mid-Atlantic, where 26.5% of businesses
are located, with particular emphasis on the cities New York ‒ 15.6%, and New Jersey ‒ 5.7%. It is
actually from these cities that the eastern coast regions are supplied.
The Western region is the second most densely populated area with more than 19.0% of
business entities. This is a region where more than 17.3% of the U.S. Population lives, with the
dominant role of California, where more than 14.5% of all economic operators in this sector in the
U.S. are located.
31The South-East region is another key area in terms of population density, with about 15.9% of
the meat market players. Florida plays a decisive role in this region with 4.9% of the operating
entities.
The Great Lakes Region is represented by 14.6% of the operating operators.
Map 3. Location of meat wholesale distribution centers in the U.S. (data for 2018)
Source: www.ibisworld.com
32Drawing 6 Number of operators vs. population
Source: www.ibisworld.com
2.10. BARRIERS TO ENTRY FOR PROCESSORS, PRODUCERS AND SLAUGHTERHOUSES IN
THE U.S.
In view of the potential entry 18of European exporters into the U.S. meat market, the
information presented in the following section is only complementary to the industry situation.
Experts agree that the main barriers to entry are U.S. and federal regulations for the processing
industry and the strict USDA (U.S. Department of Agriculture) and EPA (Environmental Protection
Agency) regulations.
Another powerful barrier is the existing network of business relations and long-term contracts
between companies that have been operating on the market for years. Within the developed
structure, each party not only derives financial benefits, but also eliminates the risk associated with
interruption of supply or changes in customer service. In this dimension, the effect of habituation
and brand awareness plays an important role.
18
Mainly exports of beef and pork produced in the EU rather than production and slaughter in the U.S.
33Table 18 Barriers to entry into the U.S. meat market
Competition high
Concentration average
Life cycle stage mature
Capital intensity average
Technological changes average
Legal regulations many
Industry support high
Source: www.ibisworld.com
2.11. BARRIERS TO ENTRY INTO THE MARKET FOR SALES CENTERS
The market for meat sales centers in the United States poses relatively low barriers to entry for
new entities. The main initial investments related to entering the market include: the required
purchase of fiscal cash registers, equipment for storing and displaying meat and the lease of store
space.
Due to the small diversity of the product range, there is a great potential for producers with
niche and regional products, especially those of the organic and eco type or those with a darker
color than the one traditionally found in the U.S.
It is worth noting, however, that this market is in decline, hence the support of the industry is
not too high. On the other hand, companies competing in the meat sales centers market try to
penetrate the market strongly in order to minimize losses, which results in a high level of
competition. Considering the above, it can be concluded that the meat sales centers sector is not
very attractive for a new entrant.
Table 19Barriers to entry into the U.S. meat sales centers market
Competition high
Concentration low
Life cycle stage in decline
Capital intensity average
Technological changes average
Legal regulations average
Industry support low
Source: www.ibisworld.com
34You can also read