The Gender Gap in Income and the COVID-19 Pandemic - DISCUSSION PAPER SERIES - IZA ...
←
→
Page content transcription
If your browser does not render page correctly, please read the page content below
DISCUSSION PAPER SERIES

IZA DP No. 14360

The Gender Gap in Income
and the COVID-19 Pandemic

Karina Doorley
Cathal O’Donoghue
Denisa M. Sologon

MAY 2021
DISCUSSION PAPER SERIES

IZA DP No. 14360

The Gender Gap in Income
and the COVID-19 Pandemic

Karina Doorley Denisa M. Sologon
Economic and Social Research Institute, Luxembourg Institute of Socio-Economic
Institute of Labor Economics, Trinity College Research and IZA
Dublin and IZA
Cathal O’Donoghue
The National University of Ireland, Galway

MAY 2021

Any opinions expressed in this paper are those of the author(s) and not those of IZA. Research published in this series may
include views on policy, but IZA takes no institutional policy positions. The IZA research network is committed to the IZA
Guiding Principles of Research Integrity.
The IZA Institute of Labor Economics is an independent economic research institute that conducts research in labor economics
and offers evidence-based policy advice on labor market issues. Supported by the Deutsche Post Foundation, IZA runs the
world’s largest network of economists, whose research aims to provide answers to the global labor market challenges of our
time. Our key objective is to build bridges between academic research, policymakers and society.
IZA Discussion Papers often represent preliminary work and are circulated to encourage discussion. Citation of such a paper
should account for its provisional character. A revised version may be available directly from the author.

 ISSN: 2365-9793

 IZA – Institute of Labor Economics
Schaumburg-Lippe-Straße 5–9 Phone: +49-228-3894-0
53113 Bonn, Germany Email: publications@iza.org www.iza.org
IZA DP No. 14360 MAY 2021

 ABSTRACT
 The Gender Gap in Income
 and the COVID-19 Pandemic1
 The gender income gap is large and well documented for many countries. Recent research
 shows that it is mainly driven by differences in working patterns between men and
 women, but also by wage differences. The tax-benefit system cushions the gender income
 gap by redistributing between men and women. The Covid-19 pandemic has resulted in
 unprecedented levels of unemployment in 2020 in many countries, with some suggestion
 that men and women have been differently affected. This research investigates the effect
 of the Covid-19 pandemic on the gender gap in income in Ireland. Using nowcasting
 techniques and microsimulation, we model the effect of pandemic induced employment
 and wage changes on market and disposable income. We show how the pandemic and
 the associated tax-benefit support can be expected to change the income gap between
 men and women. Policy conclusions are drawn about future redistribution between men
 and women.

 JEL Classification: D31, H23, J16, J31
 Keywords: gender inequality, Ireland, tax-benefit system, COVID-19

 Corresponding author:
 Karina Doorley
 The Economic and Social Research Institute
 Whitaker Square
 Sir John Rogerson’s Quay
 Dublin 2
 Ireland
 E-mail: karina.doorley@esri.ie

 1
 This work was carried out with funding from the ESRI’s Tax, Welfare and Pensions Research Programme
 (supported by the Department of Public Expenditure and Reform, the Department of Employment Affairs and Social
 Protection, the Department of Health, the Department of Children, Equality, Disability, Integration and Youth and
 the Department of Finance). Funding from the Health Research Board (HRB COVID-19 Rapid Response Award) is also
 gratefully acknowledged.
1. Introduction

Given the rapid spread of the COVID-19 virus and the associated lockdown measures,
governments have had to respond rapidly and quite severely to slow the spread of the virus and
flatten the curve of new infections, hospitalizations and deaths. This has had significant and
wide-reaching implications on many aspects of life - health, economic and social - and has
been affecting different social groups in highly asymmetric ways.

This research focuses on gender income inequality and its likely trajectory during and in the
immediate aftermath of the pandemic. We estimate the gender income gap in Ireland before
the pandemic and at three points during the pandemic, corresponding to the three waves of the
virus. We show how the gender income gap is cushioned by the pre-pandemic tax and transfer
system as well as by the pandemic related income supports.
Ireland is a country with a significant and recent history of progress in gender equality but one
which still retains a sizable gender wage and gender work gap – these combined lead to a
significant gender income gap. Ireland experienced substantial employment and income loss
during the pandemic. More than half of the workforce in Ireland was in receipt of state income
support at the height of the crisis in April 2020.
This gender gap in market, or pre-tax and transfer income, is certain to be affected by the
economic effects of the pandemic. Women are disproportionately in low-paying and insecure
jobs. They are traditionally more likely to shoulder the burden of childcare and elder care,
which is particularly relevant during a period of school closure and elderly cocooning (Alon,
Doepke, Olmstead-Rumsey, & Tertilt, 2020). However, women also tend to be over-
represented in both locked-down sectors (such as hospitality) and essential sectors (such as
healthcare). Research to date presents a somewhat mixed view of the gender division of job
and income losses during the pandemic.
Most of the research suggests that women were more likely to suffer job and income losses as
a result of the pandemic than men (Adams-Prassl, Boneva, Golin, & Rauh, 2020; Andrew, et
al., 2020; Alon, Coskun, Doepke, Koll, & Tertile, 2021; Fabrizio, Gomes, & Tavares, 2021).
However, some research indicates important cross-country differences. In a study of six
countries, Dang & Nguyen (2021) show that women were more likely to permanently lose their
jobs than men in China, Italy and the US but were less likely to permanently lose their jobs in
Japan, South Korea and the UK. They also showed that women were more likely to temporarily
lose their jobs in China and the UK but were less likely to temporarily lose their jobs in Japan,
South Korea, Italy and the US. Alon et al. (2021) show that women’s labour supply fell relative
to men’s in 18 of 28 countries studied when measured by employment, and in 19 of 28 countries
when measured by hours worked. However, Ireland was one of the few countries which saw a
slight increase in women’s labour supply relative to men’s under both measures.2
Even within a country, there is not always consensus on the immediate impact of the crisis by
gender. Using data from the Covid-19 supplement of Understanding Society, Hupkau &
Petrongolo (2020) find that labour market outcomes of men and women were roughly equally
affected at the extensive margin but that women suffered smaller losses at the intensive margin.

2
 Other countries that saw increases in female labour supply relative to male labour supply via hours and
participation were Austria, Norway and the UK.
This is in contrast to other research for the UK which relies on independent surveys, which find
that women’s employment decreased by more than men’s employment (Oreffice & Quintana-
Domeque, 2020; Sevilla & Smith, 2020). Administrative information on job losses in Ireland
to date indicate that their scale has been reasonably similar for men and women.
In addition to the gender gap in market income, the gender gap in disposable, or post-tax and
transfer income, is also likely to be affected by the pandemic and not only through its effect on
market income. Tax-benefit changes enacted so far due to the pandemic have increased the
generosity of welfare payments in many countries, including Ireland, without increasing
income taxes. While tax-benefit systems do not differentiate based on gender, traditional
gender divisions of work and caring roles mean that men are disproportionately affected by
income tax changes while women are disproportionately affected by changes to welfare
payments (Stotsky, 2016). The extent of gender differences in wages and work intensity and
the design of the tax-benefit system determines how men and women are affected by policy
changes. The question of how pandemic related employment and wage changes and
discretionary tax-benefit policy has affected men and women is therefore an empirical one.
Quantifying the effect of the pandemic on the incomes of men and women is complicated by
the fact that most representative surveys which contain information on family income, taxes,
benefits and demographics are released with a delay of two or more years. To overcome this,
we employ a nowcasting technique based on microsimulation (O’Donoghue & Loughrey,
2014) using the most recent data on employment and wage levels to calibrate a simulation
model of household incomes, taxes and benefits. This approach produces a real-time picture of
the population and the distribution of income from different sources and allows us to identify
those most affected by the pandemic. We merge this framework with a gender decomposition
technique developed by Doorley & Keane (2020). The authors develop a method to measure
the cushioning effect of the tax-benefit system on gender income inequality and, using data and
policies from 2017, estimate that the gender income gap is reduced tax-benefit policy by 10-
40% in a cross-section of European countries.
We use the resulting method to “nowcast” the 2020 income distribution in Ireland, accounting
for pandemic related employment and income. We then quantify (i) the composition of the
gender gap in income in Ireland (ii) how the gender gap in income was cushioned by the tax-
benefit system immediately prior to the pandemic and (ii) the relative roles of the market and
the tax-benefit system in changing the gender income gap during the three waves of the
pandemic. Conclusions are drawn regarding the likely trajectory of gender income inequality
in Ireland and elsewhere in future. Our results suggest a growing importance of gender and
equality budgeting.

 2. Gender equality in Ireland

The structure of the Irish labour force has been strongly influenced by the historical role of
women in Irish society.3 In the 1937 Constitution of the Republic of Ireland, there was a legal
basis for excluding women from the labour market and confining them to the home. The
marriage bar of 1932 prevented married women from working in the civil service and existed
until 1973. Similar marriage bars existed elsewhere but were lifted earlier. For example, the

3
 Russell et al (2017) describe the evolution of gender equality in the Irish labour market over the last 50 years.
British marriage bar was lifted in 1944, reflecting the increased prevalence of women in male-
dominated industries during the Second World War. A system of fully joint taxation for married
couples existed in Ireland until the early 2000s and indeed, prior to the 1980 Supreme Court
ruling, a wife’s income was regarded as part of their husband’s for tax purposes (O’Donoghue
and Sutherland, 1999). This provided a disincentive for the secondary earner in a couple, who
was usually female, to work. Reforms to this system were strongly opposed and the current
system is now a hybrid, partially individualised one, which retains some of the same
disincentives (Doorley, 2017).
The activity and employment rates of Irish women have been rising over the last couple of
decades and are currently around the EU average. Eurostat figures show that, in 2019, around
69% of Irish women and 91% of Irish men were employed. Comparable figures from the UK
were 72% (women) and 84% (men) and from the EU-28 were 68% (women) and 80% (men).
The average weekly hours worked by Irish women is similar to that of women in the UK
(around 32 hours) but less than that of women in the EU as a whole (around 34 hours).
The raw Irish gender pay gap, measured as the percentage difference between average male
and female hourly wages, is low by European standards, at around 14% in 2018. Comparable
figures for the UK and EU are 20% and 15% respectively. An adjusted measure of the gender
wage gap, which accounts for different labour market characteristics of men and women, puts
the Irish gender wage gap closer to 11%, similar to the adjusted UK gender wage gap at around
12% (Redmond & McGuinness, 2019).
The gender gap in market income is relatively high, at close to 50%, in Ireland. However, the
Irish tax-benefit system is also relatively effective at redistributing between men and women.
Doorley & Keane (2020) estimate that, in 2017, the gender gap in income was reduced by one-
fifth due to the tax benefit system. Roughly half of this redistribution was performed by the
benefit system while another half was attributable to taxation. This was at the upper end of the
redistribution between men and women estimated for the countries studied. As elaborated upon
in the next section however, heterogeneity in how the Covid-19 pandemic has affected the
labour market could significantly change this estimate, with implications for policy makers
who are engaged in gender budgeting.

 3. The Covid-19 pandemic in Ireland

 3.1 Policy response

The first case of Covid-19 in Ireland was confirmed on February 29th 2020. The first
“lockdown” of Ireland began on 12th March 2020 with the closing of schools, childcare
facilities, universities and other public buildings. Mass gatherings were also cancelled. On 15th
March, pubs and bars were instructed to close. The result was a huge loss of employment in
the hospitality sector. The Pandemic Unemployment Payment (PUP) was announced on the
same day at a rate of €203 per week, which was the same as the maximum personal rate for the
main existing unemployment supports. However, the PUP required no contribution history
(unlike the contributory unemployment benefit - Jobseeker’s Benefit) and was not subject to a
means test (like the non-contributory unemployment benefit - Jobseeker’s Assistance). The rate
of the PUP increased to €350 per week following an announcement on 24 March. A number of
changes to the rate were processed in the following months amidst claims that many recipients
were receiving more in PUP than their prior earnings. At the time of writing, the PUP is a four-
tier benefit, with claimants entitled to €203, €250, €300 or €350 per week, depending on their
prior earnings. The PUP is intended to be a temporary payment and is set to be withdrawn in
2021, subject to labour market recovery.
On 19th March 19 2020, the Employer Refund Scheme was introduced which allowed
employees to remain on company payrolls while receiving a support payment which was
reimbursed to businesses by the State. This scheme was replaced by the Temporary Wage
Subsidy Scheme (TWSS) from 26th March which allowed employers to claim subsidies of up
to €410 per week for eligible employees that were kept on the payroll. On September 1st, the
TWSS was replaced by the Employment Wage Subsidy Scheme (EWSS) which provides a
flat-rate subsidy per employee to employers who have suffered at least a 30% loss in turnover.
Unlike the furlough scheme in the UK, workers receiving the Irish wage subsidy were
permitted to continue working. A number of tiered payments were added to this scheme in
October 2020, in line with changes to the PUP. The subsidy ranges between €203 and €350 per
week, depending on the gross income of the employee. This scheme is also intended to be
temporary in nature and is set to be withdrawn in 2021.
A third major measure introduced in response to the pandemic was Enhanced Illness Benefit
for COVID-19. The traditional waiting period for Illness Benefit of 6 days4 was abolished for
those who contract the virus and/or are required to self-isolate and the rate of the benefit
increased from €203 to match the highest rate of the PUP, of €350 per week.
A cautious re-opening of the economy during the summer of 2020 was followed by a second
wave of the virus and a second lockdown in October, 2020. The second lockdown was different
in nature to the first in that schools, childcare facilities and the construction sector remained
open. In early December, restrictions were eased once more only to be re-introduced in January
as a third wave of the virus gripped the country. The third lockdown extended to schools,
childcare for non-essential workers and the construction sector and began to be eased in April
2021. Each lockdown resulted in an uptick in PUP and wage subsidy claimants.

 3.2 Heterogeneity in employment effects

The unemployment rate in Ireland (including those on the PUP), displayed in Figure 1, peaked
at around 30% in April 2020 and was slightly higher for men than for women at this point (32%
compared to 29%). It fell gradually over the summer months before increasing again in October
and in January 2021, coinciding with the second and third economic lockdowns. In March
2021, it stood at around 24% and was similar for men and women.

4
 This waiting period was reduced to 3 days in March 2021
Figure 1 The unemployment rate of those aged 15-74 in Ireland between January 2020 and
March 2021

 Unemployment rate
 35
 30
 25
 Percentage

 20
 15
 10
 5
 0

 Men Women

Source: Central Statistics Office

The youth unemployment rate peaked at a much higher rate of 64% in May 2020 (Figure 2).
This was slightly higher for women than men and the discrepancy widened during the rest of
the year. In March 2021, the youth unemployment rate was 65% for women and 54% for men.
Figure 2 The unemployment rate of those aged 15-24 in Ireland between January 2020 and
March 2021

 Youth unemployment rate 2020
 80
 70
 60
 Percentage

 50
 40
 30
 20
 10
 0

 Men Women

Source: Central Statistics Office

Figure 3 shows the gender breakdown of wage subsidy recipients at one point in time, August
2020. This is the latest available wage subsidy data which is available disaggregated by gender.
Women are slightly more likely to be in receipt of the wage subsidy than men, particularly the
youngest and oldest cohorts. Although wage subsidy recipients are not included in the
unemployment figures above, when the wage subsidy expires, these individuals may be at
serious risk of unemployment.
Figure 3 The proportion of each age cohort in receipt of the Temporary Wage Subsidy
Scheme in August 2020

 TWSS recipients August 2020
 25%

 20%

 15%
 Female

 10% Male

 5%

 0%
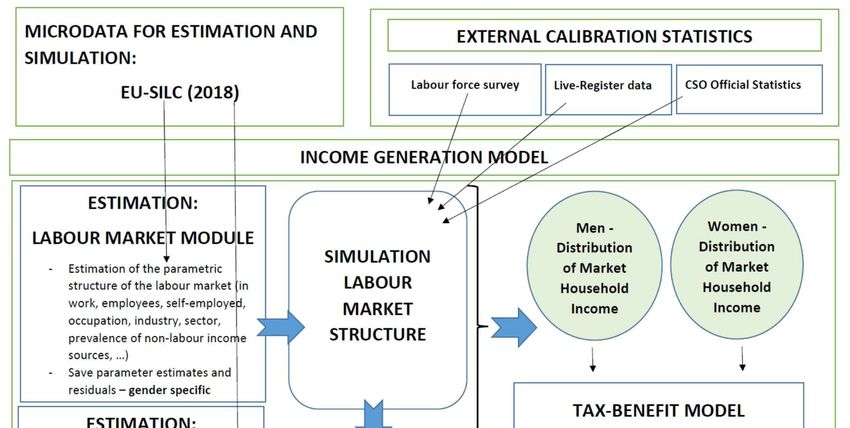
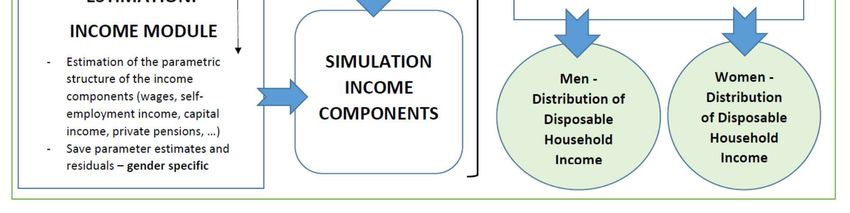
population, the distribution of income from different sources and allows us to identify those most affected by the pandemic. There are a number of different ‘nowcasting’ methods. Some, more simple methods apply wage indexation factors and proportionally change the employment rate in specific industries. (Navicke, Rastrigina, & Sutherland, 2014). We utilize a more nuanced approach that allows us to model the heterogeneity of changes in the population, following the latest developments in O’Donoghue et al. (2020) and Sologon et al. (2020). Figure 4 provides a graphical description of the method. This method relies on two core components: an income generation model (IGM) to characterise and simulate the distribution of household income and its subcomponents. a nowcasting component that calibrates the simulations of the IGM to external labour market, wage and price statistics in order to reflect the most recent developments in the distribution of income. We extend this infrastructure by integrating a third component, a gender decomposition of income, following the method developed by Doorley and Keane (2020). This allows us to understand how gender income gaps are likely to change in the short-term as a result of the Covid-19 pandemic.
Figure 4. Model Structure 4.1 Household income generation model The household income generation model (IGM) follows the framework developed by Sologon et al. (2020), which relies on a system of hierarchically structured, multiple equation models for the components of household income which describe parametrically how the receipt and the level of income sources vary with personal characteristics. Residuals link the model predictions to observed income sources. A similar IGM has been used for cross-country analysis (Sologon, Van Kerm, Li, & O'Donoghue, 2020); for historical analysis in Lithuania (Černiauskas, Sologon, O’Donoghue, & Tarasonis, 2020) and in Australia (Li, La, & Sologon, 2020). The IGM describes the distribution of household disposable income in a particular period and then allows the simulation of counterfactual distributions under alternative labour market, policy, returns or demographic scenarios. We present first the five main household income components modelled in our approach: =gross labour income (for employees and the self-employed) =capital income (investment and property (rental) income) =other market incomes (including, private pensions, private transfers and other incomes) =public benefits =personal direct taxes and social insurance contributions.
 = { + + } + { − }
 { } { }

Each income component is parametrically linked with the observed individual and household
characteristics (typically education and demographic characteristics for labour market models
and, in addition, labour market characteristics such as industry, occupation, sector and hours
for employment income).5 For each income source we apply a two-step procedure:

 (i) First, we estimate the incidence of the income source for individual in household
 ℎ, :

 1, ℎ ℎ
 =
 0, ℎ
where S ∈{employment, self-employment, investment, property, other}.
 (ii) Second, we estimate the level of the income source , for those that receive it
 ( = 1).

For annual labour income, we first estimate an in-work binary indicator equal to 1 if the
individual receives any income from work, and 0 otherwise. For those in work, we estimate a
model for being employed versus self-employed, their occupation, industry and sector. A
similar binary strategy is applied for the remaining market income (sub-)components: capital
and other incomes. The modelling of the prevalence of the income sources and the labour
market structure (employment status, occupation, industry, sector and hours) is part of the
labour market module in Figure 4 and involves estimating logistic and multinomial logistic
models.

After modelling the labour market structure, we proceed to modelling the income sources,
conditional on the variables modelled in the preceding step. This is part of the income module
in Figure 4. It involves estimating log-linear models for monthly wages, self-employment
income, investment, property and other market income sources.

We estimate each equation of the model independently and store the vector of parameter
estimates and the vector of residuals for each model. All of the labour market models in our
IGM are estimated separately by gender.

Formally, this is represented by:

 = ( + )

 = ( + )

 =

5
 Detailed information about these characteristics, as well as those used in other parts of the framework is available
in Appendix A.
where is the number of individuals in the household.
These parametric relationships are reduced-form projections that describe the empirical
associations between the household and individual characteristics and the various income
sources. We use these projections to simulate counterfactual distributions of market incomes
under alternative scenarios: a different labour market structure, a different structure of
economic returns or a different demographic composition. Specifically, for this analysis, we
use our projections to: (i) nowcast the latest available data to reflect the situation before and
during the crisis and, (ii) to simulate counterfactual distributions of market incomes for women
if they were paid according to the male wage structure and if their labour market participation
and hours and occupation/industry choice followed the male distributions.
Benefits, taxes and social security contributions for projections and counterfactuals are
simulated using the NUI Galway microsimulation model developed for studying the impacts
of an economic crisis (O’Donoghue, Loughrey, & Sologon, 2018). Household benefits ( )
are defined as the sum of household pension income, means-tested benefits and non-means
tested benefits:
= + +
Direct taxes combine income taxes and social security contributions:
= +
These not only transform the distributions of market income into disposable income, but also
allow us to simulate further counterfactual distributions of disposable income under alternative
tax-benefit rules, such as those introduced in response to the pandemic.
4.2 Simulating counterfactual distributions and nowcasting
The IGM estimated in the previous step is used to nowcast the micro-survey data from the most
recent collected data, s (2017), to period (pre-covid, corresponding to December 2019) and
periods + during the COVID-19 crisis corresponding to successive waves of the virus k=1,
2, 3. Wave 1 corresponds to May 2020, wave 2 to November 2020 and wave 3 to January 2021.
Calibration totals utilise administrative data for employment and industry while wage levels
draw upon a quarterly earnings survey. For period s (estimation data), we formalize the IGM
as follows:
{, , }
= , Υ; ( ); ( ); ( )
where:
is household disposable income, a function of:
o is a vector of exogenous individual and household characteristics,
o is the vector of parameter values describing the labour market structure ( ),
the structure of returns ( ) and the tax-benefit rules ( ),
o Υ is a vector of unobserved heterogeneity terms.6
6
Details of the variables used can be found in Appendix AThe income generating process is a statistical representation of the structure of the prevalence and the level of market incomes and their sub-components, combined with the tax-benefit rules converting market incomes into disposable counterparts. This setup allows us to understand how the distribution of a random variable (such as disposable income) as well as any function of interest ( ) (such as inequality indices, quantiles) changed due to the impact of the COVID-19 crisis. 4.3 Nowcasting the distribution to t (pre-covid) and t+1 (wave 1, 2 and 3) The nowcasting component calibrates the simulations resulting from the IGM to external statistics in order to update the data from the most recent available survey data (period ) to the targeted periods (pre-covid) and waves + , = 1,2,3 during the crisis. We follow the nowcasting method applied by O’Donoghue et al. (2020) and explained in detail in O’Donoghue and Sologon (2020, forthcoming). Calibration for logit models is based upon the rank of the + estimated by the model compared with the target number of, for example, those in work generated from near real-time calibration totals. This calibration method is known as alignment and is described in Li and O’Donoghue, (2014). For multinomial logit models of, for example, industry or occupation, + is ranked for each category , with the highest ranks selected until the weighted number of categories are selected. This method has the advantage that it captures more observed heterogeneity than purely random selection, reflecting the fact that certain groups are more likely to be in work. The incorporation of stochastic terms means that we capture unobserved heterogeneity so that, for example, some higher educated are out of work and some lone-parents work. Ranking by alone could result in only those with a high chance being selected. It is thus akin to Monte Carlo simulation but allowing for external totals to be hit rather than merely replicating the observed relationships in the estimation dataset. We implement three transformations: 1. Labour market transformation: The labour market transformation consists of modelling the labour market structure in period s and using the parameter estimates, in conjunction with external labour market statistics, to re-calibrate so that the new simulated labour market structure reflects the targeted period (t or + , = 1,2,3) with respect to the age and gender composition of the probability of being in work, the employment rate, occupation and industry structure, and unemployment. The labour market status and characteristics of all individuals of working age is simulated and captured by a new vector for each time period ( ) reflecting the aligned labour market characteristics with the target period: t or t+k, k=1,2,3. ( ): , Υ; ( ); ( ); ( ) . 2. Returns transformation: The returns transformation involves: (i) first, re-simulating all incomes based on the updated labour market structure using the parameter estimates of the income models for period ; (ii) updating monetary values using income growth indices for earnings differentiated by industry and occupation and CPI indices for the adjustment of remaining incomes.7 The income of all individuals is updated in this way and captured by a new vector ̃ ( )reflecting the aligned incomes with the target period: + , = 1,2,3. 7 The model is linked to 2017 SILC, with an income reference period of 2016, so monetary values are uprated from 2016 levels to 2020 levels.
 ( ): , Υ; ( ); ( ); ( ) .
3. Tax-benefit transformation: The tax-benefit transformation consists of updating the tax-
 benefit rules and the parameters of the system to reflect the target period and applying them
 to the distribution of market incomes obtained in step 2 in order to get the nowcasted
 distribution of disposable incomes at time and + , = 1,2,3:
 , ̃,
 = , Υ; ( ); ( ); ( )
 , ̃,
 = , Υ; ( ); ̃ ( ); ( )
 , ̃, , ̃,
Comparing the two distributions, we obtain the nowcasted change ( − ) in
the distribution of disposable income due to the Covid crisis, taking into account the change in
the labour market structure, in incomes and in tax-benefit rules. We can also evaluate the
counterfactual effect of changing just one of these components (i.e. increased unemployment
with no targeted tax-benefit changes) or of changing the returns structure of women so that
their income distribution follows the male pattern.

4.4 Gender income inequality

In the final stage of the analysis, we compare the distribution of male and female income and
the drivers of the gender gap in income before and after accounting for the impact of the
pandemic. To do this, we incorporate a gender decomposition, developed by Doorley & Keane
(2020), to our simulation. This allows us to show how the pandemic-induced income and
employment shock and the tax-benefit response alter gender income inequality in both market
and disposable income.

4.4.1 Income sharing

Estimating gender income inequality using a population of single individuals is relatively
straightforward. However, taking the complexity of married couple households into account
requires some assumptions about how married couples split their income. Most income
distribution analyses, such as the measurement of inequality using the Gini Index, are carried
out at the household level. The implicit assumption is that household income is pooled so that
all household members enjoy the same standard of living. There is empirical evidence that
households do pool a significant proportion of income, supporting this unitary model of
household behaviour (Watson, Maître, & Cantillon, 2013).
Some empirical and theoretical basis has also been found for non-unitary models of family
behaviour which challenge this approach (Lundberg, Pollak, & Wales, 1997; Cantillon &
Nolan, 2001; Browning, Chiappori, & Lechene, 2010). For example, it has been found that the
recipient of income in a household can strongly influence the distribution of its consumption
(Browning, Bourguignon, Chiappori, & Lechene, 1994; Lundberg, Pollak, & Wales, 1997).
This has implications for the economic independence of individual members of a household as
well as for bargaining power within the household.
In this work, we consider each member of a couple as an individual in terms of their market
income, tax liability and benefit entitlement. We assume that family benefits and household
level benefits are shared equally among members of a couple.8 One exception is Child Benefit,
which we assign to the mother as this is the default payment rule for this benefit. We consider
this individual approach as representing an upper bound of the gender gap in income. It is,
nonetheless, a useful measure which represents potential income (consumption, bargaining,
etc) inequality.
4.4.2 Decompositions

At the core of our analysis lies the gender gap in average market income gap ( ) and the
gender gap in average disposable income ( ), defined as:
 = −
 = −
where , and , stand for nowcasted average market and disposable
income of men and women and are formalized as follows:
 { , ̃}
 = ( ) = ( , Υ; ( ); ( ) )
 { , ̃}
 = ( ) = ( , Υ; ( ); ( ) )
 , ̃,
 = ( ) = ( , Υ; ( ); ( ); ( ) )
 , ̃,
 = ( ) = ( , Υ; ( ); ( ); ( ) ).

Decomposition of the gender gap in market incomes

First, we estimate how the structure of the gender gap in market incomes, = − ,
changed during the course of the pandemic, between t and + , = 1,2,3:.

To this end, we decompose the difference between the nowcasted distributions of market
incomes for men and women, to identify the contribution of differences in labour market
characteristics between men and women (participation, hours and wages, occupational
structure, etc.) and how these have changed during the pandemic.

The decomposition of the difference in average market incomes between men and women can
be formalized as:
 ∗
 − = ∗ − + ∗∗ − + − ∗∗ (1)
 /

where ∗ is the counterfactual average market income of women if women had the labour
market participation, hours and wage structure of men and ∗∗ is the counterfactual market
income of women if women also had the occupational and industry structure of men. ∗ is
obtained by applying the coefficients of the labour market participation, wage and earnings
model for men to women, while retaining the residuals for women, and predicting a
counterfactual market income for women. ∗∗ is obtained by importing in also the coefficients

8
 These include Fuel Allowance, Rent Supplement, Residual Family Allowances, Supplementary Welfare
Allowance, Minor Social Assistance Benefits.
from the occupation and industry models for men and simulating the resulting market incomes for women. Following this logic, the gender gap in market income is decomposed into (1) the contribution of gender differences in wages and labour supply, (2) gender differences in occupation and industry structures and (3) the contribution of all other differences in characteristics/returns between men and women. These other characteristics include gender differences in income due to demographics, non-labour income and, self-employment status. The decomposition is done for each period: t (pre-covid) and t+k (post-covid wave = 1, 2, 3). Decomposition of the cushioning effect of the tax-benefit system By comparing the gap in average market income between men and women ( ) and the gap in average disposable income between men and women ( ), we get the “cushioning” effect of the tax-benefit system on the gender gap in market income in each period: = − . Defining gross income, , as market income plus benefits, the gender gap in gross income is: = − . Defining net income, , as market income net of tax, the gender gap in net income is: = − . can then be further decomposed into the “cushioning” effect of benefits and the “cushioning” effect of taxes. = ( − ) + ( − ) (2) 5. Data Our analysis requires two data sources: (i) microdata for estimating the income generation model and for simulating the distributions of disposable income and (ii) calibration data to align the simulations with the timely changes in labour market and income growth. Our microdata is the 2017 version of the Irish component of the European Union Survey on Income and Living Conditions (EU-SILC). EU-SILC is a representative survey with information on household incomes, labour market characteristics, demographics, and living conditions, typically used for building poverty and inequality indicators for the EU countries. The Irish component relies both on survey and register data. Income information for 80% of the respondents comes primarily from administrative sources linked to the individual’s tax number (PPSN) (Callan, Keane, Walsh, & Lane, 2010). Our analysis uses a set of calibration control totals capturing the evolution of the macro- economic climate in Ireland between 2017 and the COVID-19 crisis. The calibration control totals are drawn from the Labour Force Survey, Live-Register data and official statistics provided by the Irish Central Statistics Office. We describe below the adjustments made to the SILC data in order to simulate the pre-covid period – December 2019- and the three waves of the COVID-19 pandemic: May 2020, November 2020 and January 2021.
Employment rate and sectoral impact

Individuals who have lost their job because of COVID-19 are eligible for a COVID-19
Pandemic Unemployment Payment (PUP), a flat rate non-means tested benefit paid to those
aged 18-66. Unlike traditional jobseekers’ supports, there are no additional payments for
dependents. The changes in the instrument structure over the crisis are captured in our
simulations.

We use the income generation model to simulate the numbers and the type of individuals
affected by the crisis and eligible for the PUP. The overall employment rate, determined by the
number of people in work relative to the population of a particular age group, is first used to
calibrate the simulations from the income generation model. The overall and age-specific
employment rates are drawn from the Labour Force Survey (LFS). However, as a quarterly
survey, there is still a 2-3 month lag between data collection and publication. In order to model
in “real-time” a period of economic volatility such as the COVID-19 crisis, we need even more
timely data.

Given the asymmetric employment shock, with some industries remaining at work and others
closing almost fully during the pandemic, we are confronted with limited “real time” data to
capture the sectoral impact of the crisis. We fine-tune the simulations by relying in addition on
age-specific administrative data from the Live-Register on a monthly basis, together with
weekly updates of their aggregates. Given that the Live-Register data does not reflect the level
of unemployment equivalent to the ILO definition, people could be working part-time while
receiving benefits and conversely, someone could be out of work and seeking work, but not
eligible for unemployment benefits. However, in the short-term, the changes observed in the
Live-Register are a proxy for changes in the numbers out of work (or non-employment rate).
We use the LFS to nowcast to December 2019, and then we use administrative data to nowcast
to May 2020 (wave 1), November 2020 (wave 2) and January 2021 (wave 3).

COVID-19 Infections

Individuals who have to stop working due to a COVID-19 infection or due to having been a
close contact qualify for the COVID enhanced Illness Benefit (CEIB), which is paid at the
maximum PUP rate. In our simulations, both workers and non-workers get infected with
COVID-19. The cases are randomly allocated across in-work and out-of-work based on the
national age distribution of the COVID-19 cases. The recipient rate of the COVID-19 related
illness benefit is obtained by dividing by the proportion of workers in each age group.

Pandemic Wage Subsidy

The Wage Subsidy itself has a limited distributional impact but it shifts the burden of payments
from the private sector to the public sector. In modelling the subsidy, we assume that the sum
of the subsidy component and the employer component remain constant. The subsidy is
simulated parametrically and has changed 5 times over the year reflecting different objectives
and teething problems (O'Donoghue C. , Sologon, Kyzyma, & McHale, 2021). The employer
component is therefore modelled as the residual of the original wage less the subsidy.

 6. Results
We start by looking at the core employment and income statistics by gender and how they
evolved during the course of the crisis (Table 1). As expected, we find lower employment
levels both for men and women during the three waves of the pandemic than before the crisis,
with the largest employment shock recorded during the first wave. Women have lower
employment levels than men in all time periods. At the same time, they also lose less
employment, especially during the first wave of the crisis. During the first wave, the drop in
employment was 27pp for men versus 20pp for women, narrowing the absolute gender gap in
employment. The gender gap in hours of work followed a similar pattern, narrowing slightly
during the first wave. However, the gender gap in hourly wages, which was very small in the
pre-covid scenario, widened during the pandemic. In the pre-covid scenario, male employees
earned an average of €19.20 per hour. This fell to €18.18 in wave one and €17.14 in wave two
before slightly recovering to €17.94 in wave three. The average wage rate for women fell from
€19.01 in the pre-covid scenario to €16.36 in wave one of the pandemic. Female hourly wages
registered a slight recovery after wave one, increasing to €16.82 and €16.66 in waves two and
three. However, in all three waves of the pandemic, the raw gender wage gap for employees is
larger than in the pre-covid scenario. This is likely to reflect the non-random nature of job
losses which are concentrated in particular sectors of the economy such as hospitality,
construction and childcare, as well as asymmetric wage reductions by gender. The result of
changes to employment and wages is that market incomes dropped for men and women, but
the relative gender gap in market incomes was maintained at around 40%-41%.

Table 1 Employment, wages and income pre-covid and during the three waves of the
pandemic
 Men Women
 Pre-Covid Wave 1 Wave 2 Wave 3 Pre-Covid Wave 1 Wave 2 Wave 3
 Employment
 rate 0.79 0.52 0.62 0.61 0.67 0.47 0.54 0.53
 Weekly
 employee
 hours
 (predicted) 31.3 20.5 24.7 24.6 21.2 15.3 17.3 17.2
 Employee
 hourly wage
 (predicted) 19.20 18.18 17.14 17.94 19.01 16.36 16.82 16.66
 Market
 Income 43,047 29,188 32,944 33,224 25,806 17,322 19,865 19,634
 Gender gap in Market Income 40% 41% 40% 41%
 Benefits 5,845 12,166 10,792 10,770 7,100 12,530 11,287 11,305
 Tax + Social
 security 13,076 10,281 11,399 11,356 9,456 7,831 8,401 8,372
 Disposable
 income 35,816 31,073 32,336 32,638 23,450 22,022 22,751 22,566
 Gender gap in Disposable income 35% 29% 30% 31%
Source: Own calculations using the NUI Galway microsimulation model linked to 2017 SILC data nowcasted to
December 2019 (pre-covid); May 2020 (wave 1); October 2020 (wave 2) and January 2021 (wave 3). All
monetary values are annual unless otherwise specified.

The system of taxes and benefits, however, works well to reduce the gender income gap during
the pandemic. After taxes and benefits the gender gap in disposable income is 35% in the pre-
covid scenario. This gap is reduced to 29% in the first wave and 30-31% in the following
waves. Men caught up with women in terms of benefits during the first wave, profiting from
larger relative increases compared to women. This is consistent with the larger drops in
employment experienced by men in the first wave. In contrast, gender differences in taxes paid
seem to have been affected little during the pandemic, with both groups paying less in tax.
Table 2 shows how the components of disposable income change for men and women in the
baseline (pre-covid) and in the three subsequent waves of the pandemic. Pre-covid, annual
market income, which includes earnings; investment income and private pensions, is €43,047
for men and €25,806 for women. This gives a gender gap in market income of 40%. Gross
income, which sums market income and benefits, is higher than market income at €48,892 for
men and €39,906 for women. The absolute difference between male and female gross income
is less than the difference between male and female market income, indicating that benefits
provide some redistribution between men and women. Market income net of tax (which
excludes benefits) is €29,971 for men and €16,350 for women. Finally, disposable income for
men, at €35,816 is 35% higher than the disposable income of women if €23,450. The tax benefit
system cushions the gender income gap by 5 percentage points in the pre-covid baseline.
Looking at the adjusted* and adjusted** scenarios for women indicates how this picture would
change if women (i) supplied labour at the same rate as men and were rewarded for their labour
market characteristics in the same way as men and (ii) if women additionally worked according
to the occupation and industry structure of men. In the adjusted* scenario, the gender gap in
market income falls from 40% to 5% and the gender gap in disposable income falls from 35%
to 7%. In the adjusted** scenario, the gender gap in market income falls further to 2% and the
gender gap in disposable income falls to 4%. In each case, the inclusion of benefits decreases
the absolute gender gap in income. In the baseline, the inclusion of tax also decreases the gender
gap in income while in the adjusted* and adjusted** scenarios, the inclusion of tax increases
the gender income gap slightly. This results in a relative gender gap in disposable income that
is slightly higher than the gender gap in market income for the two adjusted scenarios.
Post-covid, the gender gap in market income is similar in relative terms (40-41% depending on
the wave in question) to the baseline although market income for men and women has
decreased significantly. This reflects the fact that, while average labour supply decreased
relatively more for men (particularly in the first wave), average wages decreased relatively
more for women. However, the gender gap in disposable income is significantly lower in each
wave of the pandemic (at 29-31%) than in the baseline. Benefits reduce the gender gap in
income slightly in each wave but taxation provides much stronger redistribution, reducing the
absolute size of the gender gap in income substantially in each wave. Men, who see relatively
larger decreases in their labour supply, benefit relatively more from the welfare system while
women, who see relatively larger decreases in their average wage, pay relatively less in tax.
The overall effect is in favour of women as the cushioning effect of the tax-benefit system on
the gender gap in income doubles in the pandemic scenarios to 10-12 percentage points,
depending on the wave.
Table 2 Wages, hours of work in income in pre- and post-covid scenarios and in counterfactual scenarios for women.
 Annual
 Employee Weekly Annual Annual market Annual
 hourly hours of market Gender gross income net disposable Gender
 wages work income gap income of tax income gap
 Pre-covid Men 19.20 31.3 43,047 48,892 29,971 35,816
 Women Predicted 19.01 21.2 25,806 40% 32,906 16,350 23,450 35%
 Adjusted* 19.72 32.3 40,800 5% 47,262 26,901 33,363 7%
 Adjusted** 18.98 32.3 42,172 2% 48,610 27,831 34,269 4%
 Post-covid wave 1 Men 18.18 18.2 29,188 41,354 18,907 31,073
 Women Predicted 16.36 15.3 17,322 41% 29,852 9,491 22,022 29%
 Adjusted* 18.66 25.9 32,179 -10% 42,659 20,222 30,702 1%
 Adjusted** 17.76 23.1 30,199 -3% 41,911 18,359 30,071 3%
 Post-covid wave 2 Men 17.14 24.7 32,944 43,736 21,544 32,336
 Women Predicted 16.82 17.3 19,865 40% 31,151 11,464 22,751 30%
 Adjusted* 18.79 27.3 34,132 -4% 44,293 21,699 31,859 1%
 Adjusted** 16.95 26.7 33,086 0% 43,668 20,745 31,327 3%
 Post-covid wave 3 Men 17.94 24.6 33,224 43,994 21,868 32,638
 Women Predicted 16.66 17.2 19,634 41% 30,938 11,262 22,566 31%
 Adjusted* 18.95 27.4 34,323 -3% 44,393 21,937 32,007 2%
 Adjusted** 17.44 26.7 34,014 -2% 44,612 21,401 31,998 2%
Source: Own calculations using the NUI Galway microsimulation model linked to 2017 SILC data nowcasted to December 2019 (pre-covid); May 2020 (wave 1); October
2020 (wave 2) and January 2021 (wave 3).

Notes: The adjusted* scenario adjusts female labour market participation and hours to represent the male structure and adjusts female wages so that they are paid
according to the male wage structure. The adjusted** scenario additionally adjusts the occupation and industry structure of women so that it follows that of men. Gross
income = market income + benefits. Market income net of tax = market income-tax-social security.
These results can be visualised more clearly in Figures 5 and 6.9 We explore first how the
structure of the gender gap in market incomes evolved during the course of the COVID-19
crisis. Figure 5 decomposes the gender gap in market income into the contribution of gender
differences in wages and labour market participation and hours, gender differences in
occupation and industry structures and the contribution of all other differences in
characteristics/returns between men and women.10
Figure 5. The components of the gender gap in market income

 The components of the gender gap in market income
 20,000

 15,000

 10,000
 Annual income

 5,000

 0

 -5,000
 Pre-covid Post-covid wave 1 Post-covid wave 2 Post-covid wave 3
 Gender work/wage gap Occupational segregation Other Market income gap

Source: Own calculations using the NUI Galway microsimulation model linked to 2017 SILC data nowcasted to
December 2019 (pre-covid); May 2020 (wave 1); October 2020 (wave 2) and January 2021 (wave 3).

Notes: The gender work/wage gap, occupational segregation gap and other gap correspond to the three terms
in equation 1 in Section 4.3.2

During the COVID-19 crisis the absolute gender gap in market incomes dropped compared to
the pre-covid period. The largest drop in the absolute gap was recorded during the first wave,
followed by a slight increase in the wave 2/3. In relative terms, the gender market income gap
was stable at around 40-41% (men=reference). The structure of the gap, however, changed.
We find an increase in the relative contribution of the gender differences in labour market
participation, hours and wage structure, counterbalanced by a negative contribution of gender
differences in the occupation and industry structure. In other words, labour market
participation, hours and wage differences between men and women contributed more to gender

9
 See also Table B1 in Appendix B
10
 These include gender gaps in self-employment probability and income; gender differences in non-labour income
and demographic differences unrelated to labour supply; occupation or industry.
income gaps during the crisis: women would have lost less during the crisis had they had the
labour market participation, hours and returns of men. On the other hand, gender differences
in the structure of occupation and industry benefitted women: had their occupations been
distributed similarly to men’s, women would have recorded higher losses in market incomes.
This finding is consistent with conclusions made by Alon et al (2021) that occupation and
industry structure played a major role in determining unequal impacts of the crisis by gender.
In the case of Ireland, the gender division of occupation and industry actually benefitted
women. Their representation in essential roles outweighed their representation in locked-down
roles.
We explore next the cushioning effect of the tax-benefit system on the gender income gap by
taking the difference between the gender gap in market income and the gender gap in
disposable income, similar to Doorley and Keane (2020). Figure 6 illustrates the cushioning
effect of the tax-benefit system during the course of the pandemic, isolating the contribution of
benefit policy from the contribution of tax policy.
Figure 6. Cushioning effect of taxes and benefits

 Cushioning the gender income gap: tax and benefits
 20,000

 15,000

 10,000
 Annual income €

 5,000

 0

 -5,000

 -10,000
 Pre-covid Post-covid wave 1 Post-covid wave 2 Post-covid wave 3
 Axis Title

 Benefits Tax Market income gap Disposable income gap

Source: Own calculations using the NUI Galway microsimulation model linked to 2017 SILC data nowcasted to
December 2019 (pre-covid); May 2020 (wave 1); October 2020 (wave 2) and January 2021 (wave 3).

Notes: The cushioning effect of the tax and benefit systems correspond to the terms in equation 2 in Section 4.3.2.

Before the Covid-19 crisis, both taxes and benefits were contributing towards cushioning the
gender gap in income, although taxes were playing a larger role. However, during the
pandemic, most of the cushioning role was taken over by tax policy. As Table 1 shows, benefit
receipt by men and women is roughly similar in the three waves of the pandemic although it
was relatively higher for women in the pre-covid scenario. While women were
disproportionately benefiting from the welfare system prior to the crisis, the scale of job loss
and the introduction of flat-rate, non-means tested benefits for the newly unemployed means
that men are benefitting from the welfare system at the same rate as women during the
pandemic. The effect of benefits on the gender income gap is lower, the stronger the shock
(e.g. wave 1). There are two consequences of this: firstly, although the tax-benefit system
provides less cushioning in absolute terms than before the crisis, the relative effect is larger.
Women’s disposable income is actually higher than their market income, on average, during
the crisis, reflecting the generous nature of the new pandemic income supports. Men’s
disposable income is lower than market income, on average, although not by as much as it was
in the pre-covid scenario. Second, the taxation system is doing most of the heavy lifting in
terms of redistribution between men and women during the pandemic. Men’s market income
remains higher than women’s, although they suffer slightly higher loss of employment, so men
continue to pay systematically more tax than women.

 7. Discussion

This paper investigates the effect of three waves of the Covid-19 pandemic on gender income
inequality in Ireland. Using a nowcasting technique linked to a decomposition framework, we
show the drivers of gender income inequality in Ireland just prior to the Covid-19 pandemic
and how these have changed over the course of the pandemic.
Job losses were more concentrated among men during the first wave of the pandemic. As in
the case of the financial crisis, employment in white collar, professional employment proved
to be more resilient than for men, while blue-collar more manual work was less robust.
However, when the construction sector was allowed to remain open in later waves of the
pandemic, this differential disappeared.
Average wages of men and women were very similar prior to the pandemic but these decreased
more among women than men during the first wave of the pandemic. This may reflect selection
among those who remained in employment during the crisis but might also reflect higher
scarring of female wages than of male wages. Wage effects were more similar by gender in
subsequent waves of the pandemic.
The overall effect of employment and wage changes was that market income decreased by
similar relative amounts for men and women and the gender gap in market incomes remained
stable at 40%. However, the composition of the market income gap shifted during the
pandemic. While the main source of this gap, labour supply and wage gaps, remained stable,
there was a shift in the contribution of occupational segregation. Prior to the pandemic,
occupational segregation contributed positively to the gender income gap as men were
disproportionately working in high-income occupations and industries. This reflects traditional
gender stereotypes in specific industries and professions that limit opportunities for women.
The structure of job and earnings loss during the pandemic has reversed this, with women’s
occupation and industry structure currently providing them with an earnings advantage. This
finding warrants monitoring as the economy recovers.
Prior to the pandemic, the tax-benefit system was reducing the gender income gap from 40%
to 35%. However, its cushioning effect doubled during the pandemic. Men benefitted relatively
more than women from welfare, due to their higher employment losses and the flat and non-
means tested nature of new supports. However, taxation policy continued to automatically
redistribute between men and women with the result that the cushioning effect of the tax-
benefit system on the gender income gap increased. Tax as an automatic stabiliser provided
very important redistribution between men and women during the pandemic.
These results highlight the impact of a number of long-term trends in the Irish labour market
that impact underlying gender differences in income. Firstly, the gender gap in income is driven
to a greater extent by hours worked and labour force participation than by wage differences.
High childcare costs are particularly relevant to this issue. Although the labour force
participation rates and hours of work for men and women have somewhat converged since the
1980’s there remains a larger gap after childbearing. Further reducing the gender gap in income
will require improved policies both to enable work-life balance to support child rearing,
education policies that reduce the growing gap in educational outcomes between men and
women and challenges to gender stereotypes. Continued monitoring of the evolution of the
gender income gap as the Irish economy recovers will indicate if the pandemic has harmed or
bolstered progress made to date.
You can also read