The Crisis and Job Guarantees in Urban India - IZA DP No. 13760 OCTOBER 2020 Swati Dhingra Stephen Machin - Institute ...
←
→
Page content transcription
If your browser does not render page correctly, please read the page content below
DISCUSSION PAPER SERIES

IZA DP No. 13760

The Crisis and Job Guarantees in Urban
India

Swati Dhingra
Stephen Machin

OCTOBER 2020
DISCUSSION PAPER SERIES

IZA DP No. 13760

The Crisis and Job Guarantees in Urban
India

Swati Dhingra
London School of Economics and CEPR
Stephen Machin
London School of Economics, CEPR and IZA

OCTOBER 2020

Any opinions expressed in this paper are those of the author(s) and not those of IZA. Research published in this series may
include views on policy, but IZA takes no institutional policy positions. The IZA research network is committed to the IZA
Guiding Principles of Research Integrity.
The IZA Institute of Labor Economics is an independent economic research institute that conducts research in labor economics
and offers evidence-based policy advice on labor market issues. Supported by the Deutsche Post Foundation, IZA runs the
world’s largest network of economists, whose research aims to provide answers to the global labor market challenges of our
time. Our key objective is to build bridges between academic research, policymakers and society.
IZA Discussion Papers often represent preliminary work and are circulated to encourage discussion. Citation of such a paper
should account for its provisional character. A revised version may be available directly from the author.

                                                     ISSN: 2365-9793

                                           IZA – Institute of Labor Economics
Schaumburg-Lippe-Straße 5–9                      Phone: +49-228-3894-0
53113 Bonn, Germany                             Email: publications@iza.org                                    www.iza.org
IZA DP No. 13760 OCTOBER 2020
ABSTRACT
The Crisis and Job Guarantees in Urban
India*
This paper uses a new field survey of low-wage areas of urban India to show that
employment and earnings were decimated by the lockdown resulting from the Covid-19
crisis. It examines workers’ desire for a job guarantee in this setting. Workers who had a
job guarantee before the crisis were relatively shielded by not being hit quite so hard in
terms of the increased incidence of job loss or working zero hours and earnings losses. A
stated choice experiment contained in the survey reveals evidence that low-wage workers
are willing to give up around a quarter of their daily wage for a job guarantee. And direct
survey questions corroborate this, with informal, young and female workers being most
likely to want a job guarantee, and to want it even more due to the current crisis.
JEL Classification: J46, J68, L52, P25
Keywords: job guarantee, India, urban labour markets, job vignettes,
COVID-19
Corresponding author:
Stephen Machin
Centre for Economic Performance
London School of Economics
Houghton Street
London, WC2A 2AE
United Kingdom
E-mail: s.j.machin@lse.ac.uk
* We thank Shania Bhalotia, Pranav Chaudhary, Maitreesh Ghatak and Fjolla Kondirolli for excellent suggestions
and comments. Financial support from the ESRC and from the ERC Starting Grant 760037 is gratefully acknowledged.
The primary survey was reviewed and approved by the LSE Research Ethics Committee (REC Ref. 1129).1. Introduction
Job guarantee schemes have had a long history in public debate and have recently been
proposed and introduced in various contexts, including in the United States by high-profile politicians
Bernie Sanders and Alexandria Ocasio-Cortez, in the United Kingdom by former Prime Minister
Gordon Brown and advocated by economists in public policy debates.1 The world’s largest job
guarantee programme is in India. The Covid-19 pandemic has put it at the centre of growing discussion
over policies to recover from the ravages of the crisis, particularly in urban areas at the “frontlines of
the pandemic”. The ILO has pointed to the risks faced by informal workers in developing economies,
many of who have been directly affected and others whose jobs are at greater risk due to the lockdown
(ILO, 2020).2
Informal work, including causal, temporary and subcontracted work, is a defining feature of
urban labour markets in many developing countries and more recently of the “new informality”
appearing in developed countries (World Development Report, 2019; Boeri et al., 2020). While certain
relief packages have been put forward under Covid-19 for informal workers, measures that are needed
to prevent a permanent deterioration in work and living standards are under debate. This paper evaluates
and quantifies the value of a job guarantee to workers in this setting.
India typifies concerns over urban labour markets in developing economies. Even before the
pandemic, Periodic Labour Force Survey (PLFS) microdata from 2017-18 shows labour force
participation rates were low (48 percent) and the workforce was largely informal. Regular wage/salaried
employees make up less than half of the urban workforce (48 percent in 2017-18), and the rest do their
jobs in a hinterland of casual work and outsourced contracts. Even among regular employees, only 27
percent have a written employment contract. A little over half have access to some benefits (provident
funds, sick pay, and health insurance) through the government or their employer. Old and new forms
of informality therefore persist, leaving many without basic social protections.
1
See Gregg and Layard (2009) on UK’s job guarantee programme, Stiglitz (2019) on India’s rural job guarantee
as a broader policy lever and Blanchard and Rodrik (2019) on job guarantees as a policy tool for addressing
inequality.
2
https://news.un.org/en/story/2020/04/1061322
1Like many developing economies, India has a young workforce - 62 percent are under 40 and
most are in informal employment. Growing urbanisation and an even faster-growing young workforce
pose massive challenges in developing economies and the pandemic has only acted to intensify them.
There is limited work on urban labour markets in developing economies, and even less on active labour
market policies in these settings (recent examples are Alfonsi et al., 2020; Banerjee and Chiplunkar,
2018; or Menzel and Woodruff, 2020). Existing evidence nonetheless shows that labour market
imperfections are widespread and precarious jobs have not proven to be a stepping stone to better
employment for young workers (Abebe et al., 2018).
India had one of the strictest national lockdowns to contain the spread of Covid-19 (Hale et al.,
2020). It came into effect on March 24, 2020 and lasted till at least mid-May. Millions of workers in
urban centres saw their work come to an abrupt halt. Many who had migrated to these areas for work
were stranded without any source of income. The estimated unemployment rate tripled during lockdown
(Vyas, 2020) and GDP fell by 23.9 percent in the second quarter of 2020. These big disruptions have
continued to be felt widely, and recovery policies are being debated to address the livelihood crisis. Yet
there is limited understanding of the actual impacts and the recovery policies that would be most
effective. Regular data collection has suffered due to the pandemic and much of the analysis till now
has needed to rely on projections based on pre-Covid data (see Alon et al. 2020; Bircan et al., 2020; or
Gottlieb et al. 2020). Even less well-understood are the impacts on young and informally employed
individuals, especially in low-income urban areas, who are most at risk of experiencing scarring effects
from long-term unemployment (Machin and Manning, 1999).
To understand labour market impacts of the pandemic, this paper presents results from a survey
of a random sample of over 3,000 workers aged 18 to 40 in low-income areas of urban India. It shows
that Covid-19 decimated economic livelihoods in these areas. This is in line with recent work on the
labour market impacts of the pandemic in developed economies (Adams-Prassl et al., 2020; Blundell
and Machin, 2020; Coibion et al., 2020) where workers were hit hard. But the scale of the hit to Indian
workers is an order of magnitude greater. About a quarter of workers lost their job, just over 9 percent
more were not working any hours and many more were not being paid as earnings fell by 85 percent,
on average, under lockdown. This is consistent with some of the findings from other recent data
2collection efforts which find large earning losses in various parts of India (see, for example, Afridi et
al., 2020; Barboni et al., 2020; Bhalotia et al., 2020; Kesar et al., 2020; or Lee et al., 2020) and in other
developing economies for which recent data are available (see Bandiera et al., 2020, for villages and
slums in Bangladesh; Jain et al., 2020, for South Africa; or Mahmud and Riley, 2020, for rural Uganda).
Having shown the scale of these employment and earning losses caused by the pandemic, the
paper moves on to examine job guarantees, which are being considered as an active labour market
policy that could assist economic recovery in urban places. India already runs the world’s largest jobs
programme under its Mahatma Gandhi National Rural Employment Guarantee Act (MGNREGA),
which entitles rural households to demand a 100 days of work a year from the government. A few state
governments have introduced an urban equivalent of MGNREGA, though budgets are relatively small.
The central government has recently announced plans for an urban job guarantee in small towns and
cities to address the crisis (NDTV, 2020). Proposals to operationalise it range from wage subsidies for
employers to direct employment by public institutions (Kulkarni and Ambasta, 2020; Dreze, 2020).
A large literature has examined India’s existing rural employment guarantee scheme
(Sukhtankar, 2017, Ravallion, 2019), but there remains a dearth of knowledge on labour market policy
in urban labour markets. While agriculture and the rural job guarantee have provided some respite in
villages during the crisis, low-income individuals working in urban areas have seen little assistance. An
urban job guarantee has scope to help these workers recover economically from the pandemic. Its self-
targeting feature can be expected to be effective in identifying individuals who are being pushed into
urban poverty and who would not normally be covered under poverty alleviation programmes (see
Besley and Coate, 1992). Yet little is known of the extent to which workers would value a guarantee of
work.
The survey was specifically structured to examine how presence of a job guarantee affected the
employment and earnings impacts of the lockdown and how much workers are willing to pay for a job
guarantee at work. On the first of these, and importantly, the big labour market losses that resulted from
the crisis were strongly mediated for workers who had a job guarantee before the crisis. They were
relatively shielded by not being hit quite so hard in terms of the increased incidence of unemployment
or working zero hours and earnings losses.
3Evidence on the second question, valuing a job guarantee, comes from a discrete choice survey
experiment that elicited preferences and willingness to pay for a guarantee of a hundred days of work
from random variations in wages offered for jobs with and without a job guarantee. The experiment
builds on prior research in labour economics, where there is a long tradition of using these kinds of
survey questions to elicit worker preferences for non-pecuniary job attributes. For example, Farber
(1983) draws on hypothetical employment survey questions to separately identify frustrated demand
for unions from a lack of desire for a union job. A more recent, growing literature goes further to
determine the valuation of non-pecuniary benefits and costs through experimental designs in surveys
(for example, Datta, 2019; Eriksson and Kristensen, 2014; Mas and Pallais, 2017, 2019; and Wiswall
and Zafar, 2018).
The findings from the experiment show that, despite the crisis resulting in large numbers of
workers not working and many experiencing staggeringly high earnings losses, there is a sizable
willingness to pay for a job guarantee among workers who did not have one before the C19 induced
lockdown. Low-wage workers are willing to give up around a quarter of their daily wage for a job
guarantee. And other survey questions corroborate this significant valuation, with informal, young and
female workers being most likely to want a job guarantee, and to want it even more due to the current
crisis.
2. Survey Design and Data Description
The survey was conducted between 14 May and 8 July 2020, with the aim of understanding the
impact of Covid-19 on work in urban areas. India offers a unique setting for its large informal
workforce, young population, restrictive lockdown and policy relevance for job guarantees. The survey
was designed to understand the experiences of younger individuals, aged between 18 and 40, who are
over-represented in informal jobs and at most risk of scarring effects from long-term unemployment
that would arise under a weak recovery from the pandemic.
The survey was conducted on a random sample of over 5,500 individuals from fifty low-income
urban ward clusters in each of the three states of Bihar, Jharkhand and Uttar Pradesh. These are some
of the poorest states in India with many areas closer in poverty levels to those in sub-Saharan Africa
4(Global Multidimensional Poverty Index Report, 2018). Lists of individuals were collected from field
visits to local markets and local businesses (providing essential goods and services) during opening
hours. Face-to-face interviews were not feasible due to lockdown restrictions. A random sample of 30
individuals per ward cluster were therefore interviewed by phone. The survey was primarily
administered in Hindi by trained enumerators. English translations were available as needed.
The survey collected information on employment status and earnings of employed individuals,
covering 3045 employees or informal individuals who were in work before lockdown. They form the
relevant group for studying Covid-19 impacts and job guarantees (see Appendix Table A1 for more
detail on sample selection). Just over a third were employees in private businesses, co-operative
societies or trusts while the rest were informal workers, including casual workers (e.g. daily labourers),
those employed by private households (e.g. cooks, cleaners) and those employed by a single private
individual (e.g. personal driver).
The survey builds on and extends previous surveys on Alternative Work Arrangements in
various countries including Germany, Italy, the United Kingdom and the United States (Adams-Prassl
et al., 2020; Boeri et al., 2020, Datta 2019). It contains standard questions on demographics, earnings
and employment and questions on alternative work arrangements and job guarantees, which are usually
not covered in detail in labour force surveys or real-time data sources. The job guarantee questions are
framed as a guarantee of a minimum number of days of work during the year. This is motivated by two
key reasons. First, India’s MGNREGA guarantees a 100 days of work to rural households seeking work
from the government. Examples and proposals of an urban job guarantee also take similar forms (for
example, Madhya Pradesh’s experimental urban job guarantee scheme for young marginalised workers
and the State of Working India (2018) proposal for a national urban employment guarantee). Second,
daily wages are a standard payment form and minimum wage laws in India specify a daily wage rate.
The job guarantee part of the survey instrument includes direct survey questions on whether the
individual would like a job guarantee and whether Covid-19 altered that choice. To provide a
quantification of their preferences in monetary terms, it conducts a job choice randomised experiment
using a vignettes research design, where workers choose between two jobs that are identical in all
respects except one offers a job guarantee at a wage that is randomly reduced relative to another job
5which offers no guarantee. The non-experimental and experimental questions about desire for a job
guarantee are:
i) Would Like Job Guarantee - Would you like a guarantee of at least 100 days of work in the year?
ii) More Likely to Want Job Guarantee Due to Corona Lockdown - Has the Corona lockdown made you
more or less likely to want a job which has a work guarantee of 100 days in the year?
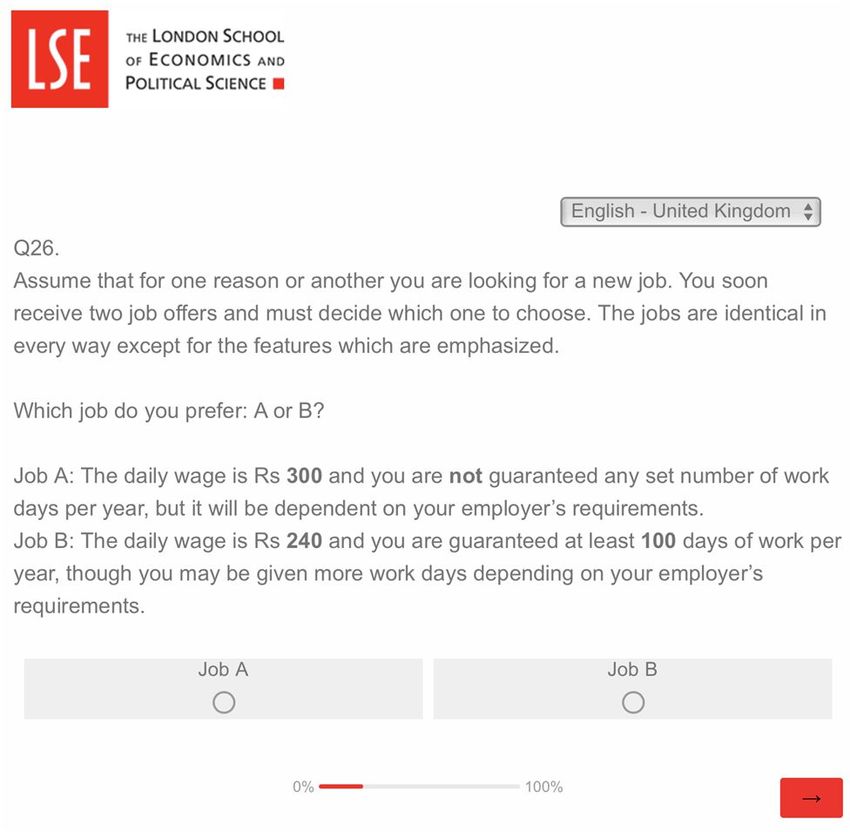
iii) Choice Experiment. Assume that for one reason or another you are looking for a new job. You soon
receive two job offers and must decide which one to choose. The jobs are identical in every way except
for the features which are emphasised. Which job do you prefer: A or B?
The first question on whether workers would like a job guarantee refers to workers’ baseline
employment. The second question refers to whether desire for a job guarantee has changed before and
after lockdown, and the change nature of the question also fixes other job attributes (such as job type,
work scheduling, amount of work). The choice experiment holds all job attributes constant except the
wage-guarantee profile. The Usual Wage in the choice experiment is obtained from the daily wage in
pre-Covid employment and the Markdown on Usual Wage is randomly assigned from a zero percent
markdown up to 40 percent. (See Appendix Table A1 for details, including a visual representation of
the job vignettes, as it appears on enumerators’ screens).
3. Labour Market Outcomes during the Lockdown
This section begins with a description of the prevalence of job guarantees in the labour market,
then moves on to study differences in employment and earnings outcomes for workers who did or did
not have a job guarantee in their pre-Covid employment.
Who has a job guarantee?
Exhibit 1 presents the shares of workers that have a job guarantee in work by various
demographic and job characteristics. 17.5 percent of all workers had a guarantee of a minimum number
of days of work in a year. Employees were more likely to have a job guarantee (22.3 percent) than
informal workers (15.9 percent). Younger and more educated workers (with educational attainment
higher than 10th standard) were more likely to have a job guarantee. And female workers were more
likely than male workers to have a job guarantee, if they were informally employed. The job guarantees
6are primarily provided by employers (24.6 percent) and job contractors or temporary agencies (36.6
percent), others a consequence of workers having a side business of their own or in their family and
workers having rural domicile making them eligible for the rural job guarantee.
Exhibit 1 also shows that urban areas which continued to see a partial or complete lockdown,
after the strict national lockdown ended on 3rd May, had higher shares of workers with job guarantees.
This is unsurprising as larger towns and cities were more likely to remain under an extended lockdown
and these areas also have more formal job opportunities. Workers, who were in jobs where a greater
share of tasks could be done from home, were also more likely to have a guaranteed number of days of
work. This is true for both employees and informal workers. These pre-lockdown differences raise
interesting questions about how lockdown may have affected work differently for those with and
without a job guarantee.
Do employment and earnings impacts of the crisis differ by whether workers have a job guarantee?
Exhibit 2 shows summary statistics to offer an initial descriptive analysis of the employment
and earnings impacts. It does so by comparing before and after lockdown outcomes across all workers
and between those who did and did not have a job guarantee before the pandemic. Workers were asked
to report their employment status in the week before the survey. Panel A shows that almost a quarter of
workers, who all had a paid job before the pandemic, lost their jobs during the lockdown. This
unemployment rate however masks the true level of worklessness that arose from the pandemic.
Another 9.4 percent of workers, who continued to be employed, reported working zero hours in the
week before the survey. Consequently, the urban rate of not working ticked up to a huge 33 percent.
Panel B of Exhibit 2 shows staggeringly large earning losses experienced by urban workers.
While many countries have put in place generous furlough provisions, India did not and so differs in
that urban workers experienced a decimation of their economic livelihoods. April is the only full month
of the strict national lockdown in India. Comparing average monthly earnings of workers in January-
February to those in April, urban workers saw their earnings fall by an enormous 85 percent, on average.
This obviously includes a sizable number of people who were not paid despite having a job. Panel C
shows that those who continued to be “in work” saw a slightly smaller – 81 percent - drop in earnings
7on average. Those who did get paid something during the time naturally saw much smaller earnings
losses; less than a quarter of their pre-Covid earnings were lost, as shown in Panel D.
The Table also makes it clear that workers who had a job guarantee in their pre-Covid
employment were protected from both job and earning losses. Even though workers without a job
guarantee had higher earnings before the pandemic, they were 9.5 percentage points more likely to be
out of work, either through job losses (3.4 percentage points higher) or through zero hours at work (6.2
percent more likely). They suffered much greater earning losses – Rs 7,000 monthly or 87 percent of
average pre-Covid earnings, compared with Rs 5,550 monthly or 75 percent of their pre-Covid earnings
for workers who had a job guarantee. Being in work or getting paid did not alter this pattern of higher
earning losses for workers lacking a job guarantee. Their losses if in work were 83 percent compared
to 70 percent for workers who had a job guarantee and 25 percent compared to 15 percent for those who
got paid.
Statistical estimates
Exhibit 3 presents a more systematic analysis of employment and earnings losses. For worker
, the change in employment and earning outcomes can be defined as ∆ =( − ) , with Y being
the relevant labour market outcomes and the 1 and 0 subscripts respectively referring to post-lockdown
and pre-lockdown time periods. These can be related to whether the worker had a job guarantee ( ) and
other variables (described below) in the baseline through the following regression:
∆ = + + + + (1)
The main estimand of interest in (1), , therefore estimates differences in post-Covid
employment and earnings outcomes across workers that had a job guarantee in their pre-Covid job
compared to those that did not conditional upon which demographic/job ( ) and lockdown ( )
independent variables are included (ε is an error term).
Demographic/job pre-crisis variables include age in years, an indicator for female workers, an
indicator for education lower than 10th standard, and an indicator for informal workers. Pre-lockdown
characteristics are measured as the location of the workplace and the ability to work from home in pre-
Covid jobs. After the strict national lockdown ended in early May, a more targeted approach was taken
8so that some level of normal activity could resume. The country was divided into zones according to
the number of confirmed cases to identify infection hotspots. Green zones were allowed to resume most
activities that had been restricted during lockdown. Orange zones, red zones, buffer zones and
containment zones were more restrictive in terms of the types of activities that were allowed to resume.
To account for differences in the lockdown intensity, an indicator for whether pre-lockdown workplaces
were located outside of a green zone is included. Lockdown restrictions might be less important for
employment outcomes of workers who were able to do some share of their work tasks from home.
Accordingly, an indicator for the worker’s ability to work from home is included to account for
differences in lockdown exposure (Dingel and Neiman, 2020). Further, to account for time-invariant
differences across locations, state and big city fixed effects were included (Table A1 of Appendix).
Exhibit 3 shows a range of estimates of equation (1). The upper panel examines employment
losses from Covid, reporting equations for job loss, zero hours and not working with demographic/job
variables included (specifications (1), (3) and (5)), and then additionally including the lockdown
variables (specifications (2), (4) and (6)). The lower panel reports analogous specifications for earnings
losses, also including pre-lockdown earnings to control for scale effects. To assess how the large
estimated job guarantee raw mean differences presented in the earlier descriptive analysis are affected
by inclusion of the two sets of independent variables, the coefficients on the job guarantee dummy
variable can be directly compared to the numbers in Exhibit 2.
Those raw differences remain largely unaffected by the inclusion of demographic and lockdown
characteristics and, if anything become slightly larger in magnitude (in absolute terms). Having a job
guarantee before the pandemic reduced the probability of job loss by a sizable 5 percentage points. It
also reduced the chances of being on zero hours by 6.6 percentage points and of not working by 11.6
percentage points. Workers without a job guarantee experienced much bigger earning losses, with the
full sample losing between Rs 929 and Rs 984 (specifications (7) and (8)) on average. The earning loss
protection from a job guarantee is also seen for those who continued to be in work (specifications (9)
and (10)), but loses statistical significance for those who got at least some pay during the lockdown
(specifications (11) and (12)).
9The and coefficients are also of interest in their own right, in particular in how the
lockdown variables themselves impact on employment and earnings, and how their inclusion affects
the estimated coefficients on the demographics. Exhibit 3 reveals worse employment effects for younger
and relatively educated workers, but no such impact on earnings losses, with the exception of the group
with at least some pay. Younger workers within the latter group suffered bigger losses of earnings.
There are no marked differences between men and women. Informal workers do better on employment,
with far fewer working zero hours, but they take a big hit on experiencing higher earnings losses.
The lockdown variables enter the employment and earnings equations as one would expect if
they act as a supply shock induced by the lockdown. People who are able to work from home are
strongly insulated against employment and earnings losses and those employed in workplaces that were
located in areas outside green zones suffered more in terms of work and earnings. But, as already noted,
the employment and earnings protection from the job guarantee remains robust to their inclusion.
Additional lockdown variables, namely industry and firm size, were also included to account for
differences in lockdown restrictions across industries and labour law differences across firms (Appendix
Table A2). Their inclusion does not alter any of the key results. The only difference of note arises from
the coefficients on the lockdown zone losing some precision. The job guarantee results remain intact
and, if anything, are a little stronger.3
4. The Value of a Job Guarantee in the Crisis
The previous section presented strong and robust evidence that workers who lacked a job
guarantee before the C19 pandemic hit, experienced larger employment and earning losses on
lockdown. The pandemic has spread further in India and the economy is taking time to recover. There
are concerns that many workers will continue to face economic hardship, especially in sectors that
remain more shut down, and that in the absence of a policy response will be placed on a trajectory
heading towards long term worklessness.4 New policies, primarily an urban job guarantee, are therefore
3
For example, in specifications (11) and (12), the magnitude (in absolute terms) of the earnings loss reduction
from having a job guarantee rises and the coefficient regains statistical significance (at the 5 percent level).
4
The survey also asked about expectations in the next three months. Respondents showed a large degree of
pessimism overall, as 80 percent of workers expected to lose their current job, be working for fewer hours or
10being considered at local, state and central levels to prevent a new set of previously employed workers
from being pushed into urban poverty. As these debates progress, better understanding is needed of the
value, if any, that workers place on having a job guarantee.
Do workers value a job guarantee?
The survey design enables several pieces of evidence to be harnessed on the extent to which
workers value a job guarantee. The first comes from a job guarantee discrete choice experiment
implemented in the primary survey of workers. The vignettes approach it adopts has been widely used
in studies of compensating differentials and provides a benchmark for evaluating the value of non-
pecuniary job attributes (see, for example, Viscusi and Aldy, 2003; or Mas and Pallais, 2017, 2019). It
is particularly suited to valuation of a job guarantee, which is a well-defined job attribute that people
understand.
In the stated preference experiment, workers were offered a choice between two jobs, one at
their usual wage rate without any number of guaranteed days of work per year and the same job at a
lower wage rate but with a guarantee of a minimum hundred days of work per year. The jobs are
otherwise identical, and they differ only in these wage-guarantee dimensions. The wage offered under
the job guarantee equals (1- Markdown/100) × Usual Wage, where the Markdown on wages is
randomly generated from integer values [0, 40]. To fix ideas through an example, an individual who
has a usual wage of Rs 300 a day and who gets a random draw of 20 for the markdown would be offered
a wage of Rs 240 a day under the job guarantee.
There are at least two key advantages of using this kind of experiment to quantify the value of
a job guarantee. A first advantage is that it provides a monetary value that goes beyond qualitative
measures, and does so by posing a counterfactual scenario with which to compare the job guarantee. A
second advantage is that alternative ways of quantifying could be biased and hypothetical data can
address some of those concerns. Typically, Willingness To Pay (WTP) parameters can be estimated
with observational job choice data. These could be biased if omitted non-pecuniary benefits and costs
continue to be unemployed, whilst the other 20 percent either said their job would be unaffected or prospects will
improve. There was less pessimism for those with a job guarantee at 68 percent on things worsening as compared
to 82 percent amongst those without a job guarantee.
11associated with a job are related to the observed job attributes, for example, to earnings through
compensating differentials. Another source of bias would be if employers choose the set of jobs
available to workers, which seems to be an important feature in studies of the gig economy, and in
which case the estimated parameters reflect employer requirements or discretion rather than job
preferences of workers. Hypothetical experiments avoid some of these issues - the trade-off between
non-pecuniary and pecuniary attributes is explicitly made and the job choice set is given randomly by
the experiment for the attribute under consideration. This minimizes concerns regarding correlation of
job characteristics with unobserved tastes (see Wiswall and Zafar, 2018, and Appendix).
Exhibit 4 presents a graphical exposition by plotting the proportion choosing the job guarantee
option against the randomly allocated wage markdown offered to survey respondents in the choice
experiment. The Figure is drawn for the set of workers who do not have a job guarantee at work (2,512
of them), as this is the key group of policy interest. The x-axis is the negative Markdown/100 that is
randomly assigned to individuals and ranges at 0.01 intervals between -0.4 to 0. (Appendix Table A3
contains randomisation tests by key demographic characteristics). The y-axis is the proportion of
workers who chose the job guarantee offer over the job with a higher wage and no guaranteed days of
work, holding all other job attributes fixed. The scatter plot and the fitted line reveal a downward slope
that shows Indian urban workers are willing to take a wage cut to obtain employment with a job
guarantee.
Workers’ marginal WTP for a guarantee can be calculated from the logit estimates that underpin
the line shown in the Figure. The WTP measure is derived from the estimated coefficients of this logit
regression of whether an individual chooses the job guarantee offer on the randomly assigned wage
markdown. The median (and mean for the case of a logit) WTP percentage is the ratio of the estimated
constant coefficient to the coefficient on the wage markdown ([( / ) × 100] in the notation of the
the Appendix exposition). For all workers without a job guarantee, the median willingness to pay is
estimated to be 25.5 percent, showing that workers are willing to take a fairly sizable wage cut for a
guarantee of 100 days of work.
Exhibit 4 also reveals that, whilst a sizable majority near 70 percent do, not all workers offered
a job guarantee even at a zero wage reduction choose the position with a job guarantee. There are various
12reasons why this might be, like stigma being associated with guarantees or inability to work in the types
of jobs that have one. This was explored in the survey by asking people who said they would not like a
job guarantee why that was their response. They either said they do not need it (56.4 percent), have
domestic commitments that prevent them from taking one (24.1 percent and mostly dominated by
female workers), would want to do other types of work (16.4 percent), are a student (4.6 percent) or are
ill or disabled and unable to take one (1.7 percent). Informal workers, who do not want a job guarantee,
are more likely to not need one (60.7 percent v 56.4 percent for employees) and less likely to be students
(2.2 percent v 10.1 percent for employees).5
Demand for a job guarantee from experimental and non-experimental evidence
Exhibit 5 systematises the WTP analysis in more detail, together with other estimates of desire
for a job guarantee from different (non-experimental) questions asked in the survey. Columns (1) and
(2) show the estimated willingness to pay for a job guarantee as a percentage and in Rupees at the usual
median daily wage for different groups of workers. As already noted in the discussion of the Figure in
Exhibit 4, the median willingness to pay for a job guarantee is 25.5 percent of usual wages across all
workers. This corresponds to Rs 81 daily.
The survey design also elicited direct responses to questions about whether workers who did
not have a job guarantee would like one, and whether their experiences under lockdown changed
whether or not they would like a job guarantee. Responses to the direct survey questions on wanting a
job guarantee, shown in columns (3) and (4), align well with the experiment - 76.8 percent of workers
without a job guarantee say they would like a guarantee of at least 100 days of work in the year.6 As
depicted in columns (5) and (6) the pandemic has made over a third of workers more likely to want a
job which has a guarantee of a hundred days of work in the year.
Preferences for a job guarantee are likely to vary across demographic groups. As the markdown
is randomised, inclusion of demographic variables into a job choice regression does not alter the slope
of the willingness to pay with respect to the wage markdown in Exhibit 4 (see column (1) of Appendix
5
See Table A4 of the Appendix.
6
The reasons these workers would like a job guarantee were: due to the pandemic and lockdown (69.7 percent);
there not being enough work available (34.9 percent); and/or there not being enough job security otherwise (46.7
percent). (Multiple answers were permitted).
13Table A5). The take-up rate however can vary across demographic groups, which result in differences
in valuations. Exhibit 5 therefore examines these variations in the WTP for a job guarantee. It shows
younger workers and female workers have a higher willingness to pay for a job guarantee. Their
responses to the non-experimental survey questions corroborate this and also show them to be: i) much
more likely to want a job guarantee; and ii) to want it even more since the pandemic.
Low and high education workers have similar WTP, but low education workers are more likely
to want a job guarantee. Similarly, employees and informal workers have similar WTP, but the amount
that employees are willing to pay is much higher because their median wages are also higher. Informal
workers however are much more likely to say they would like a job guarantee (78.8 percent relative to
70.4 percent). Importantly, informal and low-education workers have become much more likely to want
a job guarantee due to the pandemic. Informal workers are 15.2 percentage points more likely than
employees and low education workers are 8.9 percentage points more likely than higher education
workers to want a job guarantee due to the pandemic. 7
5. Conclusion
This paper examines job guarantees and the low wage labour market in urban India during the
Covid-19 crisis. It uses newly collected field data to undertake a before/after lockdown analysis of
labour market outcomes. This shows big employment and earnings losses occurred for workers due to
the crisis. The analysis also reveals that workers who had a job guarantee before the crisis were
relatively shielded by not being hit quite so hard in terms of the increased incidence of unemployment
or working zero hours and earnings losses.
The protective nature of a job guarantee is further analysed through survey questions and a
randomised experiment using a vignettes research design, where workers were able to pick between
otherwise identical jobs that did and did not offer an employment guarantee. In both, workers are shown
to significantly value a job guarantee. From the experiment, they would be willing to pay on average
7
Regressions that enter all the individual characteristics as independent variables are reported for the job guarantee
choice experiment, and the two survey questions on whether individuals would like a job guarantee or whether
they have become more likely to want one under the pandemic in Appendix Table A5.
14just over a quarter of their daily wage to be able to get a guarantee of a minimum days of work. Young
workers and female workers have higher willingness to pay for a job guarantee. The non-experimental
survey evidence strongly corroborates that Indian low-wage workers have a desire for guaranteed work.
Informal workers and female workers are more likely to want a job guarantee, and to want it even more
due to the current crisis.
Overall, the crisis has raised the demand for a job guarantee for those who did not have one
before lockdown. The fifth of workers with a job guarantee were protected from the worst crisis in their
working lives by their job guarantee. This has clear ramifications for labour market policies in the Indian
context, but also more widely in other countries where labour market outcomes have been hit very hard
by the pandemic. Informal workers across the developing world have seen their economic livelihoods
plummet due to the pandemic. While transfers have provided some relief, the challenge of providing
decent work to prevent displacement and longer-term unemployment remain high on the agenda. Job
guarantees are a potentially important policy lever, not least because workers significantly value them
for the work, income and security that they provide.
15References
Abebe, GT, S Caria, M Fafchamps, P Falco, S Franklin, and S Quinn, 2018, Curse of Anonymity or
Tyranny of Distance? The Impacts of Job Search in Urban Ethiopia, CEPR Discussion Paper
No. DP13136.
Adams-Prassl, A, T Boneva, M Golin, and C Rauh, 2020, Inequality in the Impact of the Coronavirus
Shock: Evidence from Real Time Surveys, Journal of Public Economics, 189, 104245.
Afridi, F, A Dhillon, and S Roy, 2020, How has Covid-19 Crisis Affected Urban Poor? Findings from
a Phone Survey, Ideas for India, April 23.
Alfonsi, L, O Bandiera, V Bassi, R Burgess, I Rasul, M Sulaiman, and A Vitali, 2020, Tackling Youth
Unemployment: Evidence from a Labour Market Experiment in Uganda, Working Paper.
Alon, T, M Kim, D Lagakos, and M VanVuren, 2020, NBER Working Paper No. 27273.
Bandiera, O, R Burgess, and I Matin, 2020, Jobs in the Time of Covid-19: Evidence from Bangladesh,
Presentation at Covid-19 Symposium, European Economic Association, August 24-28, 2020.
Banerjee, A, and G Chiplunkar, 2018, How Important are Matching Frictions in the Labor Market?
Experimental and Non-experimental evidence from a Large Indian Firm, Working Paper.
Barboni, G, A Goyal, C Troyer Moore, R Pande, N Rigol, S Schaner, A Sharma, T Vaidya, and H Zhao,
2020, The Role of India’s Food Distribution System During the Covid-19 Crisis, Yale
Economic Growth Center Report, July 23, 2020.
Besley, T, and S Coate, 1992, Workfare versus Welfare: Incentive Arguments For Work Requirements
in Poverty-Alleviation Programs, The American Economic Review, 82(1), Pages 249-61.
Bhalotia, S, S Dhingra, and F Kondirolli, 2020, City of Dreams No More? The Impact of Covid-19 on
Urban Workers in India, CEP Covid-19 analysis, Paper No. 008.
Blundell, J, and S Machin, 2020, Self-employment in the Covid-19 Crisis, CEP Covid-19 analysis,
Paper No. 003.
Bircan, C, Z Koczan, and A Plekhanov, 2020, Jobs at Risk: Early Policy Responses to COVID-19 in
Emerging Markets, in Covid-19 in Developing Economies, eds. S Djankov, U Panizza, CEPR
Press.
Blanchard, O, and D Rodrik, 2019, We have the tools to reverse the rise in inequality, Reflections on
the conference on “Combating Inequality: Rethinking Policies to Reduce Inequality in
Advanced Economies,” Peterson Institute for International Economics, October 17–18, 2019.
Boeri, T, G Giupponi, A Krueger, and S Machin, 2020, Solo Self-Employment and Alternative Work
Arrangements: A Cross-Country Perspective on the Changing Composition of Jobs, Journal of
Economic Perspectives, 34 (1), Pages 170-95.
Coibion, O, Y Gorodnichenko, and M Weber, 2020, Labor Market During the Covid-19 Crisis: A
Preliminary View, NBER Working Paper No. 27017.
Datta, N, 2019, Willing to Pay for Security: A Discrete Choice Experiment to Analyse Labour Supply
Preferences, CEP Discussion Paper No. 1632.
16Dingel, J, and B Neiman, 2020, How Many Jobs Can be Done at Home? Covid Economics, Issue 1,
Pages 16-22, 3 April 2020.
Dreze, J, 2020, An Indian DUET for Urban Jobs, Bloomberg Quint Opinion, September 10, 2020.
Eriksson, T, and N Kristensen, 2014, Wages or fringes? Some evidence on trade-offs and sorting,
Journal of Labor Economics, 32(4), Pages 899-928.
Farber, H, 1983, The Determination of the Union Status of Workers, Econometrica, 51(5), Pages 1417-
37.
Gottlieb, C, J Grobovsek, M Poschke, and F Saltiel, 2020, Working from Home in Developing
Countries, Working Paper.
Gregg, P and R Layard, 2009, Job Guarantee: A New Promise on Long-Term Unemployment,
Centrepiece, Winter 2009/10, Pages 27-28.
Hale, T, S Webster, A Petherick, and BKT Phillips, 2020, Oxford COVID- 19 Government Response
Tracker.
ILO 2020, ILO Monitor: COVID-19 and the World of Work, Third edition, Updates, estimates and
analysis, 29 April 2020, Geneva.
Jain, R, J Budlender, R Zizzamia, and, I Bassier, 2020, The Labor Market and Poverty Impacts of
Covid-19 in South Africa, CASE Working Paper.
Kesar, S, R Abraham, R Lahoti, P Nath, and A Basole, 2020, CSE Working Paper, Azim Premji
University, Centre for Sustainable Employment.
Kulkarni, A, and P Ambasta, 2020, Is Repurposing MGNREGA the Right Way Forward? The Indian
Express, May 25.
Lee, K, H Sahai, P Baylis, and M Greenstone, 2020, “Job Loss and Behavioral Change: The
Unprecedented Effects of the India Lockdown in Delhi”, Working Paper No. 2020-65.
Machin, S, and A Manning 1999, The Causes and Consequences of Longterm Unemployment in
Europe, Handbook of Labor Economics, Elsevier, 3(C), Pages 3085-3139.
Mahmud, M, and E Riley, 2020, Household Response to an Economic Shock: Evidence on the
Immediate Impact of the Covid-19 Lockdown on Economic Outcomes and Well-Being in
Rural Uganda, Working Paper.
Mas, A, and A Pallais, 2017, Valuing Alternative Work Arrangements, American Economic Review,
107(12), Pages 3722-59.
Mas, A, and A Pallais, 2019, Labor Supply and the Value of Non-Work Time: Experimental Estimates
from the Field, American Economic Review: Insights, 1(1), Pages 111-26.
Menzel, A, and C Woodruff, 2019, Gender Wage Gaps and Worker Mobility: Evidence from the
Garment Sector in Bangladesh, National Bureau of Economic Research Working Paper No.
25982.
NDTV, 2020, Government Plans to Extend World’s Biggest Jobs Program to Cities: Report, September
3, 2020.
17Global Multidimensional Poverty Index Report: The Most Detailed Picture to Date of the World’s
Poorest People, 2018, Oxford.
Ravallion, M, 2019, Guaranteed Employment or Guaranteed Income?, World Development, 115, Pages
209-221.
State of Working India, 2018, Azim Premji University, Bengaluru.
Stiglitz, J, 2019, People, Power and Profits: Progressive Capitalism for an Age of Discontent, Penguin
UK.
Sukhtankar, S, 2017, India’s National Rural Employment Guarantee Scheme: What Do We Really
Know About the World’s Largest Workfare Program? Brookings-NCAER India Policy Forum,
113, Pages 231-286.
Viscusi, WK, and JE Aldy, 2003, The Value of a Statistical Life: A Critical Review of Market Estimates
throughout the World, Journal of Risk and Uncertainty, 27(1), Pages 5-76, Springer.
Vyas, M, 2020, Unemployment Rate over 23%, Centre for Monitoring Indian Economy,
https://www.cmie.com/kommon/bin/sr.php?kall=warticle&dt=2020-04-
07%2008:26:04&msec=770
Wiswall, M, and B Zafar, 2018, Preference for the Workplace, Investment in Human Capital, and
Gender, The Quarterly Journal of Economics, 133(1), Pages 457–507.
World Development Report, 2019, The Changing Nature of Work, The World Bank, Washington DC.
18Exhibit 1: Job Guarantee, Pre-Lockdown
All Informal Employee
All 0.175 0.159 0.223
Aged≤25 0.191 0.180 0.216
Aged>25 0.165 0.148 0.228
Female 0.195 0.191 0.201
Male 0.168 0.147 0.235
Education≤10th standard 0.162 0.151 0.226
Education>10th standard 0.208 0.195 0.221
Lockdown zone 0.195 0.171 0.262
No lockdown zone 0.132 0.133 0.129
Able to work at home 0.273 0.273 0.274
Unable to work at home 0.167 0.151 0.216
Sample size 3045 2268 777
19Exhibit 2: Employment and Earnings, Pre-Lockdown and Lockdown
All Job No Job Gap
Guarantee Guarantee (Standard Error)
(1) (2) (3) (4) = (3)-(2)
A. Employment
Job loss 0.236 0.208 0.242 -0.034 (0.019)
Zero hours 0.094 0.043 0.105 -0.062 (0.011)
Not working 0.330 0.251 0.347 -0.095 (0.021)
Sample Size 3045 533 2512 3045
B. Earnings, All
Monthly earnings, pre-lockdown 7954 7392 8074 -682 (247)
Monthly earnings, lockdown 1206 1844 1070 774 (182)
Percent earnings loss 85 75 87
Sample size 3045 533 2512 3045
C. Earnings, Working
Monthly earnings, pre-lockdown 8081 7380 8251 -872 (286)
Monthly earnings, lockdown 1551 2236 1385 851 (245)
Percent earnings loss 81 70 83
Sample size 2040 399 1641 2040
D. Earnings, Paid
Monthly earnings, pre-lockdown 8384 9090 8165 925 (706)
Monthly earnings, lockdown 6472 7690 6094 1597 (741)
Percent earnings loss 23 15 25
Sample size 489 116 373 489
Notes: Standard errors in parentheses.
20Exhibit 3: Employment and Earnings Losses From C19
Pr[Employment Loss]
Job loss Zero hours Not working
(1) (2) (3) (4) (5) (6)
Job guarantee -0.050 (0.019) -0.050 (0.019) -0.066 (0.011) -0.061 (0.011) -0.116 (0.021) -0.111 (0.021)
Age -0.002 (0.001) -0.002 (0.001) -0.002 (0.001) -0.002 (0.001) -0.004 (0.001) -0.004 (0.001)
Female 0.009 (0.017) 0.011 (0.017) -0.003 (0.012) 0.000 (0.012) 0.007 (0.019) 0.012 (0.019)
Education≤10th standard -0.070 (0.019) -0.072 (0.019) 0.008 (0.013) 0.003 (0.014) -0.062 (0.021) -0.070 (0.021)
Informal -0.013 (0.019) -0.016 (0.019) -0.070 (0.015) -0.071 (0.015) -0.083 (0.022) -0.087 (0.021)
Lockdown zone 0.051 (0.016) -0.026 (0.012) 0.025 (0.018)
Can work from home -0.099 (0.025) -0.053 (0.015) -0.152 (0.028)
City and state fixed effects Yes Yes Yes Yes Yes Yes
Sample size 3045 3045 3045 3045 3045 3045
Earnings Loss (Rs)
All Working Paid
(7) (8) (9) (10) (11) (12)
Job guarantee -984 (193) -929 (192) -1120 (250) -1029 (251) -442 (454) -523 (435)
Age -1 (10) -1 (10) 2 (13) 3 (13) 61 (33) 64 (34)
Female -125 (232) -50 (225) 7 (290) 46 (284) -610 (339) -673 (347)
Education≤10th standard 126 (163) 13 (165) 200 (238) 37 (241) 784 (518) 693 (559)
Informal 686 (197) 618 (191) 1146 (302) 997 (292) 1665 (546) 1570 (498)
Pre-lockdown earnings 0.739 (0.087) 0.739 (0.085) 0.648 (0.120) 0.651 (0.117) 0.165 (0.083) 0.166 (0.083)
Lockdown zone 687 (154) 776 (199) 144 (374)
Can work from home -2544 (412) -2839 (474) -701 (630)
City and state fixed effects Yes Yes Yes Yes Yes Yes
Sample size 3045 3045 2040 2040 489 489
Notes: Standard errors in parentheses. The city fixed effects are for the biggest 9 cities in terms of population and state fixed effects for Bihar,
Jharkhand and Uttar Pradesh.
21Exhibit 4: Willingness to Pay for a Job Guarantee
.75
.7
Proportion Choosing Job Guarantee
.65
.6
.55
.5
.45
.4
.35
.3
.25
-.4 -.3 -.2 -.1 0
Wage Markdown for Job Guarantee
Notes: Based on the sample of 2512 workers who do not have a job guarantee. The median
WTP for a job guarantee is determined from a logistic regression of whether an individual
chooses the job guarantee on the randomly allocated wage markdown as described in detail in
the Appendix. For the logistic model slope in the Figure the median WTP corresponds to a
wage markdown of -0.255 (standard error = 0.014), or 25.5 percent of the wage. This comes
from the ratio of the estimated constant term (βG = 0.758 with associated standard error 0.064)
to the coefficient on the wage markdown (βW = 0.030 with associated standard error 0.003).
22Exhibit 5: Demand for a Job Guarantee
Choice Experiment Would Like Job Guarantee More Likely to Want Job
Guarantee Due to Corona
Lockdown
Median WTP, Median Proportion Gap Proportion Gap
Proportion of WTP, (Standard (Standard
Daily Wage Daily Error) Error)
Rs
(1) (2) (3) (4) (5) (6)
All 0.255 (0.014) 81 0.768 0.369
Age≤25 0.302 (0.031) 93 0.782 0.376
0.023 (0.017) 0.012 (0.020)
Age>25 0.234 (0.015) 76 0.759 0.364
Female 0.354 (0.046) 86 0.798 0.444
0.042 (0.018) 0.104 (0.022)
Male 0.229 (0.014) 79 0.756 0.340
Education≤10th standard 0.257 (0.015) 78 0.790 0.393
0.083 (0.020) 0.089 (0.021)
Education>10th standard 0.250 (0.036) 90 0.707 0.304
Informal 0.247 (0.014) 75 0.788 0.405
0.084 (0.021) 0.152 (0.021)
Employee 0.297 (0.042) 109 0.704 0.253
Notes: Standard errors in parentheses. Based on the sample of 2512 workers who do not have a job guarantee.
23Online Appendix
Table A1: Survey Sample, Definitions and Questions
Sample Selection. The survey interviewed 5525 individuals, who had work at some point in the
previous ten years. Of them, 3045 were employees or informal workers, as defined below. About 43
percent of all surveyed workers were self-employed or worked in their family business before the
pandemic (February 2020). Another 1.5 percent were government employees. As the focus of interest
of this paper is on a job guarantee, these self-employed individuals and government workers are
excluded because they (effectively) have a job guarantee through their business or the government.
A very small number of individuals (0.3 percent) were unemployed for a duration dating back to well
before the lockdown. They are also excluded from the analysis because of the focus on changes in
labour market outcomes for those in work before the pandemic.
Employees. Employed by private for-profit company or proprietorship or partnership or employed
by co-operative societies/trust/other non-profit institutions.
Informal Workers. Employed casually (e.g. daily labourer, casual farm worker) or employed by
private households (e.g. maid, watchman, cook, etc) or employed by a single individual.
Big Cities. Indicators for Class I cities, which are defined by Census 2011 as urban agglomerations
that had a population of 100,000 or more in the census.
Unable to Work from Home. Indicator for those who could not do any work from home (in their pre-
Covid employment), based on the following question:
Some workers, such as website designers, can easily perform many of their work duties from home.
Others, like clothes shop attendants, cannot do much work from home. Thinking of your current job,
what percentage of your work duties could be done working from home? 0% from home/…../100%
from home.
Choice Experiment
From Hindi translation to English, the enumerator’s screen appears as follows:
24Table A2: Employment and Earnings Losses From C19, Plus Industry and Firm Size
Pr[Employment Loss]
Job loss Zero hours Not working
(1) (2) (3) (4) (5) (6)
Job guarantee -0.044 (0.020) -0.040 (0.020) -0.082 (0.012) -0.077 (0.012) -0.123 (0.022) -0.117 (0.022)
Age -0.002 (0.001) -0.002 (0.001) -0.002 (0.001) -0.002 (0.001) -0.004 (0.001) -0.004 (0.001)
Female -0.018 (0.018) -0.018 (0.018) -0.001 (0.012) 0.001 (0.012) -0.018 (0.020) -0.017 (0.020)
Education≤10th standard -0.039 (0.020) -0.046 (0.021) 0.004 (0.014) 0.000 (0.014) -0.035 (0.022) -0.041 (0.022)
Informal -0.003 (0.023) -0.006 (0.023) -0.042 (0.018) -0.043 (0.018) -0.045 (0.026) -0.049 (0.026)
Lockdown zone 0.050 (0.017) -0.022 (0.012) 0.028 (0.018)
Can work from home -0.111 (0.026) -0.043 (0.015) -0.154 (0.029)
City and state fixed effects Yes Yes Yes Yes Ye Yes
Industry and firm size Yes Yes Yes Yes Yes Yes
fixed effects
Sample size 3045 3045 3045 3045 3045 3045
Earnings Loss (Rs)
All Working Paid
(7) (8) (9) (10) (11) (12)
Job guarantee -975 (200) -914 (202) -1214 (262) -1001 (267) -829 (510) -870 (499)
Age 5 (10) 5 (10) 12 (13) 10 (13) 59 (31) 63 (31)
Female 248 (221) 255 (219) 489 (288) 443 (287) 51 (377) 3 (388)
Education≤10th standard 51 (170) -28 (171) 77 (250) -29 (250) 508 (519) 442 (530)
Informal 355 (215) 296 (211) 813 (314) 719 (306) 2194 (827) 2111 (793)
Pre-lockdown earnings 0.739 (0.090) 0.741 (0.088) 0.646 (0.124) 0.680 (0.199) 0.170 (0.083) 0.169 (0.083)
Lockdown zone 658 (155) 648 (121) -10 (394)
Can work from home -2416 (412) -2681 (121) -574 (598)
City and state fixed effects Yes Yes Yes Yes Yes Yes
Industry and firm size Yes Yes Yes Yes Yes Yes
fixed effects
Sample size 3045 3045 2040 2040 4894 489
Notes: Standard errors in parentheses. The city fixed effects are for the biggest 9 cities in terms of population and state fixed effects for Bihar,
Jharkhand and Uttar Pradesh. The industry and firm size fixed effects comprise 20 industries and 6 firm size groupings respectively.
25Table A3: Randomisation Tests for Choice Experiment
p-value of F-statistic
testing joint
significance of wage
gap dummy variables
Age≤25 0.53
Female 0.05
Education≤10th standard 0.16
Informal 0.38
Big city 0.30
Bihar 0.65
Jharkhand 0.77
Uttar Pradesh 0.61
Sample size 2512
Table A4: Reasons Given For Not Wanting a Job Guarantee
All Informal Employee
Do not need it 0.564 0.607 0.564
Domestic commitments 0.241 0.244 0.235
Want to do other types of work 0.164 0.160 0.173
Student 0.046 0.022 0.101
Ill or disabled 0.017 0.017 0.017
Sample size 584 405 179
Table A5: Regressions For Outcomes Considered in Exhibit 5
Pr[Choose Job Pr[Would Like Job Pr[More Likely To
Guarantee] Guarantee] Want Job Guarantee
Under Corona
Lockdown]
(1) (2) (3)
Age -0.005 (0.001) -0.004 (0.001) -0.002 (0.001)
Female 0.053 (0.021) 0.061 (0.019) 0.141 (0.022)
Education≤10th standard 0.043 (0.024) 0.063 (0.022) 0.046 (0.023)
Informal 0.010 (0.024) 0.071 (0.023) 0.145 (0.023)
Wage markdown -0.773 (0.078)
City and state fixed effects Yes Yes Yes
Sample size 2512 2512 2512
Notes: Standard errors in parentheses.
26Theory and Empirical Specification
Following the literature on random utility models, jobs are characterized by various attributes
a that take on values for job j ∈{A,B}. Individual i receives the following utility from job j: =
+ , where =∑ and are idiosyncratic taste terms which are assumed to be
iid, independent of attributes X and drawn from a type I extreme value distribution. If the underlying
preference parameters are estimated with observational job choice data, there would be concerns over
the independence assumption being violated when unobserved job attributes are correlated with
included job attributes like wages. The experimental design accounts for this in two ways. First, the
focus is on just two job attributes varying across the two jobs – a job guarantee and the daily wage rate,
holding all else constant. Second, of the two attributes under consideration, the wage difference across
the two jobs is randomly assigned by the experiment. It therefore avoids the problem of being an
equilibrium wage-guarantee profile, where the former is likely to be correlated with unobserved tastes
for the job which would bias the estimated parameters.
Each individual participating in the survey was asked to consider a situation in which he/she
must choose between one of two job offers, which are identical in every way except for the features
which are emphasized - wages and job guarantee. This reduces the attribute space over which decisions
are being made into one dimension – a trade-off between having a job guarantee and the wage
markdown . Job A pays the person his/her usual daily wage (in Indian Rupees). It does not
guarantee any set number of work days per year ( = 0). Job B is identical in every way, except it pays
the worker a daily wage of (1 − /100) (in Indian Rupees) and guarantees at least 100 days of
work per year ( = 1).
Then the log odds of choosing job B which offers a job guarantee relative to job A which does
not is: ln( / )= + ln(1 − /100) ≈ − ( /100). Unlike observed job choice
data, the experiment randomly assigns so that any concerns over unobservables being correlated
with it are minimised. Individuals were randomized into different values of drawn from
{0, 1, 2, … , 39, 40}. Table A3 in the Appendix shows that the randomised markdowns turn out
27You can also read