A multimodal analysis of physical activity, sleep, and work shift in nurses with wearable sensor data
←
→
Page content transcription
If your browser does not render page correctly, please read the page content below
www.nature.com/scientificreports
OPEN A multimodal analysis of physical
activity, sleep, and work shift
in nurses with wearable sensor data
Tiantian Feng1*, Brandon M. Booth1,3, Brooke Baldwin‑Rodríguez2, Felipe Osorno2 &
Shrikanth Narayanan1
Night shift workers are often associated with circadian misalignment and physical discomfort, which
may lead to burnout and decreased work performance. Moreover, the irregular work hours can lead to
significant negative health outcomes such as poor eating habits, smoking, and being sedentary more
often. This paper uses commercial wearable sensors to explore correlates and differences in the level
of physical activity, sleep, and circadian misalignment indicators among day shift nurses and night
shift nurses. We identify which self-reported assessments of affect, life satisfaction, and sleep quality,
are associated with physiological and behavioral signals captured by wearable sensors. The results
using data collected from 113 nurses in a large hospital setting, over a period of 10 weeks, indicate
that night shift nurses are more sedentary, and report lower levels of life satisfaction than day-
shift nurses. Moreover, night shift nurses report poorer sleep quality, which may be correlated with
challenges in their attempts to fall asleep on off-days.
Market forces today are increasingly demanding industries to provide 24-h services for supporting a growing
global economy. Traditional industry sectors such as healthcare, transportation, and public safety continue to
employ workers for around-the-clock service, but other industries are ramping up their employment of person-
nel at all hours including, journalism, computing technology, control center monitoring (e.g., air traffic, power
plants, etc.) and others. The US Department of Labor estimates that upwards of 16% of the US workforce occu-
pies a non-day shift schedule, including shifts during evenings, nights, and rotating and irregular work hours1.
This growing demand for non-daytime shift work is perceived as a benefit for some people who enjoy working
late hours or need schedule flexibility. But this comes at cost, as emerging research is pointing out some of the
maleffects of late work shifts for many professionals.
One of the most prevalent concerns for night shift workers is their tendency to experience circadian mis-
alignment. This may initially result when a person’s biological clock is misaligned with the shift work and may
be chronically exacerbated for individuals who work rotating shifts or attempt to maintain a regular schedule
during off-days (e.g., to maintain social ties). The disruption of individuals’ circadian rhythms has been linked
with heightened stress and physical d iscomforts2, diminished job satisfaction and sleep quantity, and correlate
with fatigue and mental health issues when compared to regular day-shift w orkers3. Night shift workers also
have a higher prevalence of adverse health indicators such as smoking, drinking alcohol, poor eating habits, and
being sedentary more o ften4–6. The physical and psychological toll and behavioral impacts of night shift work
objectively reduce workplace performance7, increase sleepiness8, and also increase the risk of developing chronic
illness like diabetes, hypertension, and cardiovascular d isease2. Emerging research is starting to uncover methods
for partially mitigating the impact by making sleeping and eating routines more r egular9,10. Nevertheless, new
research is discovering molecular and biological differences in misaligned workers, suggesting that avoiding all
maleffects may not be possible11.
Improving employee wellness services for managing these issues is important, but a requisite step towards
proactive care is understanding who needs attention. Workers with irregular work schedules are good candidates
for proactive care because they often experience circadian misalignment, which is believed to be a key element
associated with declines in work performance and overall well-being3,12–15. Particularly, workers who always
work night shift may voluntarily induce circadian misalignment to maintain family and social c onnections16.
Another reportedly important factor influencing job satisfaction in shift workers and well-being regardless of
the work schedule is physical activity17. However, past works studying these effects rely heavily on surveys which
1
Signal Analysis and Interpretation Laboratory, University of Southern California, Los Angeles, CA 90089,
USA. 2Keck Medical Center of USC, Los Angeles 90033, USA. 3Present address: Institute of Cognitive Science,
University of Colorado Boulder, Boulder, CO 80309, USA. *email: tiantiaf@usc.edu
Scientific Reports | (2021) 11:8693 | https://doi.org/10.1038/s41598-021-87029-w 1
Vol.:(0123456789)www.nature.com/scientificreports/
suffer from subjective reporting. Modern mobile and wearable sensing technologies offer a promising avenue for
capturing rich human-centric contextual, behavioral, and physiological signals to aid in monitoring well-being.
Wearable bio-behavioral sensors can capture signals related to human heart activity, sleep, and physical
exertion throughout the day to aid in the objective measurement of important features like circadian misalign-
ment and physical activity. Such sensors and signals have also proven to be helpful in the assessment of stress
and anxiety levels in other studies conducted in natural. so called “in the wild”, settings18–21. One recent study
focused on collecting self-reports and physiological data from hospital workers in situ using wearable sensing
to examine the impact of sleep on overall well-being22. This study successfully employed wearable sensors in an
ecologically valid scenario to discover links between subjective self-reports of both alertness and performance
and the physiological data and sleep diaries collected from participants. However, it does not address the extent
to which key physiological information (i.e., sleep patterns and physical activity) provided by consumer-grade
wearable sensors can be used to monitor well-being on a daily basis.
We aim to address this knowledge gap in this work by employing commercial sensors in a high-stakes stressful
work environment with established day and night shifts. We elected to study nurses working in a hospital environ-
ment because of the long work shifts (typically 8–12 h with few breaks), high vigilance demands, and high levels
of stress and anxiety compared to other professions23,24. We present results from a computational analysis of data
from a 10-week study of 113 nurses in a hospital environment aimed at analyzing the differential impact of day/
night work shift on overall well being among healthcare professionals. We study the behaviors of both day shift
and night shift nurses through self-assessments and wearable sensor measurements, and we use the sensor data
to identify factors that are associated with affect, personality, and health variables with respect to shift schedule.
The main contributions of this study are the following: (1) In contrast to most existing works, the present study
provides analyses of both wearable data and self-report variables over a significantly longer (10-week) duration
and from a larger participation pool of healthcare workers (113 nurses) to explore differential effects on nurses
working different shift schedules and in their natural work (and outside work) environments; (2) The study
quantifies correlates and differences in the level of physical activity, sleep, and circadian misalignment indicators
between day shift nurses and night shift nurses; (3) Finally, it identifies unique associations between self-report
behavioral variables and wearable sensor data for nurses working in different shift schedules.
Method
The “TILES: Tracking Individual Performance with Sensors” study represents a set of comprehensive experiments
conducted to examine the physiological, environmental, and behavioral variables affecting job performance and
employee wellness25. Throughout a 10 week period, the study collected data through wearable sensors, mobile
devices, and self-assessments from nursing professionals working in a tertiary/quaternary care academic medical
center located in Los Angeles, California26,27. Participants provided informed consent prior to the study through
a mobile application, called TILES App25. The study protocol was approved by the USC’s Health Sciences Cam-
pus Institutional Review Board (study ID HS-17-00876). All the study protocols and methods are performed
in accordance with the USC’s Health Sciences Campus Institutional Review Board and the standards set by the
Declaration of Helsinki.
Participants. In total, 113 nursing professionals (registered nurse only) were enrolled in the study. Nurses
who were employed at the hospital were invited to sign up for an in-person enrollment session. Nursing staff
generally worked in shifts, with the day shift scheduled primarily from 07:00 to 19:00 h and night shift primar-
ily from 19:00 to 7:00 h. During the enrollment session, participants completed a set of baseline assessments
(described in the following section) that collected information about demographics, sleep quality, affect, anxiety,
and personality. Participants also provided their primary shift schedule information, either day shift or night
shift, during the enrollment session. Thus, for the remainder of this paper, readers should interpret “day shift
nurses” as nurses who primarily work during the day and likewise for night shift nurses. After completing the
baseline surveys, participants were provided a set of wearable sensors to wear approximately daily and asked to
complete brief ecological momentary assessments (EMAs) on a daily basis. The study period for each participant
was 10 weeks. Further details about enrollment and inclusion criteria are described in the published data set
paper25.
Study protocol. Behavioral variables. A set of baseline evaluations were administered during the enroll-
ment session to assess demographic information and behavioral variables, such as sleep quality, affect, anxiety,
life satisfaction, personality, and primary shift pattern (day shift or night shift).
Anxiety (STAI) Anxiety measured using the State-Trait Anxiety Inventory (STAI)28. It was scored by adding
sum responses, obtaining a value in the range 20 to 80, with higher scores indicating greater anxiety.
Positive and negative affect schedule (PANAS) The PANAS29 was used to measure level of the positive affect
(PA) and negative affect (NA). The PANAS consisted of 10 PA items and 10 NA items, with each item on a scale
ranging from 1 to 5. PA and NA scores were calculated by summing individual item responses within each group
(PA and NA), with higher scores representing higher levels of corresponding affect.
Life satisfaction (SWLS) The Satisfaction with Life Scale (SWLS) was a 5-item measure that aims to assess par-
ticipants’ general satisfaction with life. Participants rated the degree to which they agree with each statement on a
scale of 1 (strongly disagree) to 7 (strongly agree). A total score was obtained by taking the average of the 5 items.
Personality (BFI-2) Personality was evaluated using the Big Five Inventory-2 (BFI-2)30. Five different aspects
of personality were measured, all in a range between 1 and 5: 1. Neuroticism; 2. Conscientiousness; 3. Extraver-
sion; 4. Agreeableness; 5. Open-Mindedness.
Scientific Reports | (2021) 11:8693 | https://doi.org/10.1038/s41598-021-87029-w 2
Vol:.(1234567890)www.nature.com/scientificreports/
Pittsburgh Sleep Quality Index (PSQI) The baseline surveys used the PSQI to assess sleep quality31. This
survey contains 19 items to evaluate seven different aspects of sleep. Participants responded to items relating to
each aspect on a scale ranging from 0 to 3, with higher scores indicating poorer sleep quality. The final score is
obtained by summing the items and ranges from 0 to 21.
Ecological momentary assessments. The EMAs were administered via text message on a daily basis throughout
the study period and asked participants about affect, anxiety, and stress. Participants received a push notification
when the EMAs were delivered and again 30 min before it expired if it had not yet been completed. The EMAs
were sent on each day throughout the study period. Day shift workers received these surveys at either 6:00 h,
12:00 h, or 18:00 h each day. Night shift workers received these surveys at either 18:00 h, 0:00 h, or 6:00 h each
day. Each survey had 6 h window to complete before it expired.
StressThe EMAs asked participants to rate their current stress level using the following five-point scale: 1 (No
stress at all), 2 (Very little stress), 3 (Some stress), 4 (A lot of stress), 5 (A great deal of stress).
AnxietyParticipants were asked to rate their current anxiety level from EMAs on a scale ranging from 1 (Not
at all anxious) to 5 (Extremely anxious).
AffectThe EMAs contained a short version of the PANAS questionnaire to measure affect32. The PANAS-
Short consisted of 5 items for PA and NA, both with scores ranging from 5 to 25 where higher scores indicating
higher affective valence.
Wearable sensors. Several days after the last scheduled enrollment session of the study participants, the 10-week
data collection from sensors began. The primary sensor used for the analysis in this study is the Fitbit Charge
233, a wristband device that provides measurements of step count, heart rate, and sleep. We asked participants to
wear this device at all times (not just while at work) throughout the 10-week data collection period; this allowed
us to keep track of heart rate, physical activities, and sleep quality outside of work. A monetary incentive struc-
ture was in place to encourage participant compliance with the study protocol on a weekly basis. Participants
with missing sensor data on any given day were notified via the TILES App so they could rectify the situation and
continue working towards their weekly compliance goals on the next day. Day-shift participants produced an
average of 48.8 days of recordings with a standard deviation of 20.5 while night-shift participants produced and
average of 48.3 days of recordings with a standard deviation of 19.4. There was a total of 4793 recorded sleep ses-
sions from 107 participants (day-shift mean ± sd: 44.6 ± 3.1 sessions, night-shift: 45.0 ± 20.2 sessions). Further
details on compliance and incentives can be found in the data set paper25.
Physical activity. The physical activity was calculated through the PPG-based heart rate and step count
data readings where data preprocessing was based upon our previous work34. PPG-based heart rate measure-
ments were averaged within each minute interval and then used to compute the intensity of physical activity for
each participant. The activity intensity was based on each individual’s estimated maximum heart rate from the
equation shown below35:
HRmax = 220 − Age (1)
We categorized the minute-level heart rate readings into 3 types based o n35,36: (1) Rest activity zone (heart
rate is below 50% of its maximum); (2) Moderate activity zone (heart rate is 50% to 69% to its maximum); (3)
Vigorous activity zone (heart rate is 70% to 84% to its maximum). We ignored the heart rate values above 85% to
its maximum since the available sample size is small (< 1%). The proportion of time spent in each of these three
different activity types was used to compare the behavioral differences between day shift and night shift nurses.
A walk activity ratio was also defined on the same time scale as the heart rate measurements. This ratio was
defined as the total number of minutes with a step count above zero divided by total recorded number of minutes.
In addition, the walk activity ratio was separately computed within 6 time periods during the day for further
analysis of the dynamics of this behavior. These time periods were: (1) 23:00 h–3:00 h; (2) 3:00 h–7:00 h; (3) 7:00
h–11:00 h; (4) 11:00 h–15:00 h; (5) 15:00 h–19:00 h; (6) 19:00 h–23:00 h.
Sleep patterns. The Fitbit devices provided a set of processed signal features related to sleep, which included
sleep onset time, wake up time, sleep duration, and sleep efficiency. Similar to the feature extraction of the physi-
cal activity pattern, we aggregated these sleep-related features on workdays and off-days. Moreover, we defined
the measure of social jet lag as the differences between mid-sleep time on workdays (MSW) and mid-sleep time
on free days (MSF)16. The social jet lag can be chronic through adult life and results in a range of illnesses, and
quantifying social jet lag can be helpful to understand the circadian misalignment of an individual. More specifi-
cally, we computed the social jet lag (MS) as:
MS = |MSW − MSF| (2)
Statistical analyses
Independent two-sample t-tests were performed to assess differences in the demographic variables and behav-
ioral variables between nurses who primarily worked a day shift and those primarily worked a night shift (see
Table 1). Three-way ANOVA was used to examine the effect on the behavioral variables from the factor shift [day
shift; night shift] with the covariate gender [male; female] and the covariate age [age ≥ 40 years; age < 40 years].
A linear mixed model was implemented to compare differences in reported EMAs (PA, NA, anxiety, and stress)
between shift types and work status (see Fig. 1). The primary shift [day shift; night shift] and work status [on
Scientific Reports | (2021) 11:8693 | https://doi.org/10.1038/s41598-021-87029-w 3
Vol.:(0123456789)www.nature.com/scientificreports/
Day shift Night shift All subjects All subjects Day vs night
N = 69 N = 44 N = 113 Range p value
Demographics
Gender (female, n (% of N)) 51 (73.9%) 31 (70.5%) 82 (72.6%)
Native lang. = English (n (% of N)) 39 (56.5%) 25 (56.8%) 64 (56.6%)
Highest degree earned
College (n (% of N)) 59 (85.5%) 33 (75.0%) 92 (81.4%)
Graduate (n (% of N)) 10 (14.5%) 11 (25.0%) 21 (18.6%)
Age, year (mean ± SD) 39.4 ± 8.9 35.2 ± 7.5 37.8 ± 8.6 23.0–65.0 0.010∗
Age < 40 years (n (% of N)) 40 (58.0%) 32 (72.7%) 72 (63.7%)
Age ≥ 40 years (n (% of N)) 29 (42.0%) 12 (27.3%) 41 (36.3%)
Affect variables
STAI (mean ± SD) 32.9 ± 7.6 35.4 ± 9.1 33.9 ± 8.3 20.0–55.0 0.130
PA (mean ± SD) 37.0 ± 6.4 37.3 ± 6.6 37.1 ± 6.5 16.0–50.0 0.764
NA (mean ± SD) 14.9 ± 3.7 16.5 ± 4.9 15.5 ± 4.3 10.0–31.0 0.065
SWLS (mean ± SD) 5.4 ± 1.1 4.8 ± 1.4 5.2 ± 1.2 1.0–7.0 0.030∗
Personality
Neuroticism (mean ± SD) 2.1 ± 0.7 2.3 ± 0.7 2.2 ± 0.7 1.0– 4.0 0.166
Conscientiousness (mean ± SD) 4.2 ± 0.6 4.1 ± 0.6 4.2 ± 0.6 2.3–5.0 0.601
Extraversion (mean ± SD) 3.6 ± 0.7 3.5 ± 0.8 3.6 ± 0.7 1.8–5.0 0.600
Agreeableness (mean ± SD) 4.2 ± 0.5 4.2 ± 0.4 4.2 ± 0.5 2.6–5.0 0.994
Openness (mean ± SD) 3.7 ± 0.6 3.9 ± 0.6 3.8 ± 0.6 1.9–4.9 0.058
Sleep variables
PSQI (mean ± SD) 7.0 ± 2.0 8.4 ± 2.5 7.5 ± 2.3 4.0–14.0 0.004∗∗
PSQI < 7 (n (% of N)) 30 (43.5%) 11 (25.0%) 41 (36.3%)
PSQI ≥ 7 (n (% of N)) 39 (56.5%) 33 (75.0%) 72 (63.7%)
Table 1. Demographic information and behavioral variables for both day and night shift nurses. STAI: state
trait anxiety; PANAS: positive and negative affect schedule; SWLS: life satisfaction; BFI-2: big five inventory-2;
PSQI: Pittsburgh Sleep Quality Index. Statistical significance denoted by: p∗∗ < 0.01, p∗ < 0.05.
EMA Anxiety EMA Stress
5 Day shift 5 Day shift
Night shift Night shift
4 4
Anxiety
Stress
3 3
2 2
1 1
Workday Off−day Workday Off−day
EMA Positive Affect EMA Negative Affect
25
25 Day shift
Day shift Night shift
Night shift
Negative Affect
20
Postive Affect
20
15 15
10 10
5 5
Workday Off−day Workday Off−day
Figure 1. Distribution of EMA responses (affect, anxiety and stress) compared with shift and work status.
workdays; on off-days] were modeled as fixed effects, with participants included as a random effect. The subjects
with a number of reported EMAs fewer than ten were excluded in this analysis.
We performed the three-way ANOVA model to test for the effect of primary shift [day shift; night shift] on
daily physical activity characteristics with the covariate age [age ≥ 40 years; age < 40 years], and the covariate
gender [male; female] (see Table 2). The covariate age was included in the analysis as the day shift group and
Scientific Reports | (2021) 11:8693 | https://doi.org/10.1038/s41598-021-87029-w 4
Vol:.(1234567890)www.nature.com/scientificreports/
Day shift Night shift
Variable µ (σ ) Lower.CL Upper.CL µ (σ ) Lower.CL Upper.CL p-val
Rest activity ratio (%)
On workdays 73.0 (2.2) 68.6 77.4 82.4 (2.7) 77.0 87.8 < 0.01∗∗
On off-days 76.5 (2.1) 72.4 80.7 83.5 (2.4) 78.7 88.2 < 0.01∗∗
Walk activity ratio (%)
On workdays 31.3 (1.0) 29.5 33.2 27.6 (1.1) 25.3 29.9 0.029∗
On off-days 25.3 (1.1) 23.2 27.4 21.3 (1.2) 18.9 23.8 0.025∗
Vigorous activity (min)
On workdays 4.1 (0.7) 2.8 5.4 3.2 (0.8) 1.6 4.8 0.159
On off-days 7.5 (1.0) 5.5 9.5 5.3 (1.1) 3.0 7.6 0.037∗
Table 2. Physical activity patterns (in estimated marginal means) between day shift nurses and night shift
nurses. Statistical significance of factor shift in the three-way ANOVA test denoted by: p∗∗ < 0.01, p∗ < 0.05.
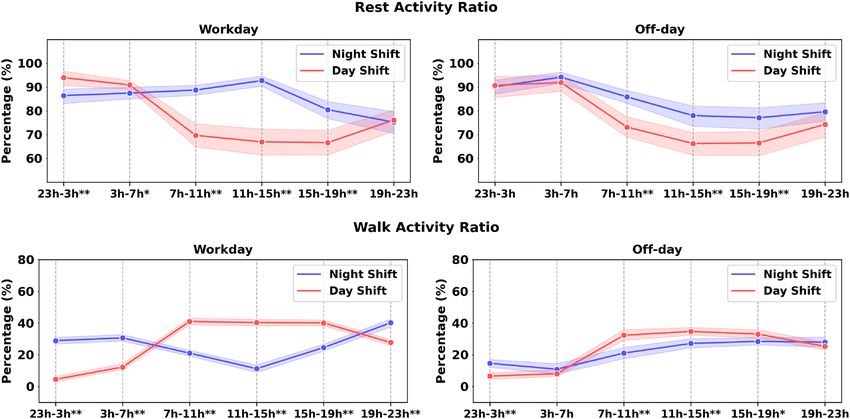
Figure 2. Comparison of the physical activity from different time periods in a day. The x-axis presents the time
in a day. The decision to use these time intervals is described in the method section. Asterisks indicate statistical
differences at each time period with p∗∗ < 0.01, p∗ < 0.05.
the night shift group in our dataset differed significantly in age, and the physical activity can be impacted by
the age. We also included gender as the covariate since it was correlated with different levels of physical activity
in previous s tudies37. The dependent variables were average rest-activity ratio, average walk activity ratio, and
average vigorous activity duration (both on workdays and off-days). The moderate activity ratio was excluded
for these analyses since it showed strong correlations with the rest-activity ratio (ρ < −0.7). The participants
with less than 5 days of workday data and less than 5 days of off-days data were excluded for calculating daily
physical activity on workdays and off-days, respectively. The days at work was not collected within this study,
and we followed the protocol similar to25 to infer whether a day was workday or off-day. We inferred the days
at work information by examining the proximity data in the hospital unit, the presence of the garment-based
sensor data (we only required the participants to wear garment-based sensor at work), and confirmation from
daily surveys if at workplace or not.
To examine the effect of primary shift type and time within a day on physical activity characteristics, a 2 × 6
repeated ANOVA (primary shift [day shift, night shift], time within a day [23:00–3:00 h, 3:00–7:00 h, 7:00–11:00
h, 11:00–15:00 h, 15:00–19:00 h, 19:00–23:00 h]) was used for rest-activity ratio and walk time ratio on both
workdays and off-days (see Fig. 2). We applied Greenhouse-Geisser’s correction where the sphericity assumption
was not met. The linear regression model (see Table 3) was applied to assess the effect of the shift schedule, the
physical activity, and the shift by physical activity interaction on the behavioral variables. The factor age and the
factor gender were added in the model as covariates. Each physical activity feature (e.g., the rest activity ratio on
off-days) combined with the primary shift variable on a behavioral measure was modeled independently. The
behavioral variables were STAI, PANAS, SWLS, and PSQI.
Scientific Reports | (2021) 11:8693 | https://doi.org/10.1038/s41598-021-87029-w 5
Vol.:(0123456789)www.nature.com/scientificreports/
SWLS STAI PSQI PA NA
Std β Std. β Std. β Std. β Std. β
Intercept − 0.61* 0.20 0.38 0.47 0.60*
Age [< 40 years] 0.42 − 0.23 − 0.40 0.24 − 0.26
Gender [female] 0.35 − 0.08 0.25 − 0.44 − 0.49*
Shift [day shift] 0.41 − 0.13 − 0.69** -0.24 − 0.23
Rest-activity ratio (off-day) − 0.16 0.37 0.05 − 0.66** 0.07
Shift [day shift] × rest-activity ratio (off-day) 0.51 − 0.22 0.04 0.57* − 0.09
Number of observations 94 95 94 95 95
Adjust R2 0.131** 0.036 0.160** 0.112** 0.024
SWLS STAI PSQI PA NA
Std β Std. β Std. β Std. β Std. β
Intercept − 0.51* 0.32 0.42 0.18 0.58*
Age [< 40 years] 0.32 − 0.35 − 0.44* 0.43* − 0.25
Gender [female] 0.27 − 0.19 0.22 − 0.25 − 0.47
Shift [day shift] 0.41 − 0.14 − 0.70** − 0.23 − 0.23
Walk-activity ratio (off-day) 0.26 − 0.43* − 0.05 0.44* − 0.11
Shift [day shift] × walk-activity ratio (off-day) − 0.62** 0.41 0.02 − 0.13 0.22
Number of observations 94 95 94 95 95
Adjust R2 0.142** 0.051 0.155** 0.152** 0.034
Table 3. Results from the linear regression models to predict daily self-report variables using the physical
activity features. Statistical significance is denoted with ** p < 0.01, * p < 0.05.
Day shift Night shift
Variable µ (σ ) Lower.CL Upper.CL µ (σ ) Lower.CL Upper.CL p-val
Sleep duration (min)
On workdays 410.4 (7.1) 394.1 426.6 330.4 (8.4) 311.2 349.6 < 0.01∗∗
On off-days 437.0 (10.4) 413.4 460.6 408.2 (11.7) 381.6 434.8 0.107
Sleep efficiency (%)
On workdays 92.3 (0.7) 90.8 93.7 93.8 (0.8) 92.1 95.5 0.105
On off-days 91.8 (0.8) 90.0 93.7 93.7 (1.0) 91.6 95.7 0.082
MS (min) 52.5 (16.5) 14.8 90.2 425.0 (18.4) 383.0 467.0 < 0.01∗∗
Table 4. Table showed the sleep pattern (in estimated marginal means) comparisons between day shift nurses
and night shift nurses. Statistical significance was denoted as p∗∗ < 0.01, p∗ < 0.05.
Similar to the physical activity analyses, we applied a three-way ANOVA model to test for effect of the pri-
mary shift [day shift; night shift], the covariate age [age ≥ 40 years; age < 40 years] and covariate gender [male;
female] on sleep-related characteristics (see Table 4). The participants with less than 5 sleep data on workdays
and less than 5 sleep data on off-days data were excluded for remaining analysis. The dependent variables were
average sleep duration on workdays and off-days, sleep efficiency on workdays and workdays, and social jet lag
approximations ( MS ). We applied a linear regression model to assess the effect of the shift schedule and the
shift by sleep pattern interaction on behavioral variables with the factor age and the factor gender (see Table 5).
Similarly, the behavioral variables were STAI, PANAS, SWLS, and PSQI.
Results
Demographic data. In total, 113 nursing professionals (registered nurses only) were enrolled in the study,
of which 61.06% (N = 69) primarily work the day shift and 38.94% (N = 44) primarily work the night shift. The
majority of participants are female (73.9%, N = 51 in day shift nurses; 70.5%, N = 31 in night shift nurses) and
have all completed a college degree or higher. Approximately 14.5% (N = 10) and 25.0% (N = 11) have attended
graduate school in day shift nurses and night shift nurses, respectively. 56.5% (N = 25) of the day shift partici-
pants and 56.8% (N = 25) of the night shift participants reported English as their native language. The day shift
and night shift groups do not differ significantly in gender (Fisher’s Exact Test odds ratio: 1.19, p = 0.829), high-
est degree earned (Fisher’s Exact Test odds ratio: 1.97, p = 0.215), and native language (Fisher’s Exact Test odds
ratio: 0.99, p = 1.000). The mean age of participants is 37.8 years (SD = 8.6, range: 23.0–65.0), with 63.7% (N = 72)
of participants 20–39 years old, and 36.3% (N = 41) of participants are above 40 years old. There is a significant
difference in age between the day shift group and night shift group (t(112) = 2.63, p = 0.010).
Scientific Reports | (2021) 11:8693 | https://doi.org/10.1038/s41598-021-87029-w 6
Vol:.(1234567890)www.nature.com/scientificreports/
SWLS STAI PSQI PA NA
Std β Std. β Std. β Std. β Std. β
Intercept − 0.69** 0.31 0.41 0.20 0.58*
Age [< 40 years] 0.20 − 0.35 − 0.48* 0.44* − 0.35
Gender [female] 0.41 − 0.02 0.19 − 0.36 − 0.37
Shift [day shift] 0.50* − 0.23 − 0.60** − 0.18 − 0.25
Sleep duration (off-day) − 0.26 0.26 0.15 − 0.14 0.07
Shift [day shift] × sleep duration (off-day) 0.34 − 0.34 − 0.25 0.04 − 0.32
Number of observations 94 94 93 94 94
Adjust R2 0.094* 0.035 0.140** 0.073* 0.051*
SWLS STAI PSQI PA NA
Std β Std. β Std. β Std. β Std. β
Intercept − 0.65* 0.28 0.68** 0.07 0.61*
Age [< 40 years] 0.22 − 0.38 − 0.46* 0.50* − 0.28
Gender [female] 0.39 − 0.02 0.19 − 0.40 − 0.41
Shift [day shift] 0.47* − 0.22 − 0.90** − 0.06 − 0.33
Sleep efficiency (off-day) 0.08 − 0.04 − 1.45** 0.79 − 0.17
Shift [day shift] × sleep efficiency (off-day) − 0.09 − 0.12 1.41** − 0.79 0.09
Number of observations 94 94 93 94 94
Adjust R2 0.053 0.020 0.202** 0.081* 0.028
Table 5. Results from the linear regression models to predict pre-study self-report variables using the physical
activity features. Statistical significance is denoted with ** p < 0.01, * p < 0.05.
Behavioral variable analyses. From the two-sample independent t-test results shown in Table 1, the day
shift group and night shift group do not differ in the STAI scores, the PANAS scores, or the personality. How-
ever, the day shift group and night shift group differ significantly in reported life satisfaction scores (day shift:
14.9 ± 3.7; night shift nurses: 16.5 ± 4.9; t(111) = 2.21, p = 0.030). From the three-way ANOVA tests, the shift
schedule ( F(1, 108) = 3.99, p = 0.048) is significant for the SWLS but the gender, the age does not have an
effect on SWLS. Additionally, night shift nurses report significantly higher PSQI scores than day shift nurses,
indicating poor sleep quality (day shift: 7.0 ± 2.0; night shift nurses: 8.4 ± 2.5; t(110) = −2.97, p = 0.004).
Similarly, the age and the gender are not significant for PSQI scores from the ANOVA analysis but the shift was
( F(1, 108) = 4.40, p = 0.038). Although shift type is not significant for openness from the independent t-test,
the three-way ANOVA analysis shows that the primary shift schedule ( F(1, 107) = 7.65, p = 0.007) is signifi-
cant for the openness with the covariates as age and gender.
Ecological momentary assessments. This analysis includes a total of 5947 of each of the affect sur-
vey responses, anxiety survey responses, and stress survey responses from the 107 participants. The aver-
age number of responses from each participant is 55.6 (range: 12−71). Figure 1 presents the distribution
of EMA responses between day shift and night shift nurses on workdays and off-days. The effect of the pri-
mary work shift is not significant on anxiety scores (t(5941) = −0.94, p = 0.351), but the work status is sig-
nificant (t(5941) = 8.71, p < 0.01). Consistent with the anxiety score, the work status is significant for stress
(t(5941) = −14.46, p < 0.01) and negative affect (t(5941) = 3.60, p < 0.01) but the primary shift pattern is not.
The interaction primary work shift × work status is not significant for negative affect, anxiety, stress but is for
negative affect (t(5941) = −2.30, p = 0.022). Post-hoc analyses reveal that the night shift group report a higher
level of negative affect on workdays than on off-days, but the difference is small (� = 0.33, p < 0.01). Such dif-
ference is not observed from the participants who primarily work day shifts.
Daily physical activity. Three-way ANOVA tests reveal that the shift factor is significant for the rest-
activity ratio on workdays ( F(1, 101) = 9.77, p = 0.002) indicating that mean rest ratio on workdays is signifi-
cantly greater for night shift group (µ = 82.4%, σ = 2.7%) than for day shift group (µ = 73.0%, σ = 2.2%).
Neither the age ( F(1, 101) = 3.73, p = 0.056) nor the gender ( F(1, 101) = 0.05, p = 0.826) are significant
for the rest-activity ratio on workdays. Moreover, the shift factor ( F(1, 91) = 7.36, p = 0.008) and age factor
( F(1, 91) = 5.06, p = 0.027) are both significant for the rest-activity ratio on off-days while the gender is not
( F(1, 91) = 0.015, p = 0.903). Main effect analyses showed that the night shift group (µ = 83.5%, σ = 2.4%)
has a higher rest-activity ratio on off-days than day shift group (µ = 76.5%, σ = 2.1%).
A three-way ANOVA test on walk-activity ratio on workdays shows that shift factor
( F(1, 101) = 4.92, p = 0.029 ) and gender factor ( F(1, 101) = 8.71, p = 0.004 ) are significant, but age
factor ( F(1, 101) = 3.34, p = 0.071) is not. The walk-activity ratio on workdays is higher in the day
shift group ( µ = 31.3% , σ = 0.9% ) than the night shift group ( µ = 27.6% , σ = 1.2% ). The three-way
ANOVA test results also suggest that the effect of shift is significant for the walk-activity ratio on off-days
(F(1, 101) = 5.16, p = 0.025), and that the day shift group (µ = 25.3%, σ = 1.1%) has a higher walk-activity ratio
Scientific Reports | (2021) 11:8693 | https://doi.org/10.1038/s41598-021-87029-w 7
Vol.:(0123456789)www.nature.com/scientificreports/
Figure 3. The figure exhibited the distribution of median sleep onset time and median wake-up between day
shift nurses (top) and night shift nurses (bottom) at workdays and free days. x axis presents the time in a day.
on off-days than night shift group (µ = 21.3%, σ = 1.2%). Lastly, the effect of shift ( F(1, 91) = 4.50, p = 0.037)
and age ( F(1, 91) = 9.76, p = 0.002) are significant on vigorous activity duration on off-days but the gender
( F(1, 91) = 0.46, p = 0.498) is not. Main effect analyses show that the day shift group has an average of 2.9 min
more rigorous activity than the night shift group on off-days. In sum, our ecological sensing method quantifies
that day shift nurses have 3.7% and 4.0% higher walk activity ratio than night shift nurses, and day shift nurses
have 2.2 min longer vigorous activity than night shift nurses.
Diurnal patterns of the the rest-activity ratio and the walk-activity ratio on workdays and off-days between
the day and night shift groups are shown in Fig. 2. From the two-way repeated ANOVA test, we observe a
main effect of shift ( F(1, 102) = 7.18, p < 0.01), time within a day ( F(5, 510) = 74.82, p < 0.01), and shift by
time interaction ( F(5, 510) = 6.79, p < 0.01) for the rest-activity ratio on workdays. Pairwise comparisons with
Fisher’s Least Significant Difference test reveal that the night shift group has a higher rest-activity ratio during
7–19 h ( p < 0.05) and a lower rest-activity ratio during 23–7 h on workdays than the day shift group ( p < 0.05).
This difference might be impacted by their distinct working schedules. Similarly, the effect of shift, time within
a day, and their interaction were also significant for the rest-activity ratio on off-days. Particularly, night shift
nurses consistently have higher rest-activity ratio during 7–19 h on off-days ( p < 0.05), which suggests potential
circadian misalignment among night shift nurses. Moreover, a two-way repeated ANOVA test reveals a main
effect of shift ( F(1, 102) = 1.17, p < 0.01), time within a day ( F(5, 510) = 178.45, p < 0.01), and shift-by-time
interaction (F(5, 510) = 24.64, p < 0.01) for the walk activity ratio on workdays. Post-hoc analysis shows that the
day shift group has more walk activity during 7–19 h ( p < 0.05) and less walk activity during 19–7 h ( p < 0.05).
Lastly, day shift group also has a higher walk activity ratio on off-days during 7–19 h ( p < 0.05), with the largest
difference (11.3%, p < 0.01) occurring within 7–11 h in a day.
Physical activity, shift, and self‑report behavioral variables. Linear regression analyses in Table 3
shows that the walk activity ratio on off-days with the age, the gender, and the shift schedule can fit a reasonable R2
score with SWLS ( F(5, 88) = 3.79, p < 0.01, adj. R2 = 0.131), PSQI ( F(5, 88) = 4.54, p < 0.01, adj. R2 = 0.160),
and PA ( F(5, 89) = 3.36, p < 0.01, adj. R2 = 0.112). The shift [Day shift] × Rest-activity ratio (off-day) is sig-
nificant for predicting PA (β = 0.57, t(89) = 2.16, p = 0.033). Moreover, the model including the walk activity
ratio (off-day) can predict SWLS (F(5, 88) = 4.07, p < 0.01, Adj. R2 = 0.142) with a reasonable R2 score. The day
shift group by walk-activity ratio on off-days has negative effect on SWLS (β = −0.62, t(88) = −3.06, p < 0.01).
Lastly, linear regression analyses (see supplementary) reveal that neither the walk activity ratio on workdays nor
its interaction with shift schedule are significant for any self-report behavioral variables.
Sleep pattern analyses. The three-way ANOVA test shows a main effect of the shift
( F(1, 90) = 65.55, p < 0.01) on sleep duration on workdays, but not the age (F(1, 90) = 0.67, p = 0.415).
The factor gender (F(1, 90) = 4.79, p = 0.031) is also significant for the sleep duration on workdays. The
estimated marginal means are 410.4 ± 7.1 min and 330.4 ± 8.4 min for night shift participants and day
shift participants, respectively (see Table 4). The effect of the shift ( F(1, 90) = 2.65, p = 0.107) and the gen-
Scientific Reports | (2021) 11:8693 | https://doi.org/10.1038/s41598-021-87029-w 8
Vol:.(1234567890)www.nature.com/scientificreports/
der ( F(1, 90) = 1.392, p = 0.241) are not significant for sleep duration on off-days, but the age is significant
( F(1, 90) = 2.65, p < 0.01). Lastly, a significant difference on MS is found between day shift and night shift
group ( F(1, 85) = 274.11, p < 0.01), with night shift group of 425.0 ± 18.4 min and day shift group of 52.5 ± 16.5.
Neither the effect of age (F(1, 85) = 2 × 10⁻³ , p = 0.960) nor the factor gender (F(1, 85) = 0.545, p = 0.462)
are significant for MS. Figure 3 presents the comparisons of sleep patterns (median sleep start time; median
sleep end time) between day and night shift groups. From the comparisons, we find that night shift nurses have
more irregular sleep onset and wake-up times than day shift nurses on days off. However, night shift nurses show
more regular sleep onset time on workdays than day shift nurses on workdays. In sum, the ecological sensing
protocol quantifies that night shift nurses sleep 80 min longer than day shift nurses on workdays, and are with an
average of 425.0 min difference between the median sleep on workdays and off-days.
Sleep pattern, shift, and self‑report baselines. Linear regression analyses reveal that although models
including sleep duration on off-days are indicative of SWLS, PSQI, and PA, neither the sleep duration on off-days
nor its interaction with shift schedule are significant in the models. Moreover, we observe that the linear regression
model including the sleep efficiency (off-day) can fit PSQI with a moderate R2 score ( F(5, 87) = 5.65, p < 0.01,
adj. R2 = 0.202). The standard β coefficients show that the higher sleep efficiency (off-day) is associated with
higher PSQI in day shift nurses (β = 1.41, t(87) = 2.78, p < 0.01). However, the sleep efficiency (off-day) is not
significant for SWLS, STAI, PA, and NA. Lastly, linear regression analyses (see supplementary) show that none of
the sleep features on workdays or their interactions with shift schedule are significant for self-report behavioral
variables.
Discussion
The analysis conducted in this work seeks to determine whether there are any measurable and significant dif-
ferences in relative sleep patterns, physical activity levels, or self-reported behavioral variables between the day
shift and night shift nursing professionals. We explored these constructs using both commercial wearable sen-
sors and surveys. When compared to many past works in studying n urses3–6,12–15,38,39, our work used ecological
sensing techniques to achieve a much longer data collection duration (10 weeks) and a much larger sample size
(n = 113). Thus, our work contributes unique insights and quantitative measures about nurses’ behavior in and
outside the workplace. Prior work provides evidence that an irregular shift schedule has an impact on the level
of life satisfaction40. Participants working night shifts in our study exhibited a social jet lag effect, resulting in an
irregular schedule. Indeed, these participants in aggregate reported a lower level of life satisfaction than their
day-shift coworkers with more regular schedules. These results, presented in Table 1, support prior studies of
nurses. With regard to the sleep quality measurements, our analysis reveals that the nurses working day shifts
report higher PSQI scores (worse sleep quality) than those working night shifts. This result is also consistent with
other works38,39. Our study further demonstrates that covariates such as age, gender, educational level, and native
language were not associated with the reported life satisfaction and PSQI scores. When we investigate the rela-
tion between shift-based differences in personality, we discover that day shift nurses reported lower neuroticism
than night shift nurses in the group with age under 40 years old. Similar to the results from previous s tudies5,41,
our findings from the baseline behavioral assessment and EMAs support that the primary shift variable (not
considering rotating shifts) is not associated with differences in anxiety, affect, or the stress levels. However, night
shift nurses reported a slightly higher level of negative affect on workdays than off-days.
Table 2 and Fig. 2 show that there is a measurable difference between day and night shift nurses in terms of
physical activity. Night shift nurses walk less often and experience more periods of physical rest than day shift
nurses both at, and outside of work. This observation is not only intuitive, since sleeping patients may need atten-
tion less often, but it is also supported by prior research work observing shift work for healthcare professionals4–6.
Table 4 highlights a differential sleep duration between day and night shift nurses on workdays. The time-to-bed
and awake time measures derived from the wearable sensors and used to calculate the mean shift ( MS ) show
clear differences in Fig. 3 in the daily sleep routines in both shift workers as well. Day shift nurses (top two plots in
Fig. 3) have similar supports and distributions of awake and bed times. Night shift nurses on work days similarly
have distributions falling within narrow (∼ around 4 h) bands of time (sleep start time: 09:52 h, range: 08:37
h–11:50 h; median sleep end time: 15:57 h, range: 13:25 h–17:43 h). On off-days, the awake and bed times for
night shift nurses are more widely distributed and have significantly different median values (sleep start time:
01:32 h, range: 21:35 h–11:43 h; sleep end time: 09:22 h, range: 09:22 h–16:04 h). This reveals the social jet lag
effect16, a type of self-imposed circadian misalignment, which occurs when night shift workers adjust their sleep
schedules on off-days to be awake during the day and able to socialize with others. Together, the results show
that passive collection of physiological data using wearable sensors in situ capably captures representations of
physical states, including circadian misalignment, which corroborate known effects from prior research studies.
Tables 3 and 5 show notable differences between day and night shift nurses when examining trends between
average daily sensor measures and initial self-assessments provided by participants at the beginning of the study
period. Table 3 and Figure 1 in the supplementary show that night shift nurses report a higher level of life satisfac-
tion compared to day shift nurses when they spend more time walking outside of work. Table 3 and Figure 1 in
the supplementary material also show a different but conceptually similar result: night shift nurses rate themselves
lower on the positive affect scale when they spend more time resting when compared to day shift nurses. These
results parallel findings in other studies on the effects of night shift work, which report reduced job satisfaction3
and a higher risk of d epression42. Table 5 shows that night shift nurses report having a better quality of sleep
(lower PSQI score) compared to day shift nurses when their sleep sessions are more efficient. This relationship
between sleep quality and efficiency is expected because the PSQI survey includes measures of sleep efficiency.
However, it is surprising that sleep quality in day shift nurses is more robust to sleep efficiency changes. This
Scientific Reports | (2021) 11:8693 | https://doi.org/10.1038/s41598-021-87029-w 9
Vol.:(0123456789)www.nature.com/scientificreports/
may be a function of the routine sleep patterns unique to day shift workers, which has been linked with higher
quality sleep43. It should also be noted that none of these interactions represent causal relationships. Assuming
that participants’ behaviors during the study period were similar to their behaviors beforehand, however, then
these observations based on passively gathered sensor data confirm those of prior research.
Some of the limitations of the study are the following. First, while the study captured the primary shift pat-
tern from the questionnaire, the pattern of the primary shift schedule was not assessed directly. For example, the
frequency of the primary shift schedule in a week (or in a month) and whether the participant rotated between
the primary shift schedule and other shift schedules was not collected. Based on communications with the par-
ticipants in the enrollment session, we estimate that nurses who rotate their shift schedules during the course
of study may have 10–20% of working shifts in their the non-primary shift schedules. Future research design
may seek to acquire these shift pattern assessments during the study to assess the impact of the shift pattern on
the behavioral variables. Second, the analysis in this work does not consider the influence of other work-related
variables, such as the work environment (work in an ICU unit or non-ICU unit), which may deferentially impact
life satisfaction, physical activity behaviors, and sleep patterns. Future research may consider studying whether
wearable measures can capture unique patterns across nursing subgroups, such as sleep variations between ICU
and non-ICU nurses. Third, the present study collected data only from 113 nurses, where the sample size may
limit the significance of the results. Future work that extends the data collection effort to recruit more partici-
pants could be considered. Fourth, the days at work information in the present study were not directly obtained
from the hospital (for privacy reasons) or from participants (to minimize the burden of compliance) but were
indirectly inferred using sensor recordings (e.g., proximity measures to location in the unit) and daily survey
assessments collected from the p articipants25. Finally, the daily burden of compliance (wearing sensors, charging
batteries, answering surveys, etc.) added several extra steps to each participant’s daily routine over the course of
the 10-week s tudy25, so there was a natural gradual decline in compliance, which may impact the quality of the
sensors data or EMA surveys. Future data collection for such longitudinal studies “in the wild” should consider
means of collecting more work-related contextual information while safeguarding private information (e.g.,
using GPS, for instance, may leak too much personal information44).
Our main goal in this work was to investigate whether commercial wearable sensors could capture the dif-
ferences in physical activity and sleep patterns between nurses that primarily work a day shift or a night shift.
We examined whether there exist unique trends between the sensor measures and behavioral assessments for
individuals on different shift schedules. In sum, the first finding of the present study is that day shift nurses report
a higher level of life satisfaction and better sleep quality than night shift nurses. Second, the wearable sensor
measurements are capable of capturing many unique differences in physical activity between the day shift and
night shift nurses. Night shift nurses show more sedentary behavior than day shift nurses both on workdays and
off-days in terms of higher rest-activity ratio and lower walking activity ratio. The night shift nurses also spend
less time engaged in vigorous activity than day shift nurses on off-days. Third, the sensor information gathered
in this work indicates that night shift nurses have more irregular sleep timings and larger circadian misalign-
ment than day shift nurses. Moreover, the sleep recordings show that night shift nurses sleep less on workdays
than day shift nurses. The supplemental analysis reveals that the night shift nurses spend more time walking
and resting on off-days, and that they report a higher level of life satisfaction and lower level of positive affect.
Data availability
The raw data generated and analysed during the current study are available and can be requested through our
data-set website (https://t iles-d
ata.i si.e du/), and the code conducted in this work is under this github repo: https://
github.com/usc-sail/tiles-day-night.
Received: 10 November 2020; Accepted: 15 March 2021
References
1. Table 7. workers by shift usually worked and selected characteristics, averages for the period 2017–2018 (2019).
2. Knutsson, A. Health disorders of shift workers. Occup. Med. 53, 103–108 (2003).
3. Ferri, P. et al. The impact of shift work on the psychological and physical health of nurses in a general hospital: A comparison
between rotating night shifts and day shifts. Risk Manag. Healthcare Policy 9, 203 (2016).
4. Costa, G. The impact of shift and night work on health. Appl. Ergon. 27, 9–16 (1996).
5. Coffey, L. C., Skipper, J. K. Jr. & Jung, F. D. Nurses and shift work: Effects on job performance and job-related stress. J. Adv. Nurs.
13, 245–254 (1988).
6. Grundy, A. et al. Light intensity exposure, sleep duration, physical activity, and biomarkers of melatonin among rotating shift
nurses. Chronobiol. Int. 26, 1443–1461 (2009).
7. Chellappa, S. L., Morris, C. J. & Scheer, F. A. Effects of circadian misalignment on cognition in chronic shift workers. Sci. Rep. 9,
1–9 (2019).
8. Kazemi, R. et al. Effects of shift work on cognitive performance, sleep quality, and sleepiness among petrochemical control room
operators. J. Circadian Rhythms 14, (2016).
9. Strohmaier, S., Devore, E., Zhang, Y. & Schernhammer, E. A review of data of findings on night shift work and the development
of dm and cvd events: A synthesis of the proposed molecular mechanisms. Curr. Diabetes Rep. 18, 132 (2018).
10. Kazemi, R. et al. Field study of effects of night shifts on cognitive performance, salivary melatonin, and sleep. Saf. Health Work 9,
203–209 (2018).
11. Kervezee, L., Cuesta, M., Cermakian, N. & Boivin, D. B. Simulated night shift work induces circadian misalignment of the human
peripheral blood mononuclear cell transcriptome. Proc. Natl. Acad. Sci. 115, 5540–5545 (2018).
12. Garbarino, S. Shiftwork. impact on health and safety in the working environment. Giornale italiano di medicina del lavoro ed
ergonomia 28, 89–105 (2006).
13. Costa, G., Accattoli, M. P., Garbarino, S., Magnavita, N. & Roscelli, F. Sleep disorders and work: guidelines for health surveillance,
risk management and prevention. La Medicina del lavoro 104, 251 (2013).
Scientific Reports | (2021) 11:8693 | https://doi.org/10.1038/s41598-021-87029-w 10
Vol:.(1234567890)www.nature.com/scientificreports/
14. Costa, G. Shift work and health: Current problems and preventive actions. Saf. Health Work. 1, 112–123 (2010).
15. Burch, J. B., Yost, M. G., Johnson, W. & Allen, E. Melatonin, sleep, and shift work adaptation. J. Occup. Environ. Med. 47, 893–901
(2005).
16. Wittmann, M., Dinich, J., Merrow, M. & Roenneberg, T. Social jetlag: Misalignment of biological and social time. Chronobiol. Int.
23, 497–509 (2006).
17. Conn, V. S., Hafdahl, A. R., Cooper, P. S., Brown, L. M. & Lusk, S. L. Meta-analysis of workplace physical activity interventions.
Am. Journal Prev. Med. 37, 330–339 (2009).
18. Aharony, N., Pan, W., Ip, C. & Khayal, I. Social fmri: Investigating and shaping social mechanisms in the real world. Pervasive Mob.
Comput. 7, 643–659 (2011).
19. Bogomolov, A., Lepri, B., Ferron, M., Pianesi, F. & Pentland, A. S. Daily stress recognition from mobile phone data, weather con-
ditions and individual traits. In Proceedings of the 22Nd ACM International Conference on Multimedia, MM ’14, 477–486 (ACM,
2014).
20. Wang, R. et al. Studentlife: Assessing mental health, academic performance and behavioral trends of college students using
smartphones. In Proceedings of the ACM International Joint Conference on Pervasive and Ubiquitous Computing, UbiComp ’14
3–14 (ACM, 2014).
21. Chaffin, D. et al. The promise and perils of wearable sensors in organizational research. Organ. Res. Methods 20, 3–31 (2017).
22. Ganesan, S. et al. The impact of shift work on sleep, alertness and performance in healthcare workers. Sci. Rep. 9, 1–13 (2019).
23. Edwards, D., Burnard, P., Coyle, D., Fothergill, A. & Hannigan, B. A stepwise multivariate analysis of factors that contribute to
stress for mental health nurses working in the community. J. Adv. Nurs. 36, 805–813 (2001).
24. Remuzzi, A. & Remuzzi, G. Covid-19 and Italy: What next?. Lancet (2020).
25. Mundnich, K. et al. Tiles-2018: A longitudinal physiologic and behavioral data set of hospital workers. Sci. Data 7, (2020).
26. Booth, B. M. et al. Multimodal human and environmental sensing for longitudinal behavioral studies in naturalistic settings:
Framework for sensor selection, deployment, and management. J. Med. Internet Res. 21, e12832 (2019).
27. L’Hommedieu, M. et al. Lessons learned: Recommendations for implementing a longitudinal study using wearable and environ-
mental sensors in a health care organization. JMIR mHealth uHealth 7, e13305 (2019).
28. Spielberger, C. D. & Gorsuch, R. L. State-trait anxiety inventory for adults: sampler set: manual, test, scoring key (Mind Garden,
1983).
29. Watson, D. & Clark, L. A. The panas-x: Manual for the positive and negative affect schedule-expanded form (Publ, Psychol, 1999).
30. Soto, C. J. & John, O. P. The next big five inventory (bfi-2): Developing and assessing a hierarchical model with 15 facets to enhance
bandwidth, fidelity, and predictive power. J. Personal. Soc. Psychol. 113, 117 (2017).
31. Buysse, D. J., Reynolds, C. F. III., Monk, T. H., Berman, S. R. & Kupfer, D. J. The pittsburgh sleep quality index: A new instrument
for psychiatric practice and research. Psychiatry Res. 28, 193–213 (1989).
32. Mackinnon, A. et al. A short form of the positive and negative affect schedule: Evaluation of factorial validity and invariance across
demographic variables in a community sample. Pers. Individ. Differ. 27, 405–416 (1999).
33. Inc., F. Fitbit charge 2.
34. Feng, T. & Narayanan, S. S. Discovering optimal variable-length time series motifs in large-scale wearable recordings of human
bio-behavioral signals. In ICASSP 2019-2019 IEEE International Conference on Acoustics, Speech and Signal Processing (ICASSP),
7615–7619 (IEEE, 2019).
35. Piercy, K. L. et al. The physical activity guidelines for Americans. JAMA 320, 2020–2028 (2018).
36. Karvonen, J. & Vuorimaa, T. Heart rate and exercise intensity during sports activities. Sports Med. 5, 303–311 (1988).
37. Al-Hazzaa, H. M., Abahussain, N. A., Al-Sobayel, H. I., Qahwaji, D. M. & Musaiger, A. O. Physical activity, sedentary behaviors
and dietary habits among Saudi adolescents relative to age, gender and region. Int. J. Behav. Nutr. Phys. Activity 8, 1–14 (2011).
38. Chang, W.-P. Influence of shift type on sleep quality of female nurses working monthly rotating shifts with cortisol awakening
response as mediating variable. Chronobiol. Int. 35, 1503–1512 (2018).
39. Dai, C. et al. The effect of night shift on sleep quality and depressive symptoms among Chinese nurses. Neuropsychiatr. Dis. Treat.
15, 435 (2019).
40. Yildirim, D. & Aycan, Z. Nurses’ work demands and work-family conflict: A questionnaire survey. Int. J. Nurs. Stud. 45, 1366–1378
(2008).
41. Øyane, N. M., Pallesen, S., Moen, B. E., Åkerstedt, T. & Bjorvatn, B. Associations between night work and anxiety, depression,
insomnia, sleepiness and fatigue in a sample of Norwegian nurses. PLoS ONE 8, e70228 (2013).
42. Angerer, P., Schmook, R., Elfantel, I. & Li, J. Night work and the risk of depression: A systematic review. Deutsches Ärzteblatt Int.
114, 404 (2017).
43. Zisberg, A., Gur-Yaish, N. & Shochat, T. Contribution of routine to sleep quality in community elderly. Sleep 33, 509–514 (2010).
44. Iqbal, M. U. & Lim, S. Privacy implications of automated gps tracking and profiling. IEEE Technol. Soc. Mag. 29, 39–46 (2010).
Acknowledgements
The research is based upon work supported by the Office of the Director of National Intelligence (ODNI), Intel-
ligence Advanced Research Projects Activity (IARPA), via IARPA Contract No 2017-17042800005. The views and
conclusions contained herein are those of the authors and should not be interpreted as necessarily representing
the official policies or endorsements, either expressed or implied, of the ODNI, IARPA, or the U.S. Government.
The U.S. Government is authorized to reproduce and distribute reprints for Governmental purposes notwith-
standing any copyright annotation thereon.
Author contributions
S.N. conceived the experiment, T.F. and B.M.B. conducted the data collection, B.B. and F.O. coordinated the
data collection. T.F. analysed the results. T.F. and B.M.B. wrote the manuscript, S.N., B.B. and F.O. reviewed the
manuscript.
Competing interests
The authors declare no competing interests.
Additional information
Supplementary Information The online version contains supplementary material available at https://doi.org/
10.1038/s41598-021-87029-w.
Correspondence and requests for materials should be addressed to T.F.
Scientific Reports | (2021) 11:8693 | https://doi.org/10.1038/s41598-021-87029-w 11
Vol.:(0123456789)You can also read