Craigieburn West PSP area - Assessment of retail/commercial demand - AWS
←
→
Page content transcription
If your browser does not render page correctly, please read the page content below
Craigieburn West PSP area
Assessment of retail/commercial demand
PREPARED FOR    Victorian Planning Authority

December 2019
Important Notice
© MacroPlan Holdings Pty Ltd All Rights Reserved. No part of this document may be reproduced,
transmitted, stored in a retrieval system, or translated into any language in any form by any means without
the written permission of MacroPlan Holdings Pty Ltd. All Rights Reserved. All methods, processes,
commercial proposals and other contents described in this document are the confidential intellectual property
of MacroPlan Holdings Pty Ltd and may not be used or disclosed to any party without the written permission
of MacroPlan Holdings Pty Ltd.

MacroPlan staff responsible for this report:
Ellis Davies, Principal – Retail
Adam Zhong, Senior Consultant – Retail

Contact
Level 16
300 Collins Street
Melbourne VIC 3000
(03) 9600 0500
info@macroplan.com.au
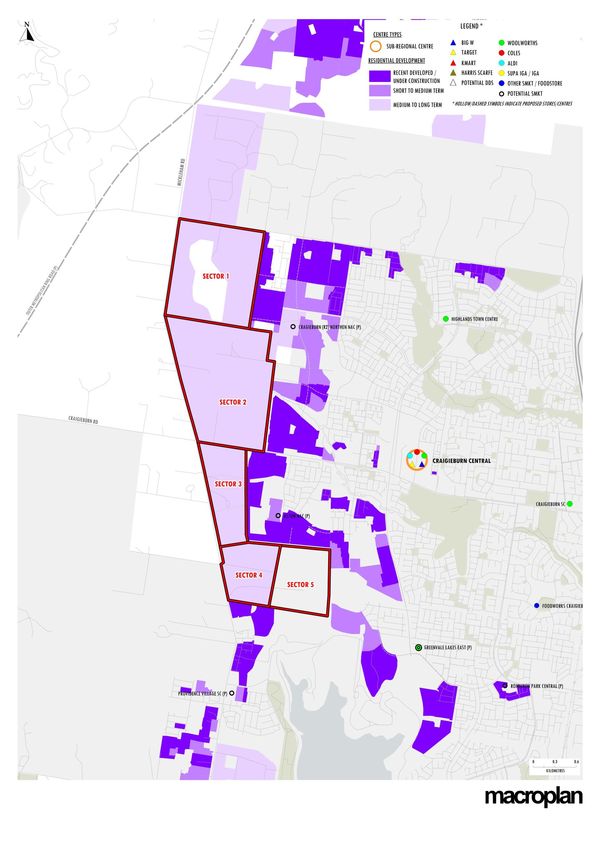
Table of contents

Executive summary ............................................................................................................................................ 1

Introduction ........................................................................................................................................................ 3

Section 1:               Regional context and case studies.......................................................................................... 4

                         1.1      Regional context ............................................................................................................ 4

                         1.2      Activity centre potential site ........................................................................................... 5

                         1.3      Main street design ......................................................................................................... 8

                         1.4      Case studies .................................................................................................................. 9

                         1.5      Retail trends..................................................................................................................13

Section 2:               Study area analysis ................................................................................................................15

                         2.1      Study area definition .....................................................................................................15

                         2.2      Study area population ...................................................................................................17

                         2.3      Socio-demographic profile ............................................................................................19

                         2.4      Retail expenditure .........................................................................................................22

Section 3:               Competition ............................................................................................................................25

                         3.1      Existing retail ................................................................................................................25

                         3.2      Proposed/ future retail ..................................................................................................26

Section 4:               Assessment of retail/commercial demand ..............................................................................27

                         4.1      Retail floorspace demand analysis ...............................................................................27

                         4.2      Recommended scale and retail mix ..............................................................................31

Section 5:               Recommendations and conclusion ........................................................................................34

Appendix ...........................................................................................................................................................35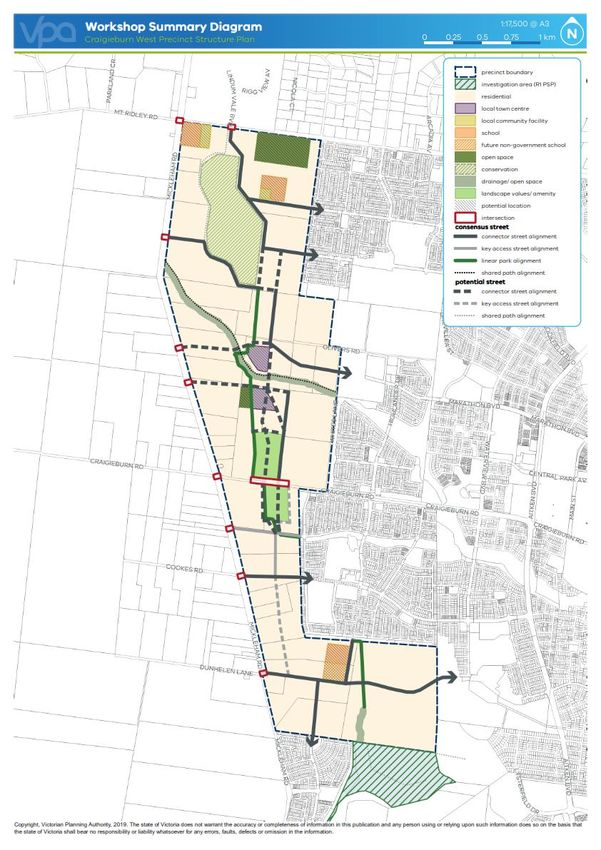
Executive summary

Context
The Victorian Planning Authority (VPA), in partnership with Hume City Council, is preparing a Precinct Structure
Plan (PSP) for the Craigieburn West Precinct which will set the vision and development guidelines of the PSP
area. The Craigieburn West PSP area has the capacity to accommodate approximately 7,370 dwellings
(assuming a yield of 20 dwellings per hectare and 65% net developable area) which could accommodate some
22,850 new residents at capacity (assuming an average household size of 3.1).

Potential location
The key aspects considered most important for the ongoing sustainability of a Neighbourhood Activity Centre at
Craigieburn West is a site that is well exposed to passing traffic and is conveniently accessible from the
surrounding area. The site should be located near, and be visible from, major north-south and east-west traffic
routes in the area. It is also particularly important that the subject site is directly accessible from Mickleham Road
from the west, given that this road will continue to be a key arterial road in the broader region, as well as be
directly accessible from outside the PSP area from the east.

Retail trends
Retail is in a period of significant flux, driven predominantly by changing consumer preferences and online
disruption, which is impacting the way products are marketed, sought out and bought by consumers. Increasing
more of the retail dollar is spent on food and lifestyle products, and less on apparel and household goods. In
terms of Neighbourhood Centres in the growth areas of Melbourne, there remains the demand for sizable centres
that can cater to the daily and weekly food and convenience retail needs of the local population. The centres are
typically anchored by a full line supermarket and include some 10-15 or more retail specialties and a mix of non-
retail services. Neighbourhood centres are becoming even more dominated by food outlets (both take-home and
eat-in) and the provision of apparel and homeware stores is now rare. The tenancy mix is also increasingly
catering for the preference of the local populations, with Asian grocery stores (commonly Indian) regularly
provided at centres located in areas with a high proportion of residents born in Asia or who have Asian heritage.

Main Street design
A number of centres developed in growth areas over the past decade or so were developed with Main Street
models, with one or more central boulevard(s) separating two or more distinct parts of the centre, primarily driven
by planning authorities throughout Australia who have been advocating for the change from the ‘enclosed’
shopping centre model. In Australia, though, some retailers and shopping centre developers have struggled to
make the Main Street model work effectively or at least as effectively as comparable enclosed centres, mostly
reflecting the increased exposure to the elements. Overall, it is considered that a main street centre could
successfully be developed at the subject site, though careful planning is recommended to ensure it meets
community expectations on comfort and protection from the environment.

Craigieburn West PSP area                                                                                            1
Assessment of retail/commercial demand
Executive summary

Population and retail expenditure growth
This study assumes that greenfield development within the Craigieburn West PSP land commences mid-2022,
with the first residents occupying dwellings by mid-2023. The Craigieburn PSP area is projected to be developed
by 2035 and be fully occupied by around 2036. This forecast equates to an average annual growth of almost
1,760 residents throughout the assumed 14-year development period, with the Craigieburn West PSP area
expected to reach capacity at mid-2036 accommodating 22,850 residents. At that date, total retail expenditure
generated by the study area population is projected to reach $400 million. Take-home food, grocery and
packaged liquor (FLG) expenditure by study area residents, which is likely the key segment of the retail market
for supermarkets, is estimated to reach $92 million at capacity in 2036.

Competition
Craigieburn Central is the highest-order shopping centre in the region, anchored by Big W and Target discount
department stores (dds), as well as Coles, Woolworths and Aldi supermarkets, providing over 54,000 sq.m of
retail floorspace. Craigieburn Central is likely to serve the discretionary non-food and entertainment needs of the
future residents of the Craigieburn West PSP area. Two Neighbourhood Activity Centres are planned in the
Craigieburn R2 PSP area, with the northern centre located within Stockland’s Highlands development, while the
southern centre is situated within Peet’s Aston estate.

Retail floorspace demand
Our retail floorspace demand analysis indicates that at 2029, or possibly as early as 2028, the Craigieburn West
Activity Centre could support a neighbourhood centre type offer with around 4,500 sq.m of retail floorspace,
anchored by a full-line supermarket (of at least 3,200 sq.m). At capacity, the catchment for the planned
Craigieburn West Activity Centre is expected to create the potential demand for some 8,000 - 9,000 sq.m of retail
floorspace at the subject site.

Centre potential
Based on the retail floorspace analysis, the current size and mix of recently developed NACs in the growth
corridors of Melbourne as well as the planned future shopping centre in the local area, it is considered that the
Craigieburn West Activity Centre can support a total centre GLA of up to 8,000 sq.m, including up to 5,850 sq.m
of retail floorspace, with a centre size of around 6,000 – 7,000 sq.m recommended. To be supportable a centre of
this scale would need to be anchored by a full-scale supermarket and could also accommodate a mini-major (e.g.
a large pharmacy or Asian grocery store) and around 10-17 retail specialty stores such as fresh food outlets, a
number of cafes/restaurants/takeaway food stores, a pharmacy, a discount variety store, a newsagency/lotto
outlet, a beauty salon and a hairdresser.

A number of non-retail uses would also be supportable at the centre such a real estate agent, a massage outlet,
a medical centre, some allied health facilities and a gymnasium, while a tavern, a service station, a fast food
restaurant on a pad site and a childcare centre are also considered to sustainable at the subject site.

Land requirements
An 8,000 sq.m shopping centre at the subject site, including allowance for a fast food restaurant on a pad site; a
tavern; a service station; as well as internal road access and carparking at the rate of 4 - 5 car spaces per
100 sq.m of floorspace, would require approximately 2.3 – 2.6 hectares. A 6,000 sq.m shopping centre would
require around 1.8 hectares of land.

Craigieburn West PSP area                                                                                         2
Assessment of retail/commercial demand

Introduction
This report presents an Assessment of retail/commercial demand generated by the future residents of the
Craigieburn Precinct Structure Plan (PSP) area and examines the scale and timing of retail facilities which could
be supported as part of the Craigieburn West Activity Centre.
The report has been prepared in accordance with instructions received from the Victorian Planning Authority and
is structured as follows:
Section 1 provides an overview of Craigieburn West PSP area and presents a thematic study of the role,
function and offer of Neighbourhood Activity Centres which have been developed across greenfield growth
areas in outer metropolitan Melbourne over the past decade.
Section 2 examines the study area likely to be served by the future Craigieburn West Activity Centre,
including estimates and forecasts of population and retail expenditure levels in the study area.
Section 3 reviews the existing and future competitive environment of the surrounding area.
Section 4 provides an Assessment of retail/commercial demand for the study area and examines the
potential scale, offer and timing of retail facilities at the future Craigieburn West Activity Centre.
Section 5 presents our recommendation and concluding remarks on the development of the future
Craigieburn West Activity Centre.
The Appendix provides some supporting information.
Craigieburn West PSP area 3
Assessment of retail/commercial demand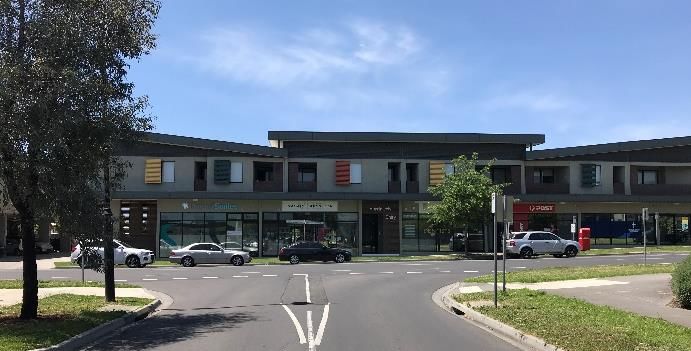
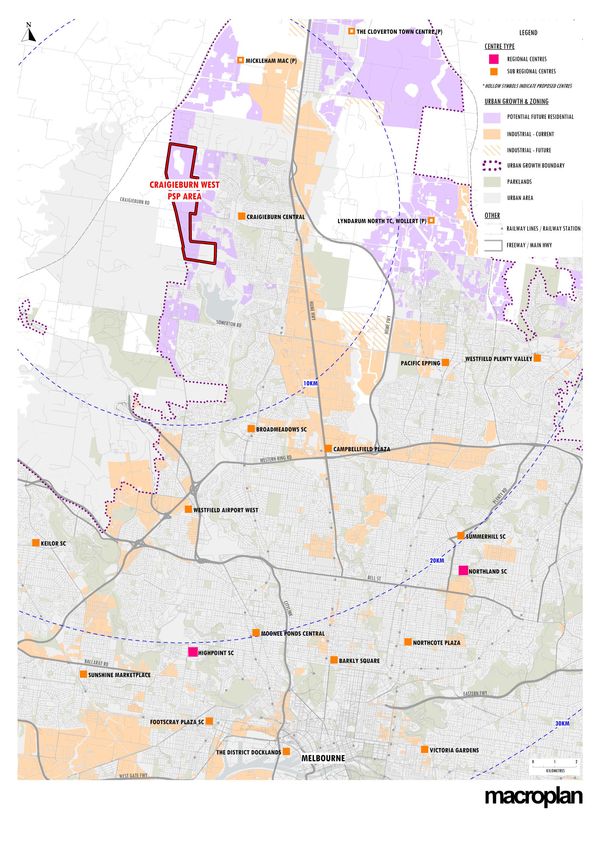
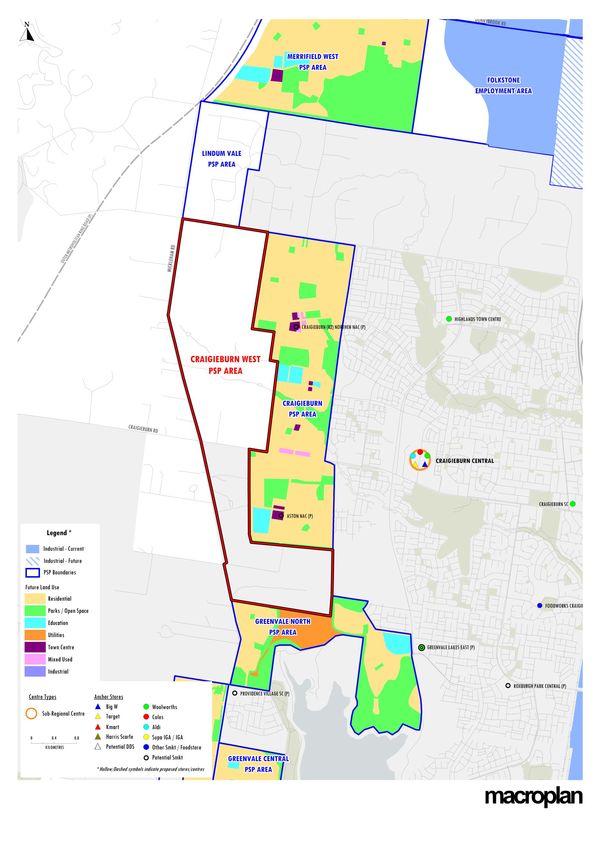
Section 1: Regional context and case studies

This section of the report provides an overview of Craigieburn West PSP area and presents a thematic study of
the role, function and offer of Neighbourhood Activity Centres which have been developed across greenfield
growth areas in outer metropolitan Melbourne over the past decade.

1.1        Regional context
The Victorian Planning Authority (VPA), in partnership with Hume City Council, is preparing a Precinct Structure
Plan (PSP) for the Craigieburn West Precinct which will set the vision and development guidelines of the PSP
area.

The Craigieburn West PSP area is located within the northern growth corridor of Melbourne and is located 30 km
north-west of the Melbourne CBD (refer Map 1.1), 2 km west of Craigieburn Central, the main higher order centre
serving the surrounding region and 4.5 km west of Craigieburn Train Station. The PSP area covers an area of
564 hectares, which including a biodiversity area of some 37.6 hectares. Taking a net developable area ratio of
70% excluding the biodiversity area, or 65.4% for the total PSP area, the area has the capacity to accommodate
7,370 dwellings (assuming a yield of 20 dwellings per hectare) equivalent to 22,850 new residents (assuming an
average household size of 3.1).

The Craigieburn West PSP area is situated immediately east of the of the Craigieburn R2 PSP area (gazetted
September 2010), which contains a net developable area of 361.2 hectares and contains the potential to yield
5,276 dwellings at capacity. The Craigieburn R2 PSP area has seen significant development during this decade,
underpinned by a continuation of Stockland’s Highland Estate, which commenced development in 2004 east of
the Craigieburn R2 PSP area and Peet’s Aston residential estate, which is planned to deliver some
1,670 traditional lots and around 200 medium density dwellings in the Craigieburn R2 PSP area. The Craigieburn
West PSP area is also located immediately south of the Lindum Vale PSP area (gazetted July 2019), which is
expected to yield 1,700 dwellings at capacity, equivalent to a future population of 5,170.

As part of the development of the Craigieburn West PSP area, an Activity Centre is planned to serve the retail
and community services needs of the growing population. Preliminary planning indicates that the future Activity
Centre will be located a short distance south of Oliver Road, and be accessible from the main north-south traffic
route which will link the PSP area. This report will present an analysis of the scale, offer and timing of the future
Craigieburn West Activity Centre and will also provide recommendations for the ideal location of the Activity
Centre, which will allow the future centre to perform its role in serving the main weekly food, grocery and
convenience-oriented needs of its catchment.

Craigieburn West PSP area                                                                                           4
Assessment of retail/commercial demand

Section 1: Regional context and case studies
1.2 Activity centre potential site
Location is a key consideration for activity centres, and the precise location can have direct and major
implications for the scale of centre supportable at the nominated site. In our experience on working on numerous
supermarket-based centres across the nation, the key location attributes required for the centres to trade well are
as follows:
A site which is easy and convenient to accessible for the local population. This ensures that local residents
associate strongly with the centre and use it as one of their main centres for food and grocery shopping.
A site with exposure to passing traffic, generally on a significant traffic route. In general, shopping centres
located on internal sites without good exposure to passing traffic can underperform. Consumers often
undertake shopping at centres which are located on traffic routes that they already use, whether on their way
have from work or when travelling to other destinations. Centres located on major traffic routes also capture
more business from visitors to the area.
A site which is readily accessible and centrally located to a sizable catchment. For a neighbourhood centre
anchored by a full-scale supermarket to trade successfully it needs to be the most convenient centre for
around 8,000 to 10,000 residents.
The key aspects considered most important for the ongoing sustainability of a Neighbourhood Activity Centre at
Craigieburn West is a site that is well exposed to passing traffic and is conveniently accessible from the
surrounding area. The site should be located near, and be visible from, major north-south and east-west traffic
routes in the area. It is also particularly important that the subject site is directly accessible from Mickleham Road
from the west, given that this road will continue to be a key arterial road in the broader region, as well as be
directly accessible from outside the PSP area from the east.
Preliminary planning for a potential location of the Craigieburn West Activity Centre is illustrated on the indicative
PSP plan for the area, as included in the Appendix. The plan shows the possible locations for a future Activity
Centre, which are centrally located within the PSP area, a short distance south of the possible future extension of
Oliver Road from the east.
This office agrees with this indicative location for the site of a future Neighbourhood Activity Centre for the
following reasons:
The site is centrally located to a sizable catchment population and a future shopping centre at the site would
be able to serve a sufficiently large walkable catchment. Furthermore, the future centre at the nominated site
would be the most convenient centre for surrounding local residents and would serve the majority of the PSP
area.
The site is located a sufficient distance from other designated shopping centres in the area, most notably
Craigieburn Northern NAC (Stockland) to the north-east and Aston NAC to the south-east.
The site is located at the intersection of relatively major north-south and east-east traffic routes, and in
particular it would be directly accessible from Mickleham Road to the west and from outside the PSP area to
the east.
Craigieburn West PSP area 5
Assessment of retail/commercial demand
Map 1.1:Craigieburn
         CraigieburnWest PSP area West               6
            Assessment of retail/commercial demand
Regional context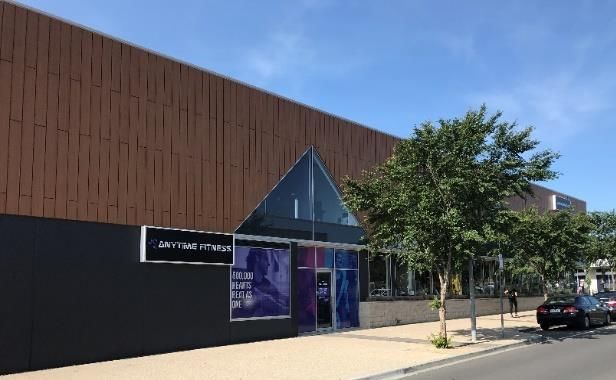
Map 1.2:Craigieburn
         CraigieburnWest PSP area
                                  West            7
Local context
         Assessment of retail/commercial demand
Section 1: Regional context and case studies 1.3 Main street design A number of centres developed in growth areas over the past decade or so were developed with Main Street models, with one or more central boulevard(s) separating two or more distinct parts of the centre. For a number of years now planning authorities throughout Australia have been advocating the need to replace the traditional ‘enclosed’ shopping centre model, which has been built and operated at many locations across Australia over the past 50 years, with open air, main street-based activity centres. This change in approach is largely related to a generally held view by many, if not most, planners that such open-air centres will be more successful in creating integrated, mixed use, successful community hubs. In Australia, though, some retailers and shopping centre developers have struggled to make the neo-main street centre work effectively or at least as effectively as comparable enclosed centres, both from a retail/shopping amenity point of view, and also from a feasibility point of view. Antidotally, concerns about main street centres relates to: Being exposed to vehicular traffic, especially for care with young children; Being exposed to the noise and pollution associated with passing traffic; and Exposure to weather elements, particularly in winter. These concerns have likely led to some main street model centres, such as Craigieburn Central, to underperform relative to peer centres. Research undertaken on this matter provides some insight as to why some customers preferred an enclosed shopping centre, with the key points summarised as follows: One stop shopping; Access and parking; Undercover from elements; Safe and secure environment; Clean and available amenities; Facilities for special needs, disabled, elderly, young mothers; and Selection and variety. Some main street model shopping centres however, have performed strongly, and it is likely that main street shopping centres require more planning and active management to enhance its strengths and alleviate customer concerns on its weaknesses. Stockland Point Cook, for example, pedestrianises its main street during the warmer months with a pop-up park. Artificial turf is laid over the concrete main street, while children’s play areas, outdoor seating, live music and movie screenings are provided, repositioning the shopping centre as a key destination of community focus. Therefore, a main street centre could successfully be developed at the subject site, though careful planning is recommended to ensure it meets community expectations on comfort and protection from the environment. Craigieburn West PSP area 8 Assessment of retail/commercial demand
Section 1: Regional context and case studies
1.4 Case studies
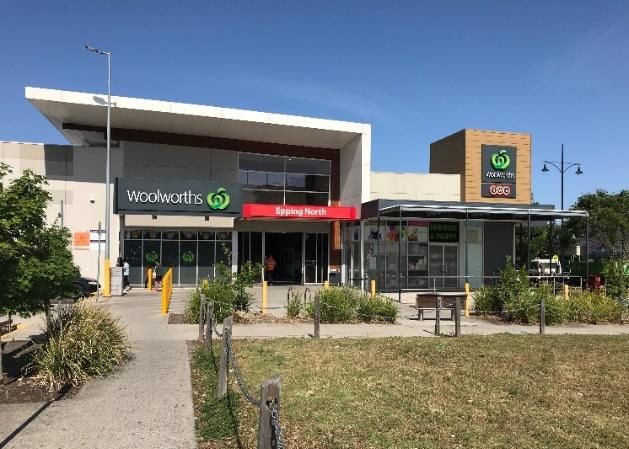
As part of this assessment, Macroplan has conducted over 20 physical inspections of Neighbourhood Activity
Centres developed over the last decade in Melbourne’s western, northern and south-eastern greenfield growth
corridors (refer to the Appendix for some images). Table 1.1 presents the average number and type of specialty
retailers by retail category from the inspected centres as well as a summary of the most common uses, while
Table 1.2 presents the count of non-retail uses present at these centres. A supply audit of retail and non-retail
uses of inspected centres are provided on Appendix Table A1-A3.
The following provides a summary of the key themes regarding the composition and offer of Neighbourhood
Activity Centres which emerged from our site visits.
1. The main role and function of Neighbourhood Activity Centres in growth areas is still to serve the
daily/weekly food, grocery and convenience-oriented needs of residents in the surrounding area. Most
Neighbourhood Activity Centres are anchored by full-line supermarkets of 3,200 sq.m or more, operated by
one of the two main supermarket brands in Australia – Woolworths or Coles. It is uncommon for
Neighbourhood Activity Centres to be anchored by only Aldi or IGA supermarkets, predominantly due to
constraints in the formats these retailers operate. Aldi generally operates stores between 1,500 sq.m to
1,800 sq.m, while IGA operates a number of formats ranging from a convenience style offer of 400 sq.m to
a more comprehensive offer up to 1,500 - 2,500 sq.m. As a general rule of thumb, Neighbourhood Activity
Centres with a full-line supermarket anchor require a catchment population of between 8,000 to 10,000
residents. IGA supermarkets or similar formats generally serve the food and grocery needs of residents in
more localised catchments, while Aldi supermarket provide a somewhat different role are serve catchments
of around 30,000 to 50,000 residents.
Aldi and IGA sometimes play the role of a secondary supermarket anchor (if Woolworths or Coles already
trade at the centre), which often given catchment residents greater choice in the supermarket shopping, but
also intensifies the offer of the centre, providing a distinct point of difference to other competing centres in
the surrounding area. The development of a second supermarket anchor only likely proceeds if the main
catchment population reaches around 15,000.
2. The supermarket anchors at Neighbourhood Activity Centre are typically supported by 10-15 or more
convenience-oriented retail specialties. As Australians are increasingly health conscious and taking an
added interest in how food is produced, a modern fresh food precinct (containing green grocers, butchers,
fishmongers, bakeries) surrounding the supermarket, typically supplements the more generic fresh food
offer of the anchor. Other specialty uses commonly seen in Neighbourhood Activity Centre are
predominantly convenience-oriented and include uses such as pharmacies and discount variety stores, as
well as hairdressers, beauty salons, and dry cleaners.
3. While there is some evidence of discretionary non-food specialties in the apparel and household goods
categories, these are generally independent operators competing on price and are often of low quality.
Apparel retailers typically locate in regional and to a lesser extent, sub-regional centres, where a critical
mass (of around 20 labels or more) creates a significant draw for the centre, offering a comparative
shopping experience. Household goods are generally located at large format retail/homemaker centres,
where the lower rents allow retailers in bedding, furniture to showcase their extensive ranges and designs.
Craigieburn West PSP area 9
Assessment of retail/commercial demandSection 1: Regional context and case studies
4. Over the last decade, there has been a significant interest in new food and beverage concepts. The spectre
of social media and the push for a more experiential economy has meant that consumers are willing to pay
that little bit extra for a unique and well-executed café/ restaurant concept. Regional centres (and to a lesser
extent sub-regional centres) has sought to capitalise on this trend by introducing dining precincts, revamped
food courts, with food & beverage now acting as a destinational draw for the centre. This trend, however, is
not evident at Neighbourhood Activity Centres due to the differing role food catering plays. At
Neighbourhood Activity Centres, food catering does not act as a destinational attractor, rather as an added
amenity. This typically encompasses a small provision of between 3-6 food catering tenants, generally
consisting of on-the-go takeaway food (such as Subway or independent operators serving Asian-oriented
cuisine, fish ‘n’ chips and rotisserie chicken), as wells as 1 or 2 quality cafes which offer both takeaway and
eat-in options.
5. Although not all Neighbourhood Activity Centres contain mini-majors (tenancies over 400 sq.m), there is
some evidence of such tenants at Neighbourhood Activity Centres. Mini-majors effectively solidify the draw
of the shopping centre, acting as an additional attractor the centre. Due to the role of Neighbourhood
Activity Centres in serving the main food, grocery and convenience-oriented needs of residents in its
catchment, mini-major uses at Neighbourhood Activity Centre reinforce this draw, with large green grocers,
pharmacies and discount variety stores the most prominent mini-major use.
6. Our inspections of Neighbourhood Activity Centres revealed a number of non-retail uses, many of which act
as an added amenity which solidifies the convenience-oriented draw of a centre. Some of the below uses,
particularly medical centres and gymnasiums, and often provided on the upper level of Activity Centres. The
following summarises the most commonly seen non-retail uses at Neighbourhood Centres and the rationale
for their presence.
Medical
With a growing proportion of expenditure going toward healthcare costs, medical centres are an
increasingly important use in Activity Centre developments. Medical centres play an important role in
generating a steady flow of people to locations, with obvious benefits for retailers, particularly a pharmacy.
Medical centres attract all population segments, though the most important customer groups are elderly
residents and young children and are particularly relevant for greenfield growth areas, which typically
accommodates a high proportion of young, traditional families.
Fitness centre/gymnasium
The growing health and wellbeing sector presents an opportunity to provide a gymnasium or a fitness centre
at activity centres. Such a facility greatly adds to the offer at activity centres and can be used by a broad
range of residents in the area. Gymnasiums have the potential to drive activity outside of typical retail hours
and can contribute to the overall amenity of the centre. The addition of a gymnasium further adds to the
amenity and convenience offer of Neighbourhood Activity Centre.
Childcare centre
In dual income family structures, there would be strong demand for childcare services, particular in
greenfield growth areas which typically accommodate a high proportion of young traditional families.
Craigieburn West PSP area 10
Assessment of retail/commercial demandSection 1: Regional context and case studies
Table 1.1
Melbourne growth area neighbourhood centres - number of retailers by category
Category Smkts Mini-majors FLG Food Apparel Household Leisure General Retail Total
catering services specs.
Avg. number of specs. 1.2 2.9 6.2 0.1 0.1 0.4 1.9 2.2 14
Most common retail uses Liquor Café Newsagent Pharmacy Hairdresser
Bakery Fish & Chips Discount variety Beauty salon
Butcher Pizza
Indian grocer Indian takeaway
Greengrocer Charcol Chicken
Noodle
Kebab
Other Asian
Northern Growth Corridor
Laurimar Town Centre WOW 5 7 1 0 1 3 5 22
Discount
Mernda Village WOW 3 6 0 0 0 0 0 9
Chemist
Chemist
Mernda Junction SC Coles 3 5 0 0 0 1 2 11
Warehouse
Mill Park Lakes SC Coles 1 4 0 0 0 0 1 6
Epping North SC WOW 4 8 0 0 1 2 1 16
Aurora Village Coles, Aldi 4 7 0 0 0 2 4 17
South-Eastern Growth Corridor
Pharmacy
Marriott Waters WOW, Aldi 4 10 0 0 1 2 2 19
Select
Springhill SC Coles 3 4 0 0 1 2 3 13
Hunt Club Village WOW, Aldi 1 4 0 0 0 3 3 11
Shopping on Clyde Coles 2 7 0 1 0 4 3 17
Selandra Rise SC WOW 1 3 0 0 1 3 3 11
Chemist
The Avenue Village SC WOW 5 7 0 0 0 2 2 16
Warehouse
The Reject
Shop;
Arena SC WOW 1 9 1 0 0 1 3 15
Discount
Chemist
Cardinia Lakes SC Coles 3 5 0 0 1 1 2 12
Lakeside Square WOW 1 7 0 0 0 3 2 13
Western Growth Corridor
Chemist
Tarneit Gardens SC WOW 4 6 0 0 0 1 2 13
Warehouse
Tarneit West Village SC Coles 2 4 0 0 0 1 1 8
Wyndham Vale Square WOW, Aldi 3 1 0 1 0 2 1 8
Featherbrook SC WOW 5 13 0 0 1 2 4 25
Soho Village Alamanda IGA 1 4 0 0 0 0 0 5
Williams Landing SC WOW 5 9 0 0 1 4 3 22
Source: MacroPlan
Craigieburn West PSP area 11
Assessment of retail/commercial demandSection 1: Regional context and case studies
Table 5.2
Count of inspected Neighbourhood Activity Centres which conatins non-retail uses
Uses Count*
Non-retail
Medical centres 16
Dental/allied health** 12
Fitness centres/Gym 10
TAB/Tatts 8
Real estate agents 7
Personal services*** 7
Education/Tutoring/Learning Centres 6
Childcare 5
Laundromat 5
Offices 3
Accountants 3
Banks/financial outlets 2
Australia Post 1
Travel agents 1
Mortgage brokers 1
* Out of 21 inspected Neighbourhood Activity Centres
** Allied health uses include physiotherapists, pathologists, chiropractors amd naturopaths
*** Persoanl services include massages, and skincare clinics
Source: MacroPlan
Craigieburn West PSP area 12
Assessment of retail/commercial demandSection 1: Regional context and case studies
1.5 Retail trends
This sub-section provides a high-level overview of the state of the Australian retail market and the drivers
underpinning change in the sector. Some key retail trends are as follows:
Retail is in a period of significant flux, driven predominantly by changing consumer preferences and online
disruption, which is impacting the way products are marketed, sought out and bought by consumers.
There is a shift in values and behaviours, as retail becomes more experiential following consumer demand for
new experiences - lifestyle, travel and food. Food & beverage presents a strong test case of the change in
overall retail – with consumer demand for new concepts/cuisines driving growth in destination casual dining.
Australia’s population is ageing, resulting in an increased demand for medical services, localised/accessible
amenities and community hubs, town centres/villages (social connections).
Smaller format fashion retailing is being replaced by more productive usages including food & beverage and
services, offering a strong local and community perspective. This shift has been evident in shopping centres
with a regional draw, where floorspace dedicated to apparel (a key category of online disruption) is replaced
by new dining offers and retail services.
Town centres, integrated or mixed-use precincts are becoming more common, with a range of ‘non-retail’
elements, broadening appeal and customer base, as well as increasing spend and dwell time. Entertainment
Leisure Precincts (ELPs) are growing, usually underpinned by cinemas and extensive food & beverage, while
some new entertainment concepts are emerging.
Design is critical, capturing the essence of these initiatives and optimising the alfresco experience where
possible. Unresponsive centres and retail precincts are experiencing reduced footfall and losing market share
in the face of more relevant competition.
Online retailing continues to grow strongly, however some retail uses are currently mostly immune to online
disruption including food, liquor and groceries (FLG), food and beverage, retail services, medical and
fitness/health centres. Uses most vulnerable to online disruption include apparel and footwear, department
stores and discount department stores, books and electrical retailers. Therefore, at present, impacts from
online retailing on Neighbourhood Activity Centres is far less than for higher-order shopping centres.
In terms of the performance of the retail market in Australia, the key points to note are summarised as follows:
Total retail sales across Australia have grown at an average annual rate of 5% since the turn of the century,
although over the past 3 years growth has averaged around 3% per annum.
This growth has been underpinned by the ongoing increases in food retailing and food & beverage, which
have grown by an average annual rate of 4% and 4% respectively, over the last decade. However, growth
across non-food has generally been more moderate, dragged down by very limited growth in department
stores (average annual growth of 0.3% over last 10 years).
Craigieburn West PSP area 13
Assessment of retail/commercial demandSection 1: Regional context and case studies
The advent of a number of economic and cultural factors, such as social media, food TV shows, shifting
attitudes and more supply, has fostered an explosion of food catering and dining over the past decade.
Consumers are generally willing to spend a little bit extra for unique food and ‘experiential’ dining concepts as
well as ambience and presentation.
An increasing share of household weekly spending is being allocated to non-retail uses, fuelled by an aging
population who both require increased healthcare and orient their spending towards the high value
experiential items, such as overseas travel. The share of non-retail uses has increased from around 60% in
1984 to 72% in 2019.
In terms of Neighbourhood Centres in the growth areas of Melbourne, there remains the demand for sizable
centres that can cater to the daily and weekly food and convenience retail needs of the local population. The
centres are typically anchored by a full line supermarket and include some 10-15 or more retail specialties and a
mix of non-retail services. The overall retail trends has seen the tenancy mix of the neighbourhood centre
change, with centres now more dominated by food outlets (both take-home and eat-in) and the provision of
apparel and homeware stores is now rare. The tenancy mix is also increasingly catering for the preference of the
local populations, with Asian grocery stores (commonly Indian) regularly provided at centres located in areas with
a high proportion of residents born in Asia or who have Asian heritage.
Craigieburn West PSP area 14
Assessment of retail/commercial demandSection 2: Study area analysis
This section of the report examines the study area likely to be served by the future Craigieburn West Activity
Centre, including estimates and forecasts of population and retail expenditure levels in the study area.
2.1 Study area definition
The extent of a study area or catchment that is served by a shopping centre, or retail facility, is shaped by the
interplay of a number of critical factors. These factors include:
i. The relative attraction of the retail facility or centre, in comparison with alternative competitive retail facilities.
The factors that determine the strength and attraction of any particular centre are primarily its scale and
composition (in particular the major trader or traders that anchor the centre); its layout and ambience; and
car-parking, including access and ease of use.
ii. The proximity and attractiveness of competitive retail tenants, or centres. The locations, compositions,
quality and scale of competitive retail facilities all serve to define the extent of the study area which a
shopping centre or retail facility is effectively able to serve.
iii. The available road network and public transport infrastructure, which determine the ease (or difficulty) with
which customers are able to access a shopping centre, or retail facility.
iv. Significant physical barriers which are difficult to negotiate, and can act as delineating boundaries to the
study area served by an individual shopping centre, or retail facility.
Map 2.1 illustrates the study area defined for the Craigieburn West Activity Centre which contains five sectors.
The study area defined for the Craigieburn West Activity Centre encompasses the entirety of the Craigieburn
West PSP area and reflects the potential retention of retail expenditure the future Activity Centre can reasonably
capture. Key determinants on the retail retention rates for the Craigieburn West Activity Centre include the
distance and ease of access to future Activity Centre, as well as the location of the surrounding network of
existing and planned competitive centres.
The currently indicative site for the Craigieburn West Activity Centre is expected an appropriate location to serve
the main weekly food, grocery and convenience-oriented needs of the future residents of Craigieburn West PSP
area. The future centre would be the main retail centre serving Sector 2 residents, however, retail expenditure
retention rates are expected to be slightly lower Sector 1 and Sector 3 residents, assuming that Highland East
NAC and Aston NAC are developed Future residents in these sectors would be able to choose between the
Craigieburn West Activity Centre and the other shopping centres based on the scale and preference of
supermarket operator for example. Retention rates are expected to be further lower for the future residents of
Sector 4 and 5 due its proximity to the Aston NAC.
Craigieburn West PSP area 15
Assessment of retail/commercial demandMap 2.1:Craigieburn
CraigieburnWest PSP area
West 16
Trade areaAssessment of retail/commercial demand
and competitionSection 2: Study area analysis
2.2 Study area population
Table 2.1 details the estimated current and future population levels within the Craigieburn West Activity Centre
study area. The information for population estimates and forecasts has been collected from a range of sources,
including the following:
Australian Bureau of Statistics Census of Population and Housing 2016;
Australian Bureau of Statistics Estimated Residential Population Data (ERP) (2016-18);
Victoria in Future 2019 population projections prepared by the Victorian Government;
Forecast.id population projections prepared for the City of Hume (updated November 2017); and
Other investigations of future residential development, undertaken by this office.
As of mid-2016, there were no occupied residential dwellings within the study area. It is understood that
Stockland and Peet, the major landowners of the Craigieburn West PSP, are keen to start development as soon
as the planning process for the area has been completed. For the purposes of this assessment, it is assumed
planning for the Craigieburn West PSP will be completed by mid-2021 and the first dwellings constructed on PSP
land to be completed by mid-2022. A further 12 months lag has been applied for the occupation of completed
dwellings, while the average household size per dwellings has been assumed to be 3.1 (which is the figure
currently adopted by the VPA to reflect the likely trend of young families in moving into outer growth areas such
as the Craigieburn West). Finally, a net developable ratio of 65% has been applied to all land within the PSP
area, with a yield of 20 dwellings per hectare applied. The expected development status of each sector are
summarised as follows, while Appendix Table A4 presents the underlying dwelling and growth assumption of
these sectors:
Sector 1 contains 124 hectares (excluding a non-developable biodiversity area of 38 hectares). The sector
encompasses the capacity to accommodate approximately 1,650 dwellings or 5,100 residents at capacity and
is assumed to commence development in 2022, with the first residents moving into the sector at mid-2023.
The sector is forecast to possess a development timeline of 8 years and is assumed to be fully occupied
by mid-2031.
Sector 2 is the largest sector in the defined study area and encompasses the capacity to accommodate over
3,100 dwellings or 9,650 residents upon completion. Like Sector 1, Sector 2 is likely to be one of the first to
commence development, as it contains the site for the future Craigieburn Activity Centre. Sector 2 is likely to
start development in mid-2022, and is forecast to possess a development timeline of 11 years, commencing
with 100 dwellings developed per annum before ramping up to 400 dwellings developed by annum. It is
therefore assumed that the dwellings within the Sector will be completed by mid-2033 and be fully occupied
by mid-2034.
Sector 3 encompasses the capacity to accommodate 930 dwellings, equivalent to a capacity population of
2,900. The Sector is assumed to commence development in 2022, and is forecast to be completed over a
5 year period. Dwellings within the Sector are expected to be completed by mid-2026 with the Sector fully
occupied by mid-2027.
Sector 4 encompasses the capacity to accommodate 780 dwellings, equivalent to a capacity population of
2,400. The Sector is projected to commence development once Sector 1, 2 and 3 are well underway in 2026,
and is forecast to be developed over a 5 year period. Dwellings within the Sector are expected to be
completed by mid-2030 with the Sector fully occupied by mid-2031.
Craigieburn West PSP area 17
Assessment of retail/commercial demandSection 2: Study area analysis
While the land on Sector 5 is part of the PSP planning process, it is uncertainty if the owners, which operate
Aitken Hill Conference Centre, will develop the land for residential uses. If residential development were to
occur, it is likely to commence once significant progress has already been made on the Craigieburn West
PSP land. For the purposes for this assessment, it is assumed residential development will commence in
2030, with the development of the Sector completed by mid-2035 and fully occupied by 2036.
Based on the scenario outlined above, greenfield development on Craigieburn West PSP land is projected to
commence mid-2022, be completed by 2035 and fully occupied by 2036. This scenario equates to an average
annual growth of almost 1,760 residents throughout the 14 year development period, with the Craigieburn West
PSP area reaching a capacity of 22,850 residents at mid-2036.
Table 2.1
Craigieburn West PSP area study area population, 2011-2036*
Estimated population Forecast population
Study area sector 2016 2019 2021 2026 2031 2036 Capacity
Sector 1 0 0 0 1,850 5,100 5,100 5,100
Sector 2 0 0 0 2,150 5,900 9,650 9,650
Sector 3 0 0 0 2,500 2,900 2,900 2,900
Sector 4 0 0 0 0 2,400 2,400 2,400
Sector 5 0 0 0 0 450 2,800 2,800
Total study area 0 0 0 6,500 16,750 22,850 22,850
Average annual growth (no.)
Study area sector 2011-16 2016-19 2019-21 2021-26 2026-31 2031-36
Sector 1 0 0 0 370 650 0
Sector 2 0 0 0 430 750 750
Sector 3 0 0 0 500 80 0
Sector 4 0 0 0 0 480 0
Sector 5 0 0 0 0 90 470
Total study area 0 0 0 1,300 2,050 1,220
Average annual growth (%)
Study area sector 2011-16 2016-19 2019-21 2021-26 2026-31 2031-36
Sector 1 0.0% 0.0% 0.0% 0.0% 22.5% 0.0%
Sector 2 0.0% 0.0% 0.0% 0.0% 22.4% 10.3%
Sector 3 0.0% 0.0% 0.0% 0.0% 3.0% 0.0%
Sector 4 0.0% 0.0% 0.0% 0.0% 0.0% 0.0%
Sector 5 0.0% 0.0% 0.0% 0.0% 0.0% 44.1%
Total study area 0.0% 0.0% 0.0% 0.0% 20.8% 6.4%
*As at June
Source: ABS Census 2016; Victoria In Future 2019; Forecast.id; MacroPlan
Craigieburn West PSP area 18
Assessment of retail/commercial demandSection 2: Study area analysis 2.3 Socio-demographic profile There were no residents residing in the Craigieburn West PSP area at the time of the 2016 Census. Therefore, in order to determine the expected socio-demographic profile of residents likely to live in the area, we have examined the profile of residents of Craigieburn, which have been split into the proxy Craigieburn East and West sectors, separated by Aitken Boulevard. The proxy west sector has seen significant population growth over the latest intercensal period as a result of residential developments as is seen as an indicative guide to the socio- demographic profile of the future residents of Craigieburn West, whereas the proxy east sector is more established. Table 2.2 and Chart 2.1 detail these socio-demographic profiles, as well as those of metropolitan Melbourne and Australia as comparisons. This data is sourced from the 2016 ABS Census of Population and Housing. The socio-demographic profiles of these areas are likely to represent a similar anticipated population profile to the future residents of the Craigieburn West PSP area. The socio-demographic profile is reflective of a young population living in traditional family units in their early life stages, who are attracted to the area by the affordability and types of housing in the new residential estates in the region. Compared with metropolitan Melbourne, this population is significantly younger, have lower than average incomes levels and generally own their own homes with a mortgage. The proxy west sector contains residents who are younger and a higher percentage of renters than Craigieburn East, generally reflective of a recent greenfield growth area. Average incomes, however, are higher in the proxy west sector than the proxy east sector on a per household basis, possibly indicating that the newer residents of Craigieburn consist of more skilled and higher paid workers who have been priced out of other metropolitan areas. The proportion of Australian born residents is also below average, with the proxy west sector in particular, containing an above average representation of Indian born residents. Craigieburn West PSP area 19 Assessment of retail/commercial demand
Section 2: Study area analysis

                                                                Table 2.2
                                     Craigieburn West - Proxy socio-demographic profile, 2016

                                           Proxy                    Proxy           Melb Metro     Aust.
  Census item                            East sector             West sector            avg.       avg.

  Per capita income                        $28,703                  $29,641            $41,365     $39,800
  Var. from Melb Metro bmark                 -30.6%                   -28.3%

  Avg. household income                    $93,241                  $97,995           $108,488    $101,610
  Var. from Melb Metro bmark                 -14.1%                    -9.7%

  Avg. household size                           3.2                         3.3             2.6        2.6

  Age distribution (% of population)
  Aged 0-14                                  24.6%                    28.9%              18.3%      18.7%
  Aged 15-19                                  7.5%                     5.1%               6.0%       6.1%
  Aged 20-29                                 15.2%                    17.6%              15.5%      13.8%
  Aged 30-39                                 17.3%                    25.2%              15.5%      14.0%
  Aged 40-49                                 14.0%                    10.9%              13.9%      13.5%
  Aged 50-59                                 11.5%                     6.2%              12.0%      12.7%
  Aged 60+                                    9.9%                     6.2%              18.8%      21.1%
  Average age                                  31.8                     28.0               37.6       38.6

  Housing status (% of households)
  Owner (total)                              73.3%                    67.6%              68.5%      67.4%
  • Owner (outright)                         19.4%                     6.7%              31.4%      31.9%
  • Owner (with mortgage)                    53.9%                    60.9%              37.1%      35.5%
  Renter                                     26.5%                    31.5%              30.9%      31.8%

  Birthplace (% of population)
  Australian born                            61.0%                    47.0%              63.9%      71.9%
  Overseas born                              39.0%                    53.0%              36.1%      28.1%
  • Asia                                     17.6%                    30.0%              17.3%      11.2%
  • Europe                                    6.1%                     3.6%              11.0%       9.6%
  • Other                                    15.3%                    19.5%               7.8%       7.4%

  Family type (% of population)
  Couple with dep't child.                   58.4%                    66.3%              47.8%      44.8%
  Couple with non-dep't child.                9.3%                     4.0%               8.3%       7.7%
  Couple without child.                      12.8%                    15.0%              20.7%      22.8%
  One parent with dep't child.               10.5%                     7.9%               7.8%       8.8%
  One parent w non-dep't child.               3.9%                     2.5%               3.9%       3.7%
  Lone person                                 4.4%                     3.5%              10.2%      11.0%

  Car ownership
  % 0 Cars                                    5.9%                     5.7%               9.0%       7.7%
  % 1 Car                                    36.7%                    40.7%              35.9%      36.1%
  % 2 Cars                                   42.1%                    40.7%              37.8%      37.5%
  % 3 Cars                                   10.3%                     9.2%              11.4%      12.2%
  % 4 plus Cars                               5.0%                     3.7%               5.9%       6.5%
  Source: ABS Census of Population & Housing, 2016; MacroPlan

Craigieburn West PSP area                                                                                    20
Assessment of retail/commercial demand
Section 2: Study area analysis
Chart 2.1
Craigieburn West PSP area - Proxy socio-demographic profile, 2016
Age distribution
35%
29% Proxy East sector Proxy West sector Melb Metro Aust. Avg.
30%
25% 25%
25% 21%
19% 18% 19%
20% 18% 17%
15% 16% 15% 14% 14%
14% 14% 14% 13%
15% 11% 12% 12%
10%
10% 7% 6%
5% 6% 6% 6%
5%
0%
Aged 0-14 Aged 15-19 Aged 20-29 Aged 30-39 Aged 40-49 Aged 50-59 Aged 60+
Income levels
$120,000 $108,488
Proxy East sector Proxy West sector $97,995 $101,610
$93,241
$100,000
Melb Metro Aust. Avg.
$80,000
$60,000
$41,365 $39,800
$40,000 $28,703 $29,641
$20,000
$0
Per capita income Avg. household income
Country of birth
80% 72%
Proxy East sector Proxy West sector
61% 64%
60% Melb Metro 53% Aust. Avg.
47%
39%
40% 36%
28%
20%
0%
Australian Born Overseas Born
Family type
66%
70%
58% Proxy East sector Proxy West sector
60%
50% 48% 45% Melb Metro Aust. Avg.
40%
30% 23%
21%
20% 15%
13% 10%8% 11%
9% 8% 9% 10%
4% 8% 8% 4% 3%
10% 4% 2% 4% 4%
0%
Couple with Couple with non- Couple without One parent with One parent with non- Lone person
dependent children dependent children children dependent children dependent children
Source: ABS Census of Population & Housing, 2016; MacroPlan
Craigieburn West PSP area 21
Assessment of retail/commercial demandSection 2: Study area analysis 2.4 Retail expenditure The estimated retail expenditure capacity of the study area population is sourced from MarketInfo, which is developed by Market Data Systems (MDS) and utilises a detailed micro simulation model of household expenditure behaviour for all residents of Australia. The model takes into account information from a wide variety of sources including the regular ABS Household Expenditure Surveys, national accounts data, Census data and other information. The MarketInfo estimates for spending behaviour prepared independently by MDS are used by a majority of retail/property consultants. All spending figures presented in this report are expressed including GST. Because there were no residents in the Craigieburn West PSP area at 2016, a proxy expenditure profile is used, utilising the spending patterns of residents from the suburb of Craigieburn. Total retail expenditure is allocated in a number of categories, as follows: Take-home food and groceries – goods typically sold in supermarkets and specialty fresh food stores. Packaged liquor – liquor purchased at bottle-shops to take home. Food catering – cafes, take-away outlets and restaurants. Apparel – clothing, footwear, fashion and accessories. Household goods – giftware, electrical, computers, furniture and homewares. Leisure – newsagents, sporting goods, music, DVDs, games and books. General retail – pharmaceutical goods, cosmetics, toys, florists and mobile phones. Retail services – key cutting, shoe repairs, hair and beauty. Chart 2.2 provides a summary of the expected per capita retail spending levels of the study area population, the expenditure profile of nearby growth areas as a proxy, which is then compared with benchmarks for metropolitan Melbourne and Australia. Per capita retail spending by study area resident is estimated at $12,413, which is 14.7% lower than the metropolitan Melbourne average. The main expenditure categories for the Craigieburn West Activity Centre is likely to be ‘fresh food’ and ‘other food and groceries’, due to the role of the centre in serving the grocery and convenience-oriented retail needs of its study area population. The proxy expenditure on ‘fresh food’ and ‘other food and groceries’ are 14.3% and 3.4% below the metropolitan Melbourne average respectively. Table 2.3 presents projections of the estimated retail spending capacity of the study area population over the forecast period of 2023 – 2036. Total retail expenditure generated by the study area population is projected to reach $400 million at capacity in 2036, presented in inflated dollars (i.e. including retail inflation). Table 2.4 details the estimated retail spending capacity of the study area population across key retail categories, as well as the category definitions. Take-home food, grocery and packaged liquor (FLG) expenditure by study area residents, which is likely the key segment of the retail market for supermarkets, is estimated to reach $92 million at capacity in 2036. Craigieburn West PSP area 22 Assessment of retail/commercial demand
Section 2: Study area analysis

                                                                           Chart 2.2
                                    Craigieburn West PSP area - retail expenditure per person, 2018/19*

                                                                        Total retail
  $16,000                                                                                                                         14,544       14,317
  $14,000                                                                                                              12,413
                          Craigieburn West                     Melb Metro                   Aust. Avg.
  $12,000
  $10,000
                                   8,209     8,198
                       7,240
   $8,000                                                                          6,335      6,119
   $6,000                                                               5,173

   $4,000

   $2,000

       $0
                                Total Food                                  Total Non-food                                      Total Retail

                                                                            Food
   $3,500                                                       3,206   3,331
                                                       3,097
                                                                                             Craigieburn West           Melb Metro             Aust. Avg.
   $3,000

   $2,500                  2,260    2,282
                1,936                                                                                                                      1,977
   $2,000                                                                                                                                            1,801
                                                                                                                                1,561
   $1,500

   $1,000                                                                                    646      766      784

     $500

       $0
                        Fresh Food                    Other Food & Groceries                  Packaged Liquor                       Food Catering

                                                                        Non-food
   $3,000
                                                      2,612 2,552
   $2,500                                     2,170
                                                                                             Craigieburn West           Melb Metro             Aust. Avg.

   $2,000
                        1,562
                                1,417
   $1,500      1,262
                                                                                                                1,082 1,098
                                                                                                         918
   $1,000
                                                                            527    644      626
                                                                                                                                               435      427
     $500                                                                                                                               295

       $0
                       Apparel                Household Goods                     Leisure                   General Retail              Retail Services

 *Including GST
 Source: MarketInfo; MacroPlan

Craigieburn West PSP area                                                                                                                                     23
Assessment of retail/commercial demand
Section 2: Study area analysis
Table 2.3
Craigieburn West PSP area - retail expenditure ($M), 2023-2036*
Year ending Total
June Section 1 Sector 2 Sector 3 Sector 4 Sector 5 SA
2023 8 9 10 0 0 26
2024 13 15 17 0 0 45
2025 18 21 25 0 0 64
2026 24 28 33 0 0 85
2027 32 37 38 4 1 111
2028 43 49 40 11 2 145
2029 54 62 42 19 3 179
2030 65 75 44 27 5 216
2031 77 89 46 35 7 254
2032 84 103 48 40 11 286
2033 86 118 49 40 19 313
2034 88 134 50 41 28 341
2035 90 150 51 42 37 370
2036 92 167 52 43 46 400
Average annual growth (%)
2023-2036 21.2% 25.5% 13.4% - - 23.3%
*Inflated dollars & including GST
Source: MarketInfo; MacroPlan
Table 2.4
Craigieburn West PSP area - retail expenditure by category ($M), 2023-2036*
Year ending FLG Food Apparel Household Leisure General Retail Total
June catering goods retail services retail
2023 12 3 3 5 1 2 1 26
2024 21 6 4 8 2 3 1 45
2025 30 8 6 11 3 5 2 64
2026 39 11 8 15 4 6 2 85
2027 51 14 11 19 5 8 3 111
2028 67 19 14 25 6 11 3 145
2029 83 23 18 31 7 13 4 179
2030 100 28 21 37 9 16 5 216
2031 117 33 25 43 10 18 6 254
2032 133 38 28 49 12 21 7 286
2033 145 42 30 53 13 23 7 313
2034 158 46 33 58 14 25 8 341
2035 172 50 35 63 15 27 9 370
2036 186 54 38 68 16 29 10 400
Average annual growth (%)
2023-2036 23.4% 23.7% 22.8% 23.0% 22.9% 23.0% 23.3% 23.3%
*Inflated dollars & including GST
Source: MarketInfo; MacroPlan
Craigieburn West PSP area 24
Assessment of retail/commercial demandSection 3: Competition This section of the report provides an overview of the existing and likely future competitive retail facilities in the area. Table 3.1 details the existing and planned retail facilities in the region, while the previous Map 2.1 illustrates the locations of these centres. 3.1 Existing retail Craigieburn Central is the largest shopping destination in the region, anchored by Big W and Target discount department stores (dds), as well as Coles, Woolworths and Aldi supermarkets. Providing over 54,000 sq.m of retail floorspace, the centre contains a number of mini-major tenants, including JB Hi-Fi, Best& Less, T K Maxx, and rebel. As part of the sub-regional offer, the centre encompasses a solid provision of fresh food specialties in support of the supermarket anchors and also contains a number of national fast fashion tenants (such as Bardot, Bonds, Forever New, General Pants Co., JeansWest, Katies, Millers, Ozmosis, Platypus and Suzanne Grae). One of the key draws of the centre is its takeaway food/dining provision, which contains national operators such as Schnitz, Subway, La Porchetta and Ribs & Burgers, with a number of these tenants fronting Main Street, which divides the centre in two. According to the latest SCN Big Guns publication, Craigieburn Central achieved sales of $285.6 million for 2018, at a centre sales productivity rate of $5,348 per sq.m (and specialty sales productivity level of $6,355 per sq.m), which is considered below benchmark levels of almost $8,000 per sq.m for discount department store based centres. Key non-retail uses include a United Cinema complex, Timezone gaming arcade and Laser Skirmish facilities which act as core entertainment anchors at the centre, an Australia Post outlet, a fitness centre, a number of real estate agent offices, baking branches, a small provision of commercial offices predominantly accommodating lawyers and accountants and a children’s play centre. Craigieburn Central is likely to serve the discretionary non- food and entertainment needs of the future residents of the Craigieburn West PSP area. Two Woolworths anchored supermarkets centres are located further to north and east of Craigieburn Central, namely Craigieburn Plaza on Craigieburn Road and Highlands Shopping Centre. The role of specialty retailers at these centres function to complement the supermarket anchor with the key role of both Craigieburn Plaza and Highlands Shopping Centre to serve the main weekly food, grocery and convenience-oriented needs of its respective catchment. It is understood that despite being close to 4,000 sq.m, the Woolworths supermarket at Highlands Shopping Centre trades a below benchmark levels of $10,000 per sq.m, while the Woolworths anchor at Craigieburn Plaza trades at around benchmark levels. Craigieburn West PSP area 25 Assessment of retail/commercial demand
You can also read