How high frequency food diaries can transform understanding of food security - IOPscience
←
→
Page content transcription
If your browser does not render page correctly, please read the page content below
PERSPECTIVE • OPEN ACCESS

How high frequency food diaries can transform understanding of food
security
To cite this article: Andrew Reid Bell et al 2021 Environ. Res. Lett. 16 041002

View the article online for updates and enhancements.

                                This content was downloaded from IP address 46.4.80.155 on 03/04/2021 at 19:11
Environ. Res. Lett. 16 (2021) 041002 https://doi.org/10.1088/1748-9326/abe674
PERSPECTIVE
How high frequency food diaries can transform understanding of
OPEN ACCESS
food security
PUBLISHED
18 March 2021 Andrew Reid Bell1,2, Mari Roberts2, Kathryn Grace3,4, Alexander Morgan5,
Md Ehsanul Haque Tamal6, Mary E Killilea2,8 and Patrick S Ward7
Original content from 1
this work may be used Department of Earth & Environment, Boston University, Boston, MA, United States of America
2
under the terms of the Department of Environmental Studies, New York University, New York, NY, United States of America
Creative Commons 3
Department of Geography, Environment, and Society, University of Minnesota, Minneapolis, MN, United States of America
Attribution 4.0 licence. 4
Minnesota Population Center, Minneapolis, MN, United States of America
Any further distribution 5
Imperial College London, London, United Kingdom
of this work must 6
maintain attribution to
Palli Karma-Sahayak Foundation (PKSF), Dhaka, Bangladesh
7
the author(s) and the title Duke Kunshan University, Kunshan, People’s Republic of China
8
of the work, journal Department of Biology, New York University, New York, NY, United States of America
citation and DOI.
E-mail: bellar@bu.edu
Keywords: high-frequency social data collection, mobile phones, android ODK, Bangladesh, food consumption measures
Supplementary material for this article is available online
To accurately identify interventions to reduce for, but with insights and details the FFQ cannot
individual- and household-level food insecurity, we provide—a picture of breaks and booms in access
need detailed measures of food consumption. Three to forms of food calories, and the ability to com-
frequently employed—and frequently compared— pare different moments in time, such as those before
measures of food consumption are daily food recalls and after a nutrition or other economic intervention,
(where an individual looks back on their consump- a key priority area for research and humanitarian
tion over the immediately preceding 24 h), 3–4 d decision-making in nutrition [7].
detailed food records (where an individual records High-frequency, self-administered mobile-phones
what they eat as they go through each day), and based data collection addresses a broader issue across
the semi-quantitative food frequency questionnaire domains of standardized social data collection, where
(FFQ; where an individual indicates their typical conventional approaches—long surveys conducted
consumption of different food types over a spe- by enumerators, spread in waves far apart in time—
cified period, typically 1 week or 1 month) [1–3]. limit what we can know or compare across people,
These measures trade off quantitative precision for communities, and time. The constraints of cost and
an ability to capture some longer-term signal of logistics have historically made it difficult to visit a
consumption; we developed an alternative approach large sample of people (large n) more than once in a
that harnesses the expanding presence of mobile and short period of time as is typical in most integrated
smartphones to move beyond this trade-off, measur- household surveys, or to follow more than a small
ing food consumption over time with precision and sample of people with regularity (large t) [8]. Access
with the potential to capture seasonal shifts in diet to mobile devices is changing that in many ways, all
and food consumption patterns. While mobile-based the way down to the possibility of reaching respond-
measurement of food consumption by surveyors is ents on their own time, on their own devices and in
not uncommon [4, 5], and mobile devices already their own spaces, and generating true large-n, large-t
aid in the dissemination of nutrition knowledge and baselines of socioeconomic status and activity.
guidance [6], remote engagement and regular, self- This approach (unsupervised survey through
administered reporting of food consumption is as yet respondent-managed device) is at the end of a
examined in the literature. Our approach is well adap- spectrum of computer-assisted personal interview-
ted to a range of communities, including rural and ing (CAPI) approaches that includes the use of
remote areas in developing countries. It streamlines devices by trained enumerators from the local area
the regular, high-frequency collection of 24 h food or from further away. It adds to the benefits that
recalls through ‘push’ reminders and mobile data these more mainstream CAPI approaches already
package rewards to smartphone users (section 1). provide (reduced data error and time/labor commit-
We obtain the longer term signal that an FFQ looks ment to making dataset available) by improving the
© 2021 The Author(s). Published by IOP Publishing LtdEnviron. Res. Lett. 16 (2021) 041002 A R Bell et al
match between survey task demands and respondent they had consumed, and how much was purchased vs
attention (shorter blocks), as well as reducing recall produced themselves. The ‘Household Composition’
bias and missed intertemporal variation [8]. It task followed the structure of the same module in
also can improve representativeness in the sample, the BIHS [11], and asked participants to indicate
empowering participants to respond in their own the age, gender, literacy, education level, occupation,
time and thus not biasing toward those who are able height, and weight for each member of their house-
to conveniently take time away from work or other hold, and as well to report three measures of their
responsibilities to participate in a half-day or longer physical wellbeing: whether they could stand up on
survey [9]. While it is true that these benefits must be their own after sitting down, whether they could walk
weighed against the barriers to participation that lit- for 5 km, and whether they could carry 20 l of water
eracy, numeracy and technology savvy play in shaping for 20 m.
the respondent pool, it is also true that such barri- We estimated the nutritional information for the
ers are fading over time as smartphones follow in the majority of foods in our list using food compos-
wake of simple mobile phones, becoming ubiquitous ition data compiled by the United States Depart-
across rural contexts. ment of Agriculture (USDA) and the Food and Agri-
culture Organization of the United Nations (FAO)
1. Materials and methods [12], supplementing where necessary with peer-
reviewed studies tracking local foods (e.g. [13]);
We examined data from two of 46 modules—‘Food all sources for food items can be found in table S2
Consumption’ and ‘Household Composition’—from (supplementary material (available online at
a pilot study of high-frequency smartphone data col- stacks.iop.org/ERL/16/041002/mmedia)). Calories
lection conducted in Rangpur District, Bangladesh in were standardized to cal g−1 from different repor-
2015/16, whose study design is summarized briefly ted measurements such as kJ/100 g and kcal/100 g.
here [10]. This study used a quasi-random selec- Nutritional information for several regional food
tion process to recruit 480 ‘likely early adopters’ of items could not be found. In these instances, the
smartphones—sampled from lists of those with tech- calories were estimated by the average calories per
nical literacy identified by local extension officers— food group from the FCT for Bangladesh by Shaheen
into a 1 year experiment during which they received et al. This FCT was used because it is one of the most
payments of mobile talk-time and data for respond- comprehensive tables for national and regional food
ing to short survey tasks on a near-daily basis in compositions of Bangladesh.
a ‘microtasks for micropayments’ data collection Food items were standardized to cal g−1 from
platform. Participants were asked to respond to eight different reported measurements: kilograms,
46 different survey tasks (mostly identical to sur- grams, liters, milliliters, tablespoons, teaspoons,
vey questions included in the Bangladesh Integrated drops, and count. For foods reported by count, cal-
Household Survey; BIHS [11]) at varying frequen- ories were calculated using the standard serving size
cies along the year; while some were asked only once for the food item. After converting reported foods
throughout the duration of the pilot, others were into calories gram−1 , there were approximately 171
asked once per season, once per month, or even once entries where the total calories for a food item was
per week. Assignment of repeated task frequency (sea- over 10 000 calories. We made the assumption that
son, month, week) to phones was made randomly the incorrect unit of measurement was selected in
across 24 unique phone setups, using an algorithm the survey. We chose a more suitable unit of meas-
to make pairwise switches of task versions between urement when available and unresolved entries (75)
phone setups to equalize earning potential (e.g. a task were removed from the final data (13 230 rows of
asked weekly offers more opportunity than the same individual foods). Average weekly calorie intake for
task asked monthly). We include in our analysis only household consumption units (CUs) was calculated
participants who were tasked with the ‘Food Con- using the total calories reported for the week and CUs
sumption’ task on a weekly basis (n = 176). as follows, following [14]: 1 CU for the first adult
The ‘Food Consumption’ task asked respondents in the household; 0.5 CU for each additional house-
to select which among a set of general food types their hold member older than 14 years of age, and; 0.3 CU
household had consumed in the immediately preced- for household members under 14 years of age. We
ing 24 h: cereals; pulses, nuts and seeds; oils; veget- used these data to translate participant responses into
ables; leafy vegetables; fruits; meat and eggs; large time series of per-household member meat, fish, and
fish; small fish; spices, sweeteners, etc; drinks; and overall calorie consumption. We estimated within-
any other foods. For each type selected, respondents subject means and coefficients of variation (stand-
were then asked to indicate which specific food items ard deviation normalized by mean) for each time
within the more general food types they had con- series, and used these to test the additive explanat-
sumed (e.g. rice, wheat, barley, maize, etc as specific ory power of these food consumption metrics on the
cereals). Finally, for each specific food item repor- three measures of physical wellbeing used in the BIHS
ted, participants were asked how much of the food and described above (see probit regressions shown in
2Environ. Res. Lett. 16 (2021) 041002 A R Bell et al
table 1), with individuals weighted by the number these data are collected regularly, we open up new
of responses received throughout the duration of the opportunities to link food consumption to the dis-
pilot the experiment (up to 48), and standard errors tinct but interconnected pillars of food insecurity.
clustered by household. To demonstrate the utility of high-frequency food
consumption data we examine the fundamental ques-
2. Information is gained when we consider tion ‘Can we learn more about food insecurity by
the variation within micro-level observing how people eat over time, than we can from
observations any single-period measure?’ We evaluate how ‘shape’
measures—such as mean and variance—improve the
High-frequency, regularized data could be transform- predictive capability over the more standard point-
ational for measuring micro-level food consumption based estimates for basic physical health outcomes
as a key component of food utilization and food associated with food insecurity such as the ability
security [15] in several ways. First, they could be to stand, carry burdens, and walk (section 1). These
transformational in the way we engage with rural measures are informed by many factors and our
communities—regularly, privately, and on their own design is not intended to present a full model—rather,
time—and in the way we channel resources for data to examine possible explanatory power alongside key
collection. Second, they could be transformational factors such as age.
in the kinds of metrics we can create for looking at For each of three measures related to phys-
socioeconomic status or wellbeing [16]. Social sci- ical health associated with food insecurity, we con-
entists commonly rely on point estimates of a range duct probit regressions on (a) a simple demographic
of factors related to hypothesized determinants of model (of age, age squared, sex, and level of edu-
food security (such as patterns in food consumption cation) and (b) the same demographic model plus
from household-level consumption and expenditure measures of the ‘shape’ of per-person meat, fish, and
surveys) as a primary strategy for comparing popu- overall calories (including mean, coefficient of vari-
lations. Food security monitoring is evolving to con- ation, and percentage of overall calories).
sider more diverse metrics for capturing the differ- These shape measures matter, explaining signi-
ent, and potentially interconnected, dimensions of ficant variation (and improved models, measured by
food security (see [15] for a description of the wide a lower Akaike Information Critierion; AIC) for all
range of data and techniques used). High frequency three physical wellbeing measures. Importantly, they
data collection has the potential to advance measure- matter more than any 1 week’s food signal: single
ments of food security, specifically utilization and sta- week signals of meat, fish, and total calories are signi-
bility, by providing more complex insights into the ficant in some models, but the models based on food
variation within consumption patterns through doc- calorie distributions are superior (by AIC) for every
umenting micro-level variation and distribution over week of the experiment (table S1).
time (including spread, skewness, spikes, and breaks).
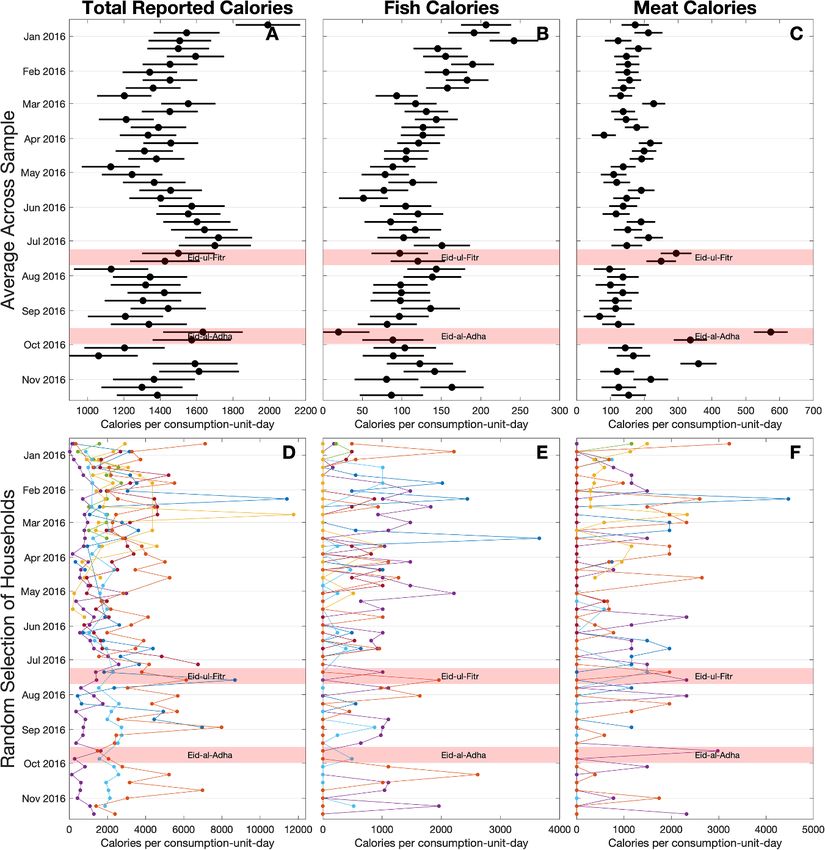
On average across the sample, consumption is 3. Making high-frequency diet monitoring
similar from week to week, with the notable excep- the new standard
tions of major festivals and 1 week in February 2016
during which fish consumption is anomalously high Globally, around two billion people are affected
(figure 1, panels (A)–(C)). Thus, conducting food by moderate to severe food insecurity [17]. Wide-
recalls in any particular week adequately estimates spread and growing food insecurity, especially in
mean consumption, as long as the survey campaign Asia and Africa, means that the planet is not on
is spaced far enough from planned festivals to not track to meet humanitarian goals to significantly
have a partial overlap of some respondents with these reduce food insecurity, including Sustainable Devel-
festival periods that could bias the average consump- opment Goal #2. The linkages from food secur-
tion upward. However, individually the reported con- ity through to environmental sustainability are well
sumption of calories and protein can vary widely established [18–20], but not yet well measured. Lit-
from week to week, for reasons that are likely not erature examining ties from sustainability to food
known to data collectors. From a micro-data per- security commonly focuses on the link from agricul-
spective, considering multiple weeks or time periods ture to food production, e.g. [21–23]. or through pro-
provides greater insight into household consump- duction to commodity markets [24, 25], but the con-
tion because it provides both general trends in con- nection of analyses in production and trade through
sumption that can be compared across households, as to consumption seems elusive. Though food con-
well as insight into how varied consumption patterns sumption sits alongside food production as ‘among
are within a household (figure 1, panels (D)–(F)). the most important drivers of environmental pres-
Instead of these highly variant point estimates, we sures’ [26], we do not yet have the tools to analyze
now have household-level distributions (i.e. mean food consumption in the same ways (i.e. at the same
and coefficient of variation) to better describe the scales and frequency) as we do for environmental
shape of food consumption along the year. When variables and food production. This is a critical gap, as
3Environ. Res. Lett. 16 (2021) 041002 A R Bell et al
Table 1. Probit regressions of basic health measures for individuals within households. Observations weighted by number of responses
received (up to 48); standard errors clustered by household respondent.
Basic demographic model plus
Basic demographic model ‘shape’ of food consumption
Can carry Can walk Can stand on Can carry Can walk Can stand on
Variables 20 l 5 km own 20 l 5 km own
Meat calories—mean 0.00229 0.00341 −0.00474
Meat calories—cov −0.102 −0.0564 0.0380
Meat calories—% −1.429 −1.679 1.072
Fish calories—mean 0.00306 −0.00387 −0.0147b
Fish calories—cov 0.0804 0.0982b −0.000666
Fish calories—% 2.194 4.472b 6.169a
Total calories—mean 0.000166 0.00118b 0.00354a
Total calories—cov 0.549c 1.474a 0.582b
Age 0.154a 0.127a 0.0260c 0.161a 0.150a 0.0295c
Age∧ 2 −0.00218a −0.00193a −0.000446b −0.00228a −0.002 31a −0.000509b
Male (dummy variable) 0.851a 0.379a 0.0690 0.887a 0.465a 0.0754
Years of education 0.0614a 0.0610a 0.0318c 0.0672a 0.0629a 0.0264
Constant −3.499a −1.488a 0.506b −4.557a −4.301a −1.639b
Observations 653 696 737 653 696 737
Pseudo R2 0.317 0.310 0.0531 0.359 0.396 0.136
AIC 12897 10910 12860 12117 9562 11748
a
p < 0.01.
b
p < 0.05.
c
p < 0.1.
it hampers our understanding of how environmental both within and across subjects. Thirdly, we sampled
shocks carry through to become consumption shocks individuals more likely to be digitally literate and did
to households, communities, or regions [27, 28]; how not explicitly tackle the challenge of designing instru-
responses to these shocks (e.g. dietary substitutions) ments for which literacy, digital literacy, or numeracy
feed back into further environmental stress [8]. In are non-constraining (as others such as Daum et al
this study, we present preliminary results from an have done [29]). With these limitations to pilot data
innovative approach that could transform conven- quality in mind, we refrain from making quantitat-
tional practices of measuring food consumption into ive claims about effects in our analysis and point to
data on the same temporal and spatial footing as our robust, qualitative findings: that ‘shape’ measures
environmental data. (e.g. mean and variation) have explanatory power
We acknowledge limitations in our pilot study on physical wellbeing outcomes that no one-off or
data that we would not expect to limit further, focused typical food consumption measure can provide. We
examinations of food consumption. Firstly, these data hope that the shortcomings of our pilot study design
were collected as one module among many in a larger outlined above point to easily addressable improve-
examination on recall bias and intra-period variation ments to a method with ever greater potential as bar-
in high-frequency data collection [8]. Our food con- riers to digital, remote engagement subside.
sumption module was adapted from a similar module Specifically, the break from enumerated to self-
in the BIHS [11] in a manner which made foods selec- administered surveys transforms the potential for
tion intuitive (users first selected food groups, then data to be representative of a target population and
specific foods within those groups, then estimated the quantity of interest. We have previously shown
amounts) but which was not intensively field tested that significant intra-period variation is captured in
on its own. We do not have testing data on how chal- the move from measuring food consumption once
lenging it was for participants to estimate portions, per season to once monthly, and as well moving
distinguish raw vs cooked or wet vs dry amounts, or from monthly to weekly [8]; this allows observa-
how likely participants were to omit foods. Foods- tions over time for at-risk groups whose nutritional
specific tailoring such as anchoring recall to meals needs and behaviors may change dramatically over
within the day, highlighting previously entered foods, a short period of time (such as pregnant/breastfeed-
etc, could (through an iterative testing procedure) ing women [30], infants, and children) that are not
lead to a more accurate signal of overall food con- possible at scale with enumerated survey waves. Fur-
sumption. Secondly, following as well from the lar- ther, training participants to capably self-administer
ger experimental design, respondents were given a survey tasks such as food intake may alleviate con-
flexible response window of several days to complete cerns over privacy, judgment, or other cultural
tasks, so that time of day (or day of week) are variable and social expectations that shape reporting in any
4Environ. Res. Lett. 16 (2021) 041002 A R Bell et al
Figure 1. Sample-wide household averages of weekly reported per-person (A) total calories, (B) calories from fish, and
(C) calories from meats, along 48 week experiment; 95% confidence interval for estimate of the mean shown by black bar. Major
festivals (with significant effect on meat calorie consumption), Eid-ul-Fitr and Eid-al-Adha, shown as pink bars. Averaging over
the sample masks informative week-to-week household-level variation (each color in panels (D) and (E) represents an individual
household), shown for a random sample of household (D) total calorie, (E) fish calorie, and (F) meat calorie consumption.
enumerator-respondent relationship. Added to the respondents—moving us toward regularized socio-
benefit cited earlier of reaching people without their economic baselines informed by high-frequency data,
needing to step away from work or other obligations, with incentives provided via the positive develop-
the move to self-administration offers a range of ment externality of improved access to mobile inter-
transformative improvements to representation that net. This depth in data collection and a shift toward
must be weighed against the challenges of training capturing variation in human status and wellbeing
respondents. outside of environmental crises—i.e. a move from
Long-term, high-frequency pictures of house- McCubbins and Schwartz’s ‘fire alarms’ to more reg-
hold food consumption can reveal subtle nuances ular ‘police patrols’ [31]—opens a wealth of new
in chronic and/or acute food insecurity and allow ways of knowing across environment and develop-
for modeling and understanding of the processes ment fields. Evaluating the impact of pro-poor inter-
that link consumption and health that has here- ventions on well-being, consumption, and land use
tofore been impossible. Improving household-level would be possible in near real-time. Data on food and
food consumption monitoring in evaluations of food water access that are regular in space and time would
or nutrition interventions is one of many entry expose the factors that prevent moisture deficits from
points across the environmental social sciences to becoming agricultural or socioeconomic droughts.
transform the way we engage with communities of More broadly, our ability to discuss variations in
5Environ. Res. Lett. 16 (2021) 041002 A R Bell et al
labor, consumption, or illness as anomalies from a Md Ehsanul Haque Tamal https://orcid.org/0000-
statistical mean would put socioeconomic science on 0002-1331-0732
the same analytic and semantic footing as the natural Mary E Killilea https://orcid.org/0000-0003-4119-
systems branches of environmental science. 3032
Enacting the transformation of data collection, Patrick S Ward https://orcid.org/0000-0001-8793-
food measurement, and rural engagement that we 1200
highlight above will rely on these new streams of
data (a) connecting to what we have learned already, References
and (b) showing us something new. To the first of
these challenges, we encourage researchers to begin [1] Sanjeevi N, Freeland-Graves J and George G C 2017 Relative
building comparative work and ground-truthing into validity and reliability of a 1-week, semiquantitative food
frequency questionnaire for women participating in the
all new high-frequency, self-administered mobile- supplemental nutrition assistance program J. Acad. Nutr.
phones based data collection. The mixing of data col- Diet 117 1972–82
lection modes will always bring shifts in responses. [2] Yang Y J, Kim M K, Hwang S H, Ahn Y, Shim J E and
For example, people respond differently to things that Kim D H 2010 Relative validities of 3 day food records and
the food frequency questionnaire Nutr. Res. Pract. 4 142–8
have been read to them vs things they have read them- [3] Prentice R L et al 2011 Evaluation and comparison of food
selves [32] so there is a burden to conduct extensive records, recalls, and frequencies for energy and protein
ground truthing and validation if we wish to stitch assessment by using recovery biomarkers Am. J. Epidemiol.
this new flow of data appropriately to that of the 174 591–603
[4] Lamanna C et al 2019 Strengths and limitations of computer
past. To the second, we encourage connections with assisted telephone interviews (CATI) for nutrition data
decision makers and a dive into usable, useful data; collection in rural Kenya PLoS One 14 e0210050
measures of spread (how variable is their access to fish [5] Kanter R, Alvey J and Fuentes D 2014 A novel mobile phone
protein) or gaps (how long do families go without application to assess nutrition environment measures in low-
and middle-income countries Food Nutr. Bull. 35 296–300
grain calories) may become central to monitoring [6] Hidrobo M, Palloni G, Aker J C, Gilligan D O and Ledlie N
and tracking processes identified as critical to mak- 2020 Paying for digital information: assessing farmers’
ing nutrition interventions work and build human willingness to pay for a digital agriculture and nutrition
capital [7]. service in Ghana (available at: http://dx.doi.org/
10.2499/p15738coll2.133591)
[7] WHO 2020 Use of nutrition data in decision making: a
Data availability statement review paper (WHO) (available at: www.who.int/
publications/m/item/use-of-nutrition-data-in-
The data that support the findings of this study decision-making-a-review-paper)
[8] Bell A, Ward P, Tamal M E H and Killilea M 2019 Assessing
are openly available at the following URL/DOI:
recall bias and measurement error in high-frequency social
https://doi.org/10.7910/DVN/HBQQVE. data collection for human-environment research Popul.
Environ. 40 325–45
[9] Grossman G, Humphreys M and Sacramone-Lutz G 2014 ‘I
Funding wld like u WMP to extend electricity 2 our village’: on
information technology and interest articulation Am.
This work was supported by the Cereal Systems Ini- Political Sci. Rev. 108 688–705
tiative for South Asia (CSISA) of the Consultat- [10] Tamal M E H, Bell A R, Killilea M E and Ward P S 2019
Social dynamics of short term variability in key measures of
ive Group on International Agricultural Research
household and community wellbeing in Bangladesh Sci.
(CGIAR), with generous funding provided by the Data 6 125
United States Agency for International Development [11] Ahmed A 2013 Bangladesh Integrated Household Survey
(USAID) and the Bill and Melinda Gates Founda- (BIHS) 2011–2012 (Dhaka, Bangladesh: IFPRI) (available at:
http://hdl.handle.net/1902.1/21266)
tion. The authors also acknowledge support from the
[12] Shaheen N et al 2013 Food composition table for Bangladesh
International Food Policy Research Institute and the (FAO)
CGIAR Collaborative Research Program on Policies, [13] Bogard J 2017 The contribution of fish to nutrition and food
Institutions, and Markets. security: informing the evidence base for agricultural policy
in Bangladesh (https://doi.org/10.14264/uql.2017.1052)
[14] Claro R M, Levy R B, Bandoni D H and Mondini L 2010 Per
ORCID iDs capita versus adult-equivalent estimates of calorie availability
in household budget surveys Cad Saude Publica
Andrew Reid Bell https://orcid.org/0000-0002- 26 2188–95
[15] Jones A D, Ngure F M, Pelto G and Young S L 2013 What are
1164-312X
we assessing when we measure food security? A compendium
Mari Roberts https://orcid.org/0000-0001-9301- and review of current metrics Adv. Nutr. 4 481–505
2235 [16] Adams H, Bell A R and Tamal M E H 2019 Temporal
Kathryn Grace https://orcid.org/0000-0003-4822- dimensions of reported life satisfaction in a low-income,
agricultural environment Ecol. Soc. 24 29
6183
[17] Food and Agriculture Organization of the United Nations,
Alexander Morgan https://orcid.org/0000-0002- International Fund for Agricultural Development, World
7980-4276 Food Programme, World Health Organization, The United
6Environ. Res. Lett. 16 (2021) 041002 A R Bell et al
Nations Children’s Fund 2020 The state of food security and [25] Brown M E, Tondel F, Essam T, Thorne J A, Mann B F,
nutrition in the world 2020: transforming food systems for Leonard K, Stabler B and Eilerts G 2012 Country and
affordable healthy diets (Rome: FAO, IFAD, UNICEF, WFP, regional staple food price indices for improved
and WHO) (https://doi.org/10.4060/ca9692en) identification of food insecurity Glob. Environ. Change
[18] Arora N K 2018 Agricultural sustainability and food security 22 784–94
Environ. Sustain. 1 217–9 [26] Capone R, Bilali H E, Debs P, Cardone G and Driouech N
[19] Richardson R B 2010 Ecosystem services and food security: 2014 Food system sustainability and food security:
economic perspectives on environmental sustainability connecting the dots J. Food Security 2 13–22
Sustainability 2 3520–48 [27] Cooper M, Brown M E, Azzarri C and Meinzen-Dick R 2019
[20] Lacy W, Lacy L and Hansen D 2002 Global food security, Hunger, nutrition, and precipitation: evidence from Ghana
environmental sustainability and poverty alleviation Food and Bangladesh Popul. Environ. 41 151–208
Security and Environmental Quality in the Developing World [28] Randell H, gray1 C and Grace K 2020 Stunted from
1st edn Lal R, Hansen D O, Uphoff N and Slack S (Boca the start: early life weather conditions and child
Raton, FL: CRC Press) (https://doi.org/10.1201/ undernutrition in Ethiopia Soc. Sci. Med.
9781420032215) 261 113234
[21] Beltran-Peña A, Rosa L and D’Odorico P 2020 Global [29] Daum T, Capezzone F and Birner R 2019 The forgotten
food self-sufficiency in the 21st century under sustainable agriculture-nutrition link: estimating the energy
intensification of agriculture Environ. Res. Lett. requirements of different farming technologies in rural
15 095004 Zambia with time-use data ZEF Working Paper Series (Bonn:
[22] Jain M et al 2020 How much can sustainable intensification ZEF) (https://doi.org/10.2139/ssrn.3435998)
increase yields across South Asia? A systematic review of the [30] World Health Organization 2017 WHO recommendations
evidence Environ. Res. Lett. 15 083004 on antenatal care for a positive pregnancy experience (World
[23] Brauman K A, Siebert S and Foley J A 2013 Improvements in Health Organization)
crop water productivity increase water sustainability and [31] McCubbins M and Schwartz T 1984 Congressional oversight
food security—a global analysis Environ. Res. Lett. 8 024030 overlooked: police patrols versus fire alarms Am. J. Political
[24] Liu J, Hertel T W, Lammers R B, Prusevich A, Baldos U L C, Sci. 28 165–79
Grogan D S and Frolking S 2017 Achieving sustainable [32] Olson K and Brick J M 2015 Methodological considerations
irrigation water withdrawals: global impacts on food security for a new household panel survey J. Econ. Soc. Meas.
and land use Environ. Res. Lett. 12 104009 40 427–47
7You can also read