Real Estate Impacts of MGM Springfield in Springfield and Surrounding Communities
←
→
Page content transcription
If your browser does not render page correctly, please read the page content below
Real Estate Impacts of MGM Springfield
in Springfield and Surrounding
Communities

September 23, 2019

Henry Renski, PhD
Associate Professor
UMass Center for Economic Development
University of Massachusetts Amherst

Thomas Peake
Senior Research Analyst
UMass Donahue Institute, Economic and Public Policy Research Group

Andrew L. Hall
Senior Research Analyst
UMass Donahue Institute, Economic and Public Policy Research Group

Denis McAuliffe
Research Assistant
UMass Donahue Institute, Economic and Public Policy Research Group

Jonathan Astor
Research Assistant
UMass Donahue Institute, Economic and Public Policy Research Group
Acknowledgements
Support for this study came from the Massachusetts Gaming Commission under ISA MGC10500003UMS15A
establishing the Social and Economic Impacts of Gambling in Massachusetts study. This multi-year project
was competitively bid via the Massachusetts Gaming Commission Request for Response (MGC-RA-2012) for
Research Services and awarded to the University of Massachusetts Amherst in April 2013. The UMass
Amherst research team would also like to thank the key informants from Springfield, MA who agreed to
take the time to speak with us about the impacts MGM Springfield has had on housing and real estate in
the community.

SUGGESTED CITATION:
Renski, H., Peake, T., Hall, A., McAuliffe, D., & Astor, J. (2019). Real Estate Impacts of MGM Springfield in
Springfield and Surrounding Communities. Hadley, MA: University of Massachusetts Donahue Institute,
Economic and Public Policy Research Group.

A PDF OF THIS REPORT CAN BE DOWNLOADED AT: www.umass.edu/seigma
                                                                                                         Page | i
Table of Contents

Acknowledgements ............................................................................................................................................. i
List of Tables ...................................................................................................................................................... iii
List of Figures ..................................................................................................................................................... iii
Executive Summary ........................................................................................................................................... iv
Real Estate Conditions in Springfield: Initial Impacts .........................................................................................1
   Introduction ....................................................................................................................................................1
   Methodology ..................................................................................................................................................2
   Residential Real Estate ...................................................................................................................................4
       Residential Property Sales ..........................................................................................................................4
       Impacts on Residential Property Sales .......................................................................................................4
       Impacts on Median Sales Price of Residential Properties ..........................................................................9
       Residential Rental Market ........................................................................................................................12
       Residential Rent Prices over Time ............................................................................................................13
   Commercial and Industrial Real Estate.........................................................................................................16
       Inventory ..................................................................................................................................................16
       Vacancy and Absorption ...........................................................................................................................21
       Lease Rates ...............................................................................................................................................25
   Conclusion ....................................................................................................................................................29

                                                                                                                                                            Page | ii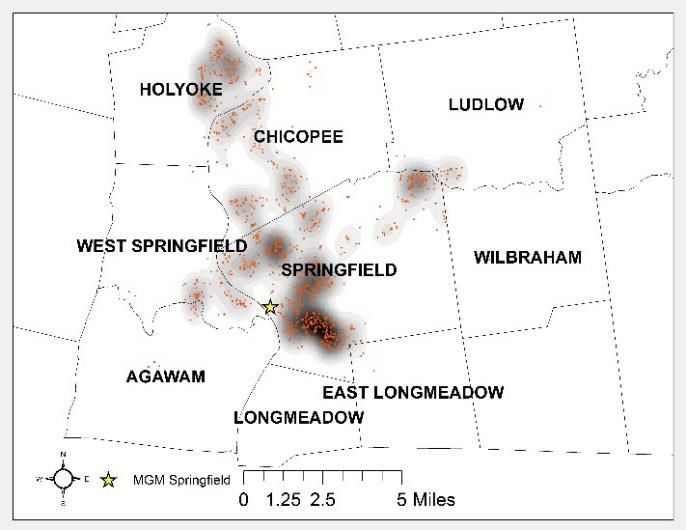
List of Tables
Table 1. Summary of Residential Housing Sale Prices, 2008-2018...................................................................12
Table 2. Real Median Rents (2018 Dollars), 2008/12 and 2013/17 .................................................................13
Table 3. Share of Vacant Housing Units, 2008/12 and 2013/17 ......................................................................13
Table 4. Commercial Inventory, Massachusetts, Springfield, and Surrounding Communities, 2008-2018 .....20
Table 5. Industrial Inventory, Massachusetts, Springfield, and Surrounding Communities, 2008-2018 .........20
Table 6. Commercial Vacancy and Absorption, Massachusetts, Springfield, and Surrounding Communities,
2008-2018.........................................................................................................................................................24
Table 7. Industrial Vacancy and Absorption, Massachusetts, Springfield, and Surrounding Communities,
2008-2018.........................................................................................................................................................24
Table 8. Valassis Vacancy Rates, Massachusetts, Springfield, and Surrounding Communities, 2008-2018 ....25
Table 9. Commercial and Industrial Lease Rates, Massachusetts, Springfield, and Surrounding Communities,
2008-2018.........................................................................................................................................................28

                                                                  List of Figures
Figure 1. Massachusetts Host and Surrounding Communities...........................................................................3
Figure 2. Number of Residential Property Sales by Type, Springfield, 2008-2018.............................................5
Figure 3. Single-Family Home Sales in Springfield vs. the Region and State, 2008-2018...................................6
Figure 4. Condominium Sales in Springfield vs. the Region and State, 2008-2018 ............................................6
Figure 5. Multi-Family Sales in Springfield vs. the Region, 2008-2018...............................................................7
Figure 6. Location of Single-Family Homes Sales, before and after MGM Springfield License Awarded ..........8
Figure 7. Location of Condominium Sales, before and after MGM Springfield License Awarded .....................8
Figure 8. Location of Multi-Family Sales, before and after MGM Springfield License Awarded .......................9
Figure 9. Single-Family Homes, Median Sales Price (2018 Dollars), 2008-2018 ..............................................10
Figure 10. Condominiums, Median Sales Price (2018 Dollars), 2008-2018 .....................................................10
Figure 11. Multi-Family Homes, Median Sales Price (2018 Dollars), 2008-2018 .............................................11
Figure 12. Median Estimated Rent Price in Springfield vs. the Surrounding Region and State (2018 Dollars),
2008-2018.........................................................................................................................................................15
Figure 13. Number of Commercial and Industrial Buildings, Springfield, 2008-2018 ......................................17
Figure 14. Change in Number of Commercial Buildings, 2008-2018................................................................17
Figure 15. Change in Number of Industrial Buildings, 2008-2018....................................................................18
Figure 16. Springfield Rentable Building Area, 2008-2018 ...............................................................................18
Figure 17. Commercial Rentable Building Area, 2008-2018.............................................................................19
Figure 18. Industrial Rentable Building Area, 2008-2018.................................................................................19
Figure 19. Commercial Vacancy Rates, 2008-2018 ..........................................................................................21
Figure 20. Industrial Vacancy Rates, 2008-2018 ..............................................................................................22
Figure 21. Commercial Net Absorption, 2008-2018 .........................................................................................23
Figure 22. Industrial Net Absorption, 2008-2018 .............................................................................................23
Figure 23. Office Commercial Lease Rates (2018 Dollars), 2008-2018 ............................................................26
Figure 24. Non-Office Commercial Lease Rates (2018 Dollars), 2008-2018 ....................................................26
Figure 25. Industrial Lease Rates (2018 Dollars), 2008-2018 ...........................................................................27

                                                                                                                                                      Page | iii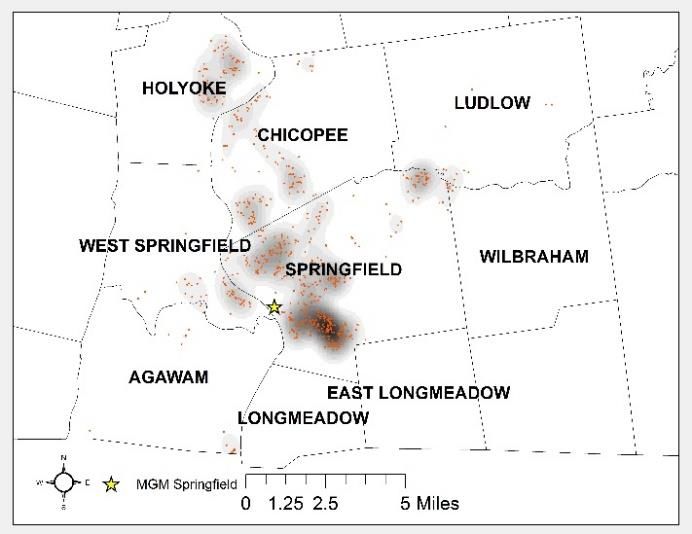
Executive Summary
Greater Springfield is experiencing a strengthening real estate market associated with economic recovery
and more robust economic conditions statewide. Springfield has slowly added new commercial buildings
and rentable commercial and industrial space, including an uptick at the end of 2018 with the addition of
the MGM Springfield casino and a very large industrial facility, the CRRC MA rail car factory. At the same
time, the area has seen recovery in its housing market, exhibited by rising rents, higher home sales prices,
and increased home sale volume. Growth also presents challenges, such as tighter housing market
conditions that impact marginalized populations. Key informants from Springfield observed increased
pressure in the housing market, rising rental costs, and more evictions; although they did not necessarily
attribute all of the changes to MGM Springfield. The following findings touch on key points about the
increasingly active real estate market in Springfield and the region.
Key Findings: Residential Real Estate Indicators
Home sales
Sales of single-family homes in Springfield, Massachusetts flattened in the wake of the Great
Recession of 2009. However, home sales picked up in 2014, just before the license was awarded to
MGM Springfield and continued through 2018 when the casino opened. Since a similar upward
trend was also found in the outlying areas of the region and the state—areas where it is unlikely
that the casino had a noticeable impact—it is difficult to solely associate this observed increase
with the casino.
There was no noticeable effect of the license award on condominium sales in Springfield, where
sales remained flat despite a recovery in the housing market at the regional and state level. There
was a steady climb in condominium sales in Springfield’s surrounding communities, but this is more
likely reflective of broader market trends.
There has been a steady increase in the number of multi-family home sales in Springfield following
the announcement of the license award. This coincides with key informants’ observations
suggesting that outside interests have been investing in apartment buildings in the area since the
casino license announcement.
Home prices
The announcement of the awarding of the casino license to MGM Springfield seemed to have little
impact on inflation-adjusted median sales prices of single-family homes and condominiums in
Springfield. Median sales prices of both housing types increased slightly or remained relatively flat
between the casino’s licensing and opening. In contrast, multi-family home prices increased
dramatically during that time. Key informant interviews suggest that this phenomenon could be
due to investors buying up multi-family homes.
Rents, vacancy rates, speculative buying, and displacement
Median gross rents rose in Springfield following the license announcement. However, since rents
increased in the surrounding communities, Hampden and Hampshire Counties, and the state as a
whole in the same period, it is likely that increased median gross rents are following larger state
trends. Springfield’s share of vacant housing saw a decrease in the most recent years of data
following the license award, while the share of vacant housing in combined surrounding
communities and rest of Hampden and Hampshire Counties increased in that same period.
Key informants from Springfield noted the increasing pressure on the housing market and
increasing rental costs. They were unsure whether these trends could be teased out from larger
market forces and other development projects.
Page | iv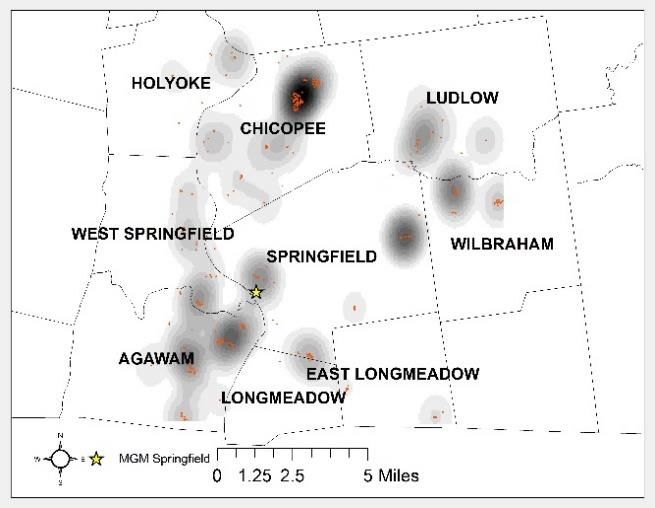
Springfield key informants raised concerns regarding the speculative buying of properties in
Springfield. For instance, many of the key informants discussed investors buying multi-family
buildings and raising rents and/or buying a property and leaving it vacant with the hope of selling
higher. Key informants also discussed concerns regarding displacement and an increase in evictions.
Key Findings: Commercial and industrial Real Estate Indicators
There has been slight growth in commercial and industrial building area in Springfield following the
license announcement. For most of the study period (2008-2018), Springfield added new rentable
commercial space at a slightly slower rate than the Commonwealth as a whole and lagged in terms
of industrial buildings. That trend reversed at the end of 2018 with the addition of MGM Springfield
and the CRRC MA rail car factory in East Springfield.
The development and opening of MGM Springfield introduced a substantial amount of new
commercial space to the Springfield real estate market and may have contributed to a fall in
commercial vacancy rates. Otherwise, there were few obvious breaks from past trends that could
be plausibly attributed to the casino.
Vacancy rates—the share of rentable commercial and industrial building area listed on the
market—have fallen in Springfield over the last 11 years and were lower than statewide rates at the
end of 2018. It is difficult to determine how much potentially rentable building area remains off the
market in Springfield.
There is little evidence of a sustained rise or drop in office lease rates in Springfield since the license
was awarded. Average lease rates for office and industrial properties were consistently much lower
in Springfield and its surrounding communities than in the Commonwealth as a whole. Lease rates
in the same area were more comparable to the state for non-office commercial properties.
Springfield key informants discussed the increased patronage of downtown Springfield as a result
of MGM Springfield. They noted that increased foot traffic and spillover impacts onto businesses as
a result of the casino were limited to businesses and restaurants adjacent to MGM Springfield.
Key informants also noticed a few new restaurants as well as improvements to infrastructure (i.e.,
bike lanes, better signage, and sidewalks) downtown and in close proximity to the casino.
Page | v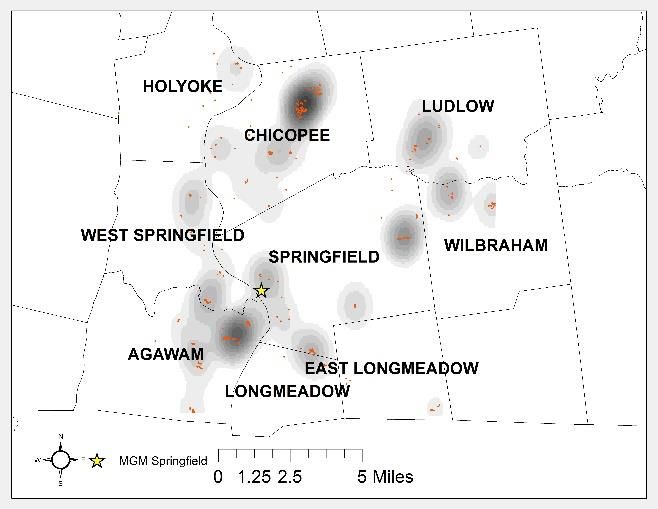
Real Estate Conditions in Springfield: Initial Impacts
                                                  Introduction

The city of Springfield is located in Hampden County, which is in the southern part of the Pioneer Valley in
Western Massachusetts. The 2018 population is estimated at 155,032 residents, which makes Springfield
the largest city in Western Massachusetts, and the third largest city in the Commonwealth. As the most
populous city in the area, Springfield is an important hub in the economy of Western Massachusetts and
Northern Connecticut. Sixty percent of the jobs in Springfield are held by residents from other towns. Just
over half of workers who reside in Springfield also work there, while most of the rest commute to
municipalities adjacent to Springfield.1 In terms of its tax base, the city’s assessed property values for
residential, commercial, and industrial properties are still recovering from the recession and are not yet at
their pre-recession levels.2 Residential and commercial properties remain Springfield’s top sources of tax
revenue.3

Springfield is recognized by the state as a Gateway City, a designation given to cities experiencing economic
hardships from the decline in industries that used to be “a ‘gateway’ to the American Dream”.4 Poverty and
a lack of employment opportunities for its residents are among some of the ongoing challenges in the city.
A high school diploma is the most common education level among residents, while only one quarter holds
an Associate’s, Bachelor’s, graduate, or professional degree. The wages, education levels, and English-
language proficiency of Springfield residents are lower than the state average.

The location of Springfield for the Commonwealth’s first resort casino is part of a recent wave of public-
and private-sector investment in the city. According to a recent report by MassDevelopment,5 projects such
as the $95 million renovation of Springfield Union Station, the SilverBrick apartment project, the Springfield
Innovation Center, and MGM Springfield are illustrative of this investment and are drawing economic
activity back into the city and region. MGM Springfield represents the largest private-sector investment in
Springfield’s history.

This report details the Social and Economic Impacts of Gambling in Massachusetts (SEIGMA) research
team’s examination of the initial impacts of MGM Springfield on the residential, commercial, and industrial
real estate markets for Springfield and its surrounding communities. It follows the Baseline Real Estate
Conditions, Host Community Profile: Springfield report that documented residential, commercial, and
industrial real estate trends prior to the awarding of the casino license to MGM Springfield.6

1
  U.S. Census Bureau, 2011-2015 5-Year American Community Survey Commuting Flows, Table 3 (Residence
MCD/County to Workplace MCD/County Flows for the United States and Puerto Rico Sorted by Residence Geography:
5-Year ACS, 2011-2015).
2
  Massachusetts Department of Revenue, Division of Local Services, Assessed Values by Class.
3
  Massachusetts Department of Revenue, Division of Local Services, Tax Levies by Class.
4 The Massachusetts Gateway City Program description can be found here:
https://www.masshousing.com/portal/server.pt/community/home/217/supporting_gateway_cities/44957
5 https://www.massdevelopment.com/assets/pdfs/annual-reports/TDI_report_2018.pdf.
6 A copy of the Baseline Real Estate Conditions report is available for viewing and download from

https://www.umass.edu/seigma/sites/default/files/Real%20Estate%20Profile%2C%20Springfield_2016-08-
30%20%28final%29_0.pdf.
                                                                                                      Page | 1
Methodology
The purpose of this study is to document any notable changes to the Springfield area’s real estate market
following the awarding of a casino license to MGM Springfield in June 2014 and the subsequent opening of
the first resort-style casino in Massachusetts in August of 2018. Since MGM Springfield has been open for
less than a year at the time of writing, there are some data sources which we had hoped to use, but which
do not include any post-opening data due to lags in publication. For other measures, we were able to
obtain more recent data, including real estate data from Zillow and the Multiple Listing Service (MLS), as
opposed to the more dated L3 Assessors’ Data.
Our impact evaluation uses a comparative approach. It considers changes in the host communities before
and after the opening of the casino. It then compares these observed changes to other areas that are facing
similar market conditions but are unlikely to be impacted by the casino development. This is necessary
because other events that have little or nothing to do with the specific development, such as changes in
national and state economic cycles, can have a considerable impact on local market conditions. Without
accounting for these external forces, one can easily misattribute an apparent increase or decrease in
property sales or values to the development. However, finding a suitable comparison group is difficult,
especially given practical data limitations. Communities with similar market conditions are often neighbors
and potentially subject to spillover impacts. Conversely, distant communities might provide a false baseline
of comparison because they are not subject to similar market or regulatory conditions.
The impact of a new casino facility may extend beyond the borders of its host community. Thus, in addition
to Springfield, we also track market conditions among nearby areas officially designated as “surrounding
communities” by the Massachusetts Gaming Commission.7 Springfield’s eight surrounding communities
include Agawam, Chicopee, East Longmeadow, Holyoke, Longmeadow, Ludlow, West Springfield, and
Wilbraham, which makes it impractical to report specific trends for each community within the scope of
this report. For this report, we compare historic trends in Springfield and its surrounding communities to
the rest of the communities in Hampden and Hampshire Counties, and against the Commonwealth as a
whole (Figure 1).
7
More information about surrounding communities can be found here: https://massgaming.com/about/community-mitigation-
fund/host-surrounding-communities/surrounding-community-agreements/.
Page | 2Figure 1. Massachusetts Host and Surrounding Communities
Some data sources prevent us from calculating averages across communities and for the broader region. In
these instances, we present data from Hampden and Hampshire Counties to illustrate the broader region.
We believe that these broader regions stretch beyond the likely sphere of influence of the casino on real
estate conditions. Still, we recognize that these are not ideal comparison groups, and we err on the side of
caution in our interpretation of the evidence.
In January 2019, Dr. Rachel Volberg (SEIGMA Principal Investigator) and Dr. Alissa Mazar (SEIGMA Project
Manager and Research Associate) began interviewing key informants in Springfield with a specific focus on
real estate conditions and housing and concerns surrounding gentrification and displacement. This is part of
a larger effort to conduct key informant interviews with representatives—from community organizers to
healthcare officials to economic development officers—in the casino host communities of Springfield,
Everett, and Plainville. The goals of the qualitative interviews are to (1) gain an on-the-ground
understanding of the social and economic conditions in host communities prior to the development of a
casino, during the process of constructing a casino, and while hosting a casino, (2) utilize qualitative data of
impacts to triangulate findings from quantitative data, and (3) pinpoint mechanisms to explain quantitative
trends and correlations.
The SEIGMA research team requested a single interview from potential key informants by contacting their
professional offices by email and/or telephone. If a key informant agreed to an interview, formal consent
was obtained. Interviews were not confidential as officials/representatives spoke in their professional
capacity and in their area of expertise. Interviews were audio recorded and excerpts from the interviews
are integrated into reports and presentations. Interviews were conducted with Geraldine McCafferty,
Director of Housing, City of Springfield; Liz Bewsee, Housing and Economic Justice Organizer, Arise for Social
Justice; Catherine Ratté, Principal Planner—environment and land use, Pioneer Valley Planning
Page | 3Commission; Rose Webster-Smith, Lead Community Organizer, Springfield No One Leaves; and Denise
Jordan, Executive Director, Springfield Housing Authority.
Residential Real Estate
Residential Property Sales
Residential property sales, both in terms of numbers and prices, are among the most direct indicators of
changing real estate market conditions. They are often used to measure the impact of a new development
on surrounding areas. A rise in market values of properties following the construction of a new casino may
occur if the casino increases the desirability of nearby properties. For example, increased pedestrian traffic
outside the casino may benefit nearby stores or restaurants, or streetscape improvements may make
nearby neighborhoods more desirable for renters or homeowners. Conversely, a decline in property values
may indicate negative impacts resulting from possible fears of increased traffic, crime, noise, or other
negative externalities.
Our analysis uses property sales reported by the proprietary Multiple Listings Service (MLS). The MLS is
used by real estate brokers to share information with other brokers about listed properties and potential
buyers and is frequently used by analysts to measure market conditions. The MLS includes property sales of
all types but this analysis only includes those classified as “arms-length” transactions. This excludes sales
between family members and other situations where the sales price is not a clear reflection of the market
value. We focus on several general types of residential properties, namely single-family residential,
condominiums, and multi-family residential. We ignore other types of residential land uses, such as mobile
homes and vacant lots, as they are relatively rare.
We use the MLS to track the number and market value of property sales in Springfield and its surrounding
communities compared to the state and the remainder of Hampden and Hampshire Counties. We began
tracking market conditions starting in 2008 through 2018, the latter being the year in which MGM
Springfield opened and the most recent full-year for which data were available at the time of writing. We
also used the detailed address data in the MLS to examine sales trends at varying distances from the site of
the casino.
Impacts on Residential Property Sales
Also known as the “City of Homes,” it should come as no surprise that single-family home sales dominate
Springfield’s residential market (Figure 2). There were 1,272 single-family homes sold in Springfield in 2018,
accounting for 74 percent of all residential property sales. Multi-family homes comprised most of the
remaining residential property sales. There was a total of 365 multi-family homes sold in 2018, or 21
percent of total residential property sales in Springfield. Condominiums represented four percent of total
residential property sales in 2018 with 71 total sales. Therefore, our analysis focuses on single-family
homes, condominiums, and multi-family homes.
Page | 4Figure 2. Number of Residential Property Sales by Type, Springfield, 2008-2018
Source: MLS and Massachusetts Association of Realtors
Comparing Springfield to more distant communities in the Hampden and Hampshire County region can help
us determine whether the observed change in sales is due to local factors (namely the opening of MGM
Springfield) as opposed to broader market trends.8 There has been a steady rise in single-family home sales
in Springfield and the surrounding communities since 2014 (Figure 3). This is also the year that MGM
Springfield was awarded its license. However, we cannot attribute all of this growth to MGM Springfield.
Single-family home sales also grew for the state and the outlying areas of Hampshire and Hampden
Counties—areas where it is doubtful that the casino could have had a noticeable impact. Single-family
home sales, however, grew slightly faster in Springfield and its surrounding communities after 2014. This is
especially true in the two years since 2016, where the state and outlying areas (e.g., the rest of Hamden
and Hampshire Counties) began to slow relative to Springfield. So while we cannot decisively conclude that
the construction and opening of MGM Springfield had a positive influence on the market for single-family
home sales in Springfield and its surrounding communities, it is safe to say that MGM Springfield has not
had a noticeably dampening effect on the volume of local home sales.
8
We assume that, although Springfield and its neighbors might be impacted by MGM Springfield, more distant communities in
Hampden and Hampshire Counties would be less so, and thus provide a benchmark for measuring casino-related impacts.
However, the further away a community is, the more likely the housing market is subject to different market dynamics and may not
necessarily make a good basis for comparison. It is particularly important to note that Springfield and its surrounding communities
tend to be far more urban than outlying communities in Hampden and Hampshire Counties, and the housing market in Hampshire
County (in particular) is highly influenced by the large population of college students and faculty who live there.
Page | 5Figure 3. Single-Family Home Sales in Springfield vs. the Region and State, 2008-2018
Source: MLS and Massachusetts Association of Realtors
The relatively small number of condominium sales made it difficult to identify trends. Nevertheless, we
found little evidence that condominium sales in Springfield were at all affected by the awarding of the
casino license to MGM Springfield. Springfield condominium sales peaked in 2013 (before the license was
announced) and have remained relatively flat since (Figure 4). There has been an uptick in condominium
sales in the surrounding communities, but this also does not appear to be related to MGM Springfield.
Instead, it appears to be part of larger regional sales trends which began several years before the casino
license was awarded.
Figure 4. Condominium Sales in Springfield vs. the Region and State, 2008-2018
Source: MLS and Massachusetts Association of Realtors
Multi-family home sales showed a marked increase in Springfield since 2014, when the license was
awarded (Figure 5). The surrounding communities, and the rest of Hampden and Hampshire Counties to a
lesser extent, also showed an increase in multi-family sales during that same period, although multi-family
home sales have slowed in 2017. Before the award, multi-family home sales in Springfield had been
trending downward since 2009. It is possible that MGM Springfield played a role in reversing that trend,
although we cannot know definitively whether that rise was due to MGM Springfield. The pattern of sales
in multi-family homes in the surrounding communities and rest of the Hampden and Hampshire County
Page | 6region, in contrast, was rather flat prior to the license award. With more data, we will be able to track
trends in multi-family home sales beyond 2018.
Figure 5. Multi-Family Sales in Springfield vs. the Region, 2008-2018
Source: MLS
We also considered whether the relative location of home sales has shifted before and after the opening of
MGM Springfield. With the aid of Geographic Information System (GIS) software, we identified the location
of nearly all residential property sales in Springfield and its surrounding communities.9 Figure 6 shows
where single-family home sales were concentrated in 2012-2013 (prior to the announcement of the casino
license) compared to the two most-recent post-award years of 2017-2018. Darker shading in the maps
represents heavier sales concentrations. Although there was a greater overall level of sales activity in 2017-
2018, there does not appear to have been a major shift in the relative location of the sales of single-family
homes after the license was awarded. There were very few single-family home sales in the immediate
vicinity of MGM Springfield to begin with, and most of the heaviest concentrations were several miles
away. Given that closer neighborhoods are more likely to feel the direct impacts of development, we found
little evidence that the casino had influenced home sales in Springfield or the surrounding communities. It
would likely be several years before the casino might influence residential location and development
decisions on a scale large enough to trigger changes in the spatial pattern of development or have a
noticeable impact on more distant parcels.
Figure 7 provides a similar analysis of condominium sales. As with single-family homes, we did not see a
large locational shift. However, there was at least some increase in the number of condominium sales in
neighboring areas. There was an increase in condominium sales in the immediate area surrounding MGM
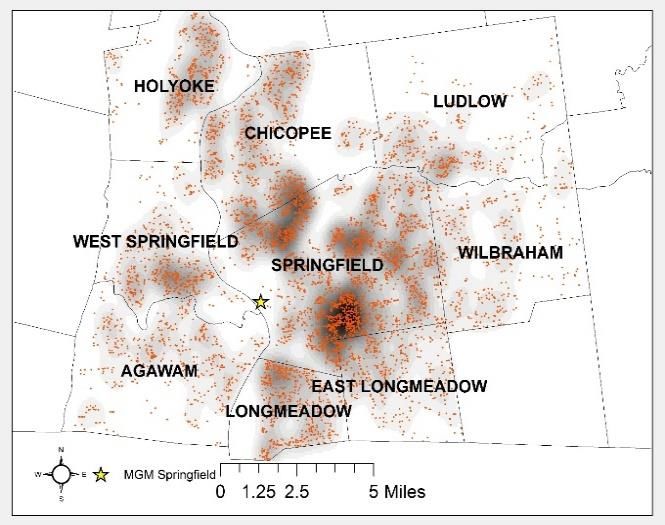
Springfield as well, but it was not overwhelming. Finally, Figure 8 shows the location of multi-family home
sales before and after MGM Springfield was awarded its casino license. Like single-family and condominium
sales, there was an increase in sales activity, but there was no noticeable shift in the location of these sales.
The bulk of the increase in multi-family sales looks to be concentrated in Springfield and Holyoke. There
does not seem to have been any direct impacts of MGM Springfield on the location of single-family,
9 The location matching process involves joining the MLS to GIS databases of individual parcels produced by MassGIS and the
Boston Redevelopment Authority. These GIS databases are based on digitized parcel maps, which are linked to assessors’ data, and
can be used to identify the latitude and longitude coordinates of every matched parcel. The vast majority (roughly 98 percent) of all
sales were located to parcels in this first round. The remaining sales are located through street address matching using the Master
Address File developed by MassGIS. Our final match rates were well in excess of 99 percent, which is a very high match rate for this
type of work.
Page | 7condominium, or multi-family home sales. However, we did see a general uptick in overall sales activity
which may or may not be a result of the new casino.
Figure 6. Location of Single-Family Homes Sales, before and after MGM Springfield License Awarded
2012 to 2013 2017 to 2018
Source: MLS
Figure 7. Location of Condominium Sales, before and after MGM Springfield License Awarded
2012 to 2013 2017 to 2018
Source: MLS
Page | 8Figure 8. Location of Multi-Family Sales, before and after MGM Springfield License Awarded
2012 to 2013 2017 to 2018
Source: MLS
Impacts on Median Sales Price of Residential Properties
If the MGM Springfield casino has had an immediate impact on the local housing market, then it is more
likely to be reflected in changes in the sales price than in the number of sales—at least in the short term.
This is because prices are typically more responsive to changes in demand and it takes years to permit and
build new housing. Yet, the possible impacts on sale prices are unclear. On the one hand, the new facility
may diminish home values if it leads to increased traffic, noise, fear of crime, etc. On the other hand, the
casino may cause home prices to rise if redevelopment encourages more people to move into the area.
It is difficult to separate the influence of MGM Springfield from the overall improvement in the housing
market, which has experienced a steady climb since 2012. Single-family homes in Springfield typically cost
far less than the rest of the region or the state (Figure 9). The Springfield average home sold for $160,000 in
2018—roughly $70,000 less than its surrounding communities and nearly $100,000 less than the outlying
communities of Hampden and Hampshire Counties. However, the median sales price for a single-family
home in Springfield has grown faster than the region and the state average in recent years. Between 2014
and 2018, the median price of a single-family home in Springfield grew by 22 percent, compared to 8
percent for the surrounding communities and 5 percent for the remainder of Hampden and Hampshire
Counties. To put this in perspective, if the sales price of housing in Springfield grew at the same rate as the
outlying communities, the typical Springfield home would have sold for about $140,000 instead of $160,000
in 2018—a modest, but noticeable difference. This is also faster than the overall Commonwealth (11
percent), which is heavily influenced by the Boston region market.
Page | 9Figure 9. Single-Family Homes, Median Sales Price (2018 Dollars), 2008-2018
Source: MLS and Massachusetts Association of Realtors
While the overall trend for sale prices is positive, we must be cautious in attributing this change purely to
MGM Springfield. The upward trend of single-family home sale prices in Springfield and its surrounding
communities began several years before the announcement of the license, and we see no noticeable bump
in the years following the announcement. There has not been enough time to determine whether there has
been an increase in home values in the period following the grand opening of the casino in August 2018.
Given that the median incomes of some of these communities are lower than the state average, it is also
important to note that rising residential property values could contribute to gentrification. We will continue
to track local and regional trends in real estate and housing affordability to answer these questions. Indeed,
while it appears that the Springfield market is doing relatively well, we cannot purely attribute this growth
to MGM Springfield or determine yet whether low-income residents are being displaced.
We found little evidence that the awarding of the casino license has had much impact (positive or negative)
on the sales price of condominiums in the region. The real sales price for a Springfield condominium has
been essentially flat since 2012 (Figure 10) and remains lower than it was just prior to the recession in
2008. The same is true for condominium sales in the surrounding communities as well as the remainder of
Hampden and Hampshire Counties.
Figure 10. Condominiums, Median Sales Price (2018 Dollars), 2008-2018
Source: MLS and Massachusetts Association of Realtors
Page | 10The median sales prices of multi-family homes in Springfield have been trending upward since 2012, two
years prior to the awarding of the casino license (Figure 11). For Springfield’s surrounding communities,
multi-family home sales prices have slightly increased since 2015 and reached $210,000 in 2018—their
highest point in 10 years. Multi-family home prices in the rest of Hampden and Hampshire Counties rose in
2014 but seemed to resume their pre-award levels starting in 2015. MGM Springfield’s presence may have
played a role in these trends, although it is still unclear from the available MLS data whether MGM
Springfield had any impact on multi-family home prices in this region.
Figure 11. Multi-Family Homes, Median Sales Price (2018 Dollars), 2008-2018
Source: MLS
Table 1 provides a summary of single-family home, condominium, and multi-family home sales prices for
Springfield and the surrounding communities, as compared to the immediate region and state. This 10-year
look at home sales prices compares current prices to their pre-recessionary levels. Springfield and its
surrounding communities experienced differing patterns of change in property sales prices of single-family,
condominiums, and multi-family homes throughout the 10-year period. Single-family home prices increased
in Springfield from 2008 to 2018 but decreased in each of the surrounding communities as well as in the
rest of Hampden and Hampshire Counties. Only Ludlow and Wilbraham experienced an increase in
condominium prices, while multi-family home prices rose in half of the surrounding communities,
particularly in East Longmeadow and West Springfield. Springfield’s residential housing market for single-
family and multi-family homes has rebounded from the economic downturn and surpassed pre-recession
housing sales prices. The rest of the region, including Springfield’s surrounding communities, in contrast,
were near 2008 levels, especially for sales prices in single-family homes and condominiums. Still,
Springfield’s single-family and multi-family home sales prices remained lower than prices in each of its
surrounding communities as well as in the rest of Hampden and Hampshire Counties. Home sales prices
have indeed increased in 10 years; however they were historically—and continue to be—low relative to the
broader region and state.
Page | 11Table 1. Summary of Residential Housing Sale Prices, 2008-2018
Single-Family Homes Condominiums Multi-Family Homes
Median Change in Median Change in Median Change in
Number of Sales Price Real Median Number of Sales Price Real Median Number of Sales Price Real Median
Sales in in 2018 Sales Price Sales in in 2018 Sales Price Sales in in 2018 Sales Price
2018 ($2018) 2008-2018 2018 ($2018) 2008-2018 2018 ($2018) 2008-2018
Massachusetts 56,562 $397,000 $35,448 21,981 $375,035 $56,053 ** ** **
Springfield 1,272 $160,000 $3,716 71 $113,000 -$37,452 365 $164,500 $82,859
Surrounding Communities 1,935 $229,900 -$15,022 357 $151,000 -$12,281 207 $210,000 $5,898
Agawam 221 $230,000 -$34,749 92 $155,000 -$37,730 8 $217,750 -$3,846
Chicopee 427 $185,000 -$12,629 106 $127,000 -$20,245 84 $211,500 -$1,932
East Longmeadow 205 $260,000 -$7,082 8 $325,500 -$30,220 2 $227,250 $63,969
Holyoke 197 $205,000 -$7,849 25 $79,900 -$33,172 79 $196,000 $3,561
Longmeadow 255 $334,000 -$10,057 6 $272,725 -$84,265* ** ** **
Ludlow 199 $217,900 -$20,316 35 $245,000 $68,889 12 $216,000 $11,898
West Springfield 242 $220,000 -$10,927 48 $70,250 -$56,876 21 $223,000 $24,730
Wilbraham 189 $302,500 -$14,149 37 $331,750 $110,154 1 $218,800 -$3,587
Rest of Hampden and Hampshire Counties 2,243 $257,000 -$13,581 400 $184,000 -$15,874 164 $216,250 -$28,556
Source: MLS and Massachusetts Association of Realtors
Note: *This change is from 2009 since no condominiums were sold in Longmeadow in 2008. **State-level housing sales and housing
price data are available only for single-family homes and condominiums. No multi-family homes were sold in Longmeadow in either
2008 or 2018.
Residential Rental Market
Rentals are a relatively large component of Springfield’s housing market, with 29,999 rental units
comprising roughly 53 percent of occupied housing units compared to the statewide average of 37 percent.
Springfield makes up 34 percent of the entire stock of rental units in the rest of Hampden and Hampshire
Counties. Rental units are also the dominant form of housing closest to MGM Springfield. Ninety-three
percent of housing units in the census tracts surrounding MGM Springfield are renter-occupied and these
tenants are the most likely to feel the immediate impact of any change in the housing market.
Unfortunately, the data on rental market conditions is not as robust as property sales. The most
comprehensive source of community-level rental data is the American Community Survey (ACS), which is
produced by the U.S. Census Bureau. The ACS collects data annually and pools the data across multiple
years to ensure a sufficient sample size for reporting smaller areas. The data for most Massachusetts
municipalities is available only in five-year periods, the most recent release being data pooled from 2013 to
2017. As a result, these data cannot show year-to-year changes in market conditions. Nor can they be used
to directly show the effects of the opening of MGM Springfield in Springfield or its neighboring
communities. However, the data can help illustrate the changes that have taken place following the
casino’s award of the license and leading up to its opening.
Table 2 shows median gross rents in the two most recent five-year periods adjusted for inflation.10
Although lower than Hampden County and the state, Springfield’s median gross rent of $879 per month
was similar to most of its neighbors, with the exception of Longmeadow where rent was notably higher.
Monthly rents in Springfield also have not risen as fast as most other communities, although they are still
generally consistent with area trends. In the period from 2008/12 to 2013/17, there was only a $26
increase in median gross rents in Springfield, which was just below trends in the state and Hampshire
County. Wilbraham was the only surrounding community to experience a decrease since the 2008/12
period whereas communities such as East Longmeadow and Longmeadow experienced an increase of more
than $200.
10
The ACS reports both contract rents, the amount that tenants pay each month to their landlords, as well as gross rents, which
account for the fact that some contract rents include utilities while others do not. This analysis focuses on median gross rents,
which are more likely to indicate the true costs of rental housing.
Page | 12Table 2. Real Median Rents (2018 Dollars), 2008/12 and 2013/17
Gross Rent ($2018)
2008/12 2013/17 Change
Massachusetts $1,155 $1,202 $47
Springfield $853 $879 $26
Surrounding Communities
Agawam $924 $998 $74
Chicopee $850 $907 $57
East Longmeadow $722 $951 $229
Holyoke $728 $814 $86
Longmeadow $1,219 $1,429 $210
Ludlow $926 $945 $18
West Springfield $856 $870 $13
Wilbraham $876 $794 -$82
Immediate Region
Hampshire County $849 $887 $38
Hampden County $991 $1,065 $75
Source: U.S. Census Bureau, American Community Survey Five-Year Estimates
There is some evidence that the rental market in Springfield has been tightening in the past few years,
although this has yet to translate into notably higher rents as there remains ample supply. Table 3
shows five-year residential vacancy rates for Massachusetts, Springfield, and its surrounding communities,
specifically for 2008-2012 and 2013-2017. Although its residential vacancy rate of nine percent is higher
than most other communities in the region, Springfield’s vacancy rate declined by 1.2 percent between
2008/12 and 2013/17. Only Wilbraham saw a greater drop in its vacancy rate, while outlying towns in
Hampden and Hampshire Counties saw a net increase in vacancy rates.
Table 3. Share of Vacant Housing Units, 2008/12 and 2013/17
5-Year Shares of Vacant Units (%)
Percent
2008/12 2013/17 Change
Massachusetts 9.9% 9.7% -0.2%
Springfield 10.3% 9.0% -1.2%
Surrounding Communities 5.3% 5.7% 0.4%
Agawam 4.2% 3.6% -0.6%
Chicopee 7.2% 6.9% -0.3%
East Longmeadow 3.4% 2.9% -0.5%
Holyoke 5.8% 9.6% 3.8%
Longmeadow 2.5% 2.3% -0.2%
Ludlow 4.6% 6.4% 1.8%
West Springfield 4.9% 3.8% -1.1%
Wilbraham 4.7% 2.1% -2.6%
Rest of Hampden and Hampshire Counties 6.6% 8.0% 1.4%
Source: U.S. Census Bureau, American Community Survey Five-Year Estimates
Residential Rent Prices over Time
To track changes in the cost of rental housing, we used the Zillow Rent Index. Zillow is an extensive online
real estate database that consists of more than 110 million homes which they use to produce various
measures and data. The Zillow Rent Index tracks the median rent in a specific geographic area. Through
their proprietary models, Zillow has created an index for estimating rent that is unaffected by the mix and
stock of homes at a specific time. Their models observe recent rental listings, prior sales transactions, tax
Page | 13assessment information, and geographic location to generate estimated rental values for homes in the
area. The Zillow Rent Index reports the median estimated rent prices monthly which allows for close
monitoring of the changing rental housing prices over time. The data are available back to November 2010.
Further explanation of the Rent Index can be found on Zillow’s methodology page.11
The Zillow Rent Index is not based on a representative sample like the ACS. The ACS data are taken from the
U.S. Census Bureau where tenants are asked how much they pay for rent (i.e., the actual gross rent paid by
tenants at the time), which may be less than the market rate. The Zillow Rent Index acts as a measure of
the overall rental market in a specific location. It is useful for analyzing trends over time because it tracks a
constant stock of all rental properties in the area for which it has an estimate, regardless of whether the
rental house is occupied or not. The ACS data includes only rental houses that are occupied and paying
rent. This may cause differences between the Zillow Rent Index and the ACS gross rent data if the
unoccupied rental houses are on average more expensive or less expensive than the occupied rental
houses. Zillow states that it has estimates for 138,200 homes in Hampden County and 50,400 homes in
Hampshire County.12
There has been a notable rise in rental rates in Springfield and its surrounding communities after MGM
Springfield was awarded the Western Massachusetts casino license.13,14 However, it is unclear how much of
this increase is due to the casino independent from broader market trends. Between November 2010 and
2014, real rents in Springfield were in decline—as were those for surrounding communities and the
remainder of Hampden and Hampshire Counties (Figure 12). In the year immediately following the
announcement of the MGM Springfield license, median rents rose quickly, rising by nearly $360 from June
2014 to June 2015 in Springfield. Rents in surrounding and outlying regional communities also grew, but by
a somewhat lesser amount—closer to a $300 increase in the year following the announcement of MGM
Springfield. While Springfield residents may have noticed higher prices coinciding with the award of the
MGM Springfield license, similar hikes were felt in other areas where MGM Springfield was unlikely to have
had much of an influence. Regardless, these accelerated growth rates were not sustained. Real median
rents remained almost unchanged since June 2015. There has been a small increase in rents in the months
since the grand opening of MGM Springfield, but it is premature to tell whether this is a temporary or
sustained trend.
11
Zillow Rent Index: Methodology https://www.zillow.com/research/zillow-rent-index-methodology-2393/.
12 The accuracy of the Zillow Rent Estimate and the actual rental price of a unit can be seen here:
https://www.zillow.com/howto/DataCoverageRentZestimateAccuracyMA.htm.
13
The median rent for the immediate region was estimated as a weighted average by rental unit counts for individual communities
using data reported by Zillow. Due to availability constraints, the immediate region for the Zillow data is the entirety of Hampden
and Hampshire Counties including Springfield and the surrounding communities.
14
The median rent for the surrounding communities was estimated as a weighted average of rental units of the officially
recognized Massachusetts Gaming Commission surrounding communities which include Agawam, Chicopee, East Longmeadow,
Holyoke, Longmeadow, Ludlow, West Springfield, and Wilbraham.
Page | 14Figure 12. Median Estimated Rent Price in Springfield vs. the Surrounding Region and State (2018 Dollars), 2008-2018
$2,500
License Awarded MGM Springfield Opening
Estimated Monthly Rate (2018$)
$2,000
$1,500
$1,000 Massachusetts
Hampden and Hampshire Counties
$500 Surrounding Communities
Springfield
$0
2014-05
2010-11
2011-05
2011-11
2012-05
2012-11
2013-05
2013-11
2014-11
2015-05
2015-11
2016-05
2016-11
2017-05
2017-11
2018-05
2018-11
Source: Zillow Rent Index Time Series: Multifamily, SFR, Condo/Co-op by City, https://www.zillow.com/research/data/
Key informants from Springfield discussed their perceptions of the impacts of MGM Springfield on the
housing and rental markets in Springfield. They particularly mentioned the increasing pressure on the
housing market and rising rental costs, though not attributing all of these increases to the casino:
We have seen some upward pressure on the housing market […] but it is impossible for me to say
how much of that is attributable to the casino [...] there have been so many development projects
going on here. The casino is one high profile one among several. –Geraldine McCafferty, Director of
Housing, City of Springfield
In 2013, you could get a 2-3 bedroom for $950. Now you’re looking at $1,400-$1,600. –Rose
Webster-Smith, Lead Community Organizer, Springfield No One Leaves
You can still buy a house for really affordable prices, but rentals are really high. –Catherine Ratté,
Principal Planner—environment and land use, Pioneer Valley Planning Commission
Springfield key informants also raised concerns regarding the speculative buying of properties and evictions
and displacement in Springfield:
We’ve had some more outside investors coming in, buying a lot of multi-family housing and raising
rents. And there is a feeling that it is speculative and is likely tied to the casino. […] Regarding rent
prices, there seems to be some upward pressure as a result of speculation. […] There is a lot of
speculative buying with the hope of getting high rents. But then they realize, they really can’t get
those rents. […] They are still holding, sitting on them, and waiting to see if that is still to come. —
Geraldine McCafferty, Director of Housing, City of Springfield
MGM has impacted property values and rental prices because they are attracting investors, which is
pushing up the rental costs. […] People are getting pushed to Chicopee, they are getting pushed to
Holyoke, because if you get evicted right now, there are no apartments to rent. It is so hard to find a
place to rent here in Springfield without paying out the nose. –Rose Webster-Smith, Lead
Community Organizer, Springfield No One Leaves
Page | 15I am aware of some speculation. You can see the block right across from MGM Springfield, there is a
lot of waiting and hoping that “we are going to sell for more” […] people are waiting thinking they
are going to make a mint.—Catherine Ratté, Principal Planner—environment and land use, Pioneer
Valley Planning Commission
In 2011, we lost 365 units of affordable housing and very few of them were replaced. And that was
right around the time they started talking about the casino. And it was pretty obvious that landlords
were looking for ways to get tenants out of properties in the South End and in Metro Center because
they expected to get more money once the casino opened.—Liz Bewsee, Housing and Economic
Justice Organizer, Arise for Social Justice
It is difficult to say whether it’s the result of the casino or not but there has definitely been an uptick
in evictions. […] I’ve been keeping track of the number of cases going to Housing Court versus
District Court in Springfield, and the number of cases overall is climbing. —Liz Bewsee, Housing and
Economic Justice Organizer, Arise for Social Justice
[…] there is a lot of concern on City Council about displacement but there is not much they can do
about it at this point because the market is coming in and renovating properties and they are not
protected. —Catherine Ratté, Principal Planner—environment and land use, Pioneer Valley
Planning Commission
Commercial and Industrial Real Estate
Inventory
The market for commercial and industrial real estate is another important indicator of the health and
nature of an area’s economy. This section of the report analyzes Springfield’s commercial and industrial real
estate inventory, the extent to which that space is utilized, and the price of the space. As before, we focus
on whether there have been any observable changes following the license award and opening of MGM
Springfield.
The section makes extensive use of data from CoStar to provide information on indicators not generally
tracked in publicly available data sources. CoStar is a leading provider of commercial real estate
information, and data are available for most of Massachusetts on a quarterly basis from 2008 to present.15
Quarters in CoStar are based on calendar years rather than fiscal years. Commercial real estate is defined
here as any real estate that CoStar defined as Office, Retail, Flex, Hospitality, Health Care, or Sports &
Recreation. Industrial real estate is any real estate defined by CoStar as Industrial, including facilities used
for assembling, processing, manufacturing, warehousing, or distributing products.16 This analysis covers the
10-year period between the 1st quarter of 2008 and the last quarter of 2018.17
15
For more information about CoStar Group Inc. and the CoStar database, please visit http://www.costar.com/. The data used for
this analysis are not available for download without a CoStar subscription.
16
https://www.costar.com/about/costar-glossary.
17
We define commercial real estate as any real estate that CoStar defined as Office, Retail, Flex, Hospitality, Health Care, or Sports
& Recreation. Industrial real estate is any real estate that CoStar defines as Industrial. These definitions were chosen to best
approximate the MA Department of Revenue classifications.
Page | 16You can also read