2019 SBA Fact Sheet & Scoreboard - European Union - European Commission
←
→
Page content transcription
If your browser does not render page correctly, please read the page content below
2019 SBA Fact Sheet &
                     Scoreboard
                     European Union
Key points

Past & future SME performance1: Across the EU-28 Member States (MS), small and medium-sized enterprises (SMEs) make a
significant contribution to the ‘non-financial business economy’. In 2018, 99.8% of all EU-28 firms were SMEs, which generated
€4,357 billion of value added and employed 97.7 million people. SMEs thus accounted for two thirds of overall employment and
56.4% of overall value added in the ‘non-financial business economy’. Micro firms were the most common size of firm, accounting for
93.0% of all firms in the ‘non-financial business economy’. The outlook for EU-28 SMEs continues to be positive. In particular, SME
value-added growth is expected to rise by 8.5% in 2018-2020.

Implementing the Small Business Act for Europe (SBA): Significant policy progress has been made, and most of the SBA
recommendations have been implemented. Beyond the SBA, EU Member States are also on track in implementing the more recent
recommendations in the scale-up & start-up initiative and in the SME action programme. However, significant policy gaps remain
where the SBA recommendations have still not been implemented. Easing business transfers — through marketplaces and minimised
taxation — has been largely ignored in most EU Member States, even though this is essential to better ensure existing SMEs survive
from one generation to another.

SME policy priorities: SMEs in Europe still require crucial support to re-skill and upskill their employees if they are to thrive in the
data-driven, digital economy and maximise their productivity. In an ageing society, it is also imperative to ensure that existing SMEs
survive from one generation to another. Targeted measures to facilitate business transfers — including advisory services, minimised
taxation, matching schemes and marketplaces — should be deemed a priority.

About the SBA fact sheets:
The Small Business Act for Europe (SBA) is the EU’s flagship policy initiative to support small and medium-sized enterprises (SMEs). It
comprises a set of policy measures organised around 10 principles ranging from entrepreneurship and ‘responsive administration’ to
internationalisation. To improve the governance of the SBA, the 2011 review of it called for better monitoring. The SBA fact sheets,
published annually, aim to improve the understanding of recent trends and national policies affecting SMEs. Since 2011, each EU
Member State has appointed a high-ranking government official as its national SME envoy. SME envoys spearhead the
implementation of the SBA agenda in their countries.

                                                          Internal market,
                                                          industry,
                                                          entrepreneurship
                                                          and SMEs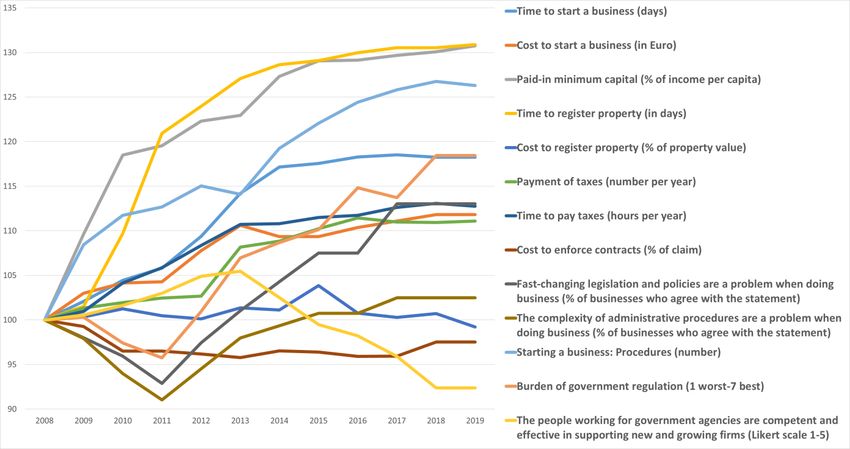
Table of Contents
   Key points ..................................................................................................................................................................................................................................................................... 1
1.    SMEs — basic figures....................................................................................................................................................................................................................................... 2
2.    SBA profile ............................................................................................................................................................................................................................................................. 4
3.    SBA principles ....................................................................................................................................................................................................................................................... 6
   3.0 ‘Think Small First’ ............................................................................................................................................................................................................................................. 6
   3.1 Entrepreneurship............................................................................................................................................................................................................................................... 8
   3.2 ‘Second chance’ .............................................................................................................................................................................................................................................. 12
   3.3 ‘Responsive administration’ ..................................................................................................................................................................................................................... 16
   3.4 State aid & public procurement ............................................................................................................................................................................................................ 20
   3.5 Access to finance........................................................................................................................................................................................................................................... 24
   3.6 Single market .................................................................................................................................................................................................................................................. 28
   3.7 Skills & innovation ........................................................................................................................................................................................................................................ 32
   3.8 Environment ..................................................................................................................................................................................................................................................... 37
   3.9 Internationalisation ...................................................................................................................................................................................................................................... 41
4.    Interesting initiatives..................................................................................................................................................................................................................................... 45

1. SMEs — basic figures

       Class size                                    Number of enterprises                                                     Number of persons employed                                                                        Value added

                                                            European Union                                                                   European Union                                                                  European Union
                                                         Number                                        Share                              Number                                        Share                              Billion €                                 Share
             Micro                                  23,323,938                                        93.0%                          43,527,667                                        29.7%                                     1,610                               20.8%
             Small                                    1,472,402                                          5.9%                        29,541,259                                        20.1%                                     1,358                               17.6%
     Medium-sized                                         235,668                                        0.9%                        24,670,024                                        16.8%                                     1,388                               18.0%
            SMEs                                    25,032,008                                        99.8%                          97,738,950                                        66.6%                                     4,357                               56.4%
            Large                                            47,299                                      0.2%                        49,045,645                                        33.4%                                     3,367                               43.6%
             Total                                  25,079,307                                      100.0%                        146,784,595                                        100.0%                                      7,724                             100.0%
   These are estimates for 2018 produced by DIW Econ, based on 2008-2016 figures from the Structural Business Statistics Database
   (Eurostat). The data cover the ‘non-financial business economy’, which includes industry, construction, trade, and services (NACE Rev. 2
   sections B to J, L, M and N), but not enterprises in agriculture, forestry and fisheries and the largely non-market service sectors such as
   education and health. The following size-class definitions are applied: micro firms (0-9 persons employed), small firms (10-49 persons
   employed), medium-sized firms (50-249 persons employed), and large firms (250+ persons employed). The advantage of using Eurostat
   data is that the statistics are harmonised and comparable across countries. The disadvantage is that for some countries the data may be
   different from those published by national authorities.

Across the EU-28, SMEs make a significant contribution to the                                                                                 Micro firms were the most common size of firm in 2018,
‘non-financial business economy’. In 2018, 99.8% of all EU-28                                                                                 accounting for 93.0% of all firms in the ‘non-financial business
firms were SMEs, which generated €4,357 billion of value added                                                                                economy’. They also contributed the largest shares of both value
and employed 97.7 million people. SMEs thus accounted for two                                                                                 added and employment, at 20.8% and 29.7%, respectively.
thirds of overall employment and 56.4% of overall value added                                                                                 Wholesale and retail trade and manufacturing were the two
in the ‘non-financial business economy’. Average SME                                                                                          most significant SME sectors in the EU. Together, they accounted
productivity, measured as value added per person employed,                                                                                    for slightly more than 40% of both total SME employment and
was €44,600 in 2018, while the average EU SME employed 3.9                                                                                    total SME value added.
people.

2019 SBA Fact Sheet — European Union                                                                                                                                                                                                                                              2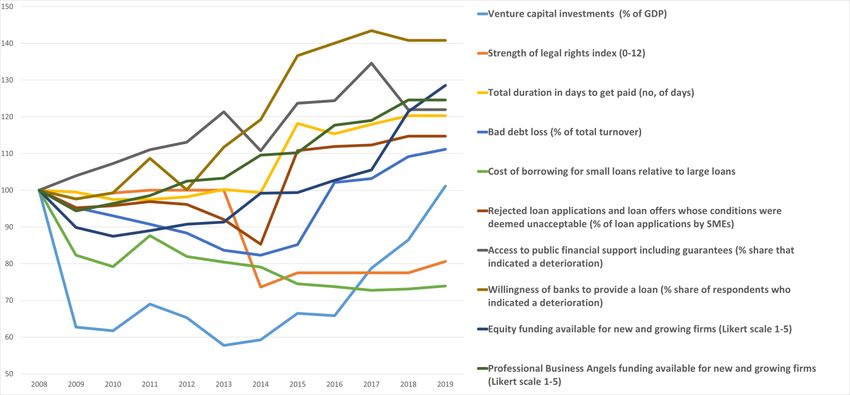
EU-28 SMEs have followed a solid growth path in recent years in      large size of the sector, enabled wholesale and retail trade to
the ‘non-financial business economy’. In 2014-2018, SME value        make a significant contribution to the increase in SME value
added increased by 16.2%, and SME employment increased by            added in the ‘non-financial business economy’, amounting to one
8.2%. The main drivers of growth in SME value added were             quarter of overall SME value-added growth.
micro firms, generating value-added growth of 18.3% in this          In 2016, the average enterprise birth rate in the EU-28 ‘business
period. Nevertheless, the growth in value added of large firms       economy’ was 9.8%2. Across the EU-28, the top three birth rates
was even higher, at 19.5%. Most recently, in 2017-2018, SMEs         were found in Lithuania (18.8%), Malta (16.4%) and Latvia
in all EU Member States generated growth in both value added         (16.2%), while the lowest rates were observed in Greece (4.5%),
and employment, of 4.1% and 1.8% respectively. Micro firms           Belgium (6.2%) and Austria (6.6%).
grew fastest in 2017-2018, with a rise of 5.4% in value added
and 2.6% in employment. This meant they outperformed the             Many firms in the EU-28 have successfully scaled up in recent
                                                                     years. In 2016, 10.7% of all firms in the ‘business economy’3
growth in all other business size classes, including that of large
                                                                     with at least 10 employees were high-growth firms4. High-
firms.
                                                                     growth firms are particularly prevalent in information and
Most recently, in 2017-2018, SME value-added growth was              communication, where they account for 16.5% of firms, as well
particularly strong in Latvia (14.0%), Bulgaria (14.5%) and          as in administrative and support services, where they account for
Romania (15.0%). Sweden and Italy, on the other hand, saw the        14.8% of firms.
lowest rates of growth in value added in the same period, at         In 2018, EU-28 SMEs in the specialised knowledge-intensive
0.1% and 1.8% respectively.                                          services and high-tech manufacturing sectors, both of which are
                                                                     usually R&D-intensive, accounted for 33.0% of SME value added
In 2014-2018, SME value-added growth in the EU-28 was                in the manufacturing and services sectors.
highest in accommodation and food services, construction and
information and communication, at 23.3%, 21.1%, and 20.3%            The outlook for EU-28 SMEs continues to be positive. In
respectively. In employment growth, SMEs performed best in           particular, SME value-added growth is expected to rise strongly,
information and communication with an increase of 17.3%, and         by 8.5%, in 2018-2020. SME employment is projected to grow
accommodation and food services and administrative and               by 3.0% in the same period, generating around 2.9 million new
support services, both of which generated increases of 14.6% in      SME jobs by 2020. As a result, SMEs are expected to create
the same period. Another fast-growing SME sector was                 73.7% of all new jobs in the ‘non-financial business economy’ in
wholesale and retail trade which generated an increase of            2018-2020, with almost half of these new jobs likely to be
18.6% in value added. This strong growth, combined with the          generated by micro firms.

2019 SBA Fact Sheet — European Union                                                                                                3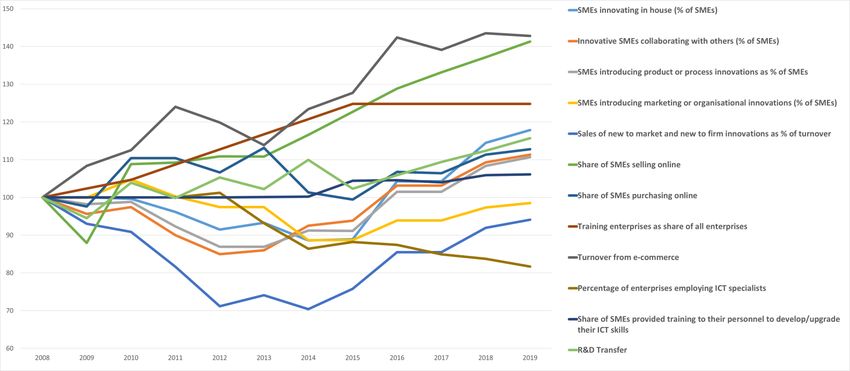
2. SBA profile5
Global SBA policy implementation
Figure 1 below shows the collective policy progress at EU Most and least commonly implemented measures
aggregated level in the number of policy measures
adopted/implemented in 2011-2019 per (primary) SBA principle. Since 2011, the three most commonly adopted/implemented
Remarkably, more than 3,750 SBA policy measures have been measures across the EU-28 have been measures to: (i) develop
adopted/implemented since 2011. Two thirds of the identified the research, development and innovation (RD&I) skills of SMEs;
policy measures adopted/implemented since 2011 have been in (ii) set up public financing programmes; and (iii) promote an
the following categories: access to finance; entrepreneurship; entrepreneurial mind-set.
skills & innovation; and ‘responsive administration’.
Figure 2: Most commonly implemented measures at EU-28
Figure 1: SBA policy implementation for EU-28 (2011- level (2011-2019)
2019)
On the other hand, the least commonly adopted/implemented
measures across the EU-28 are the following SBA
The overall trend for 2011-2019 was replicated in 2018-2019. recommendations (where there was little or no policy activity
Over two thirds of the policy measures adopted/implemented between 2011 and 2018/2019:
during the current reference period (2018 and the first quarter
of 2019) were in: access to finance; entrepreneurship; skills & ensure re-starters are treated equally;
innovation; and ‘responsive administration’. set up business transfer marketplaces;
minimise business transfer taxation;
Figure 2: Distribution of policy measures increase the VAT register threshold to €100,000;
adopted/implemented per SBA principle — EU-28 (2011- create common commencement dates for
2019/Q1) new/amended laws;
reduce unfair conditions for SMEs to access public
procurement.
2019 SBA Fact Sheet — European Union 4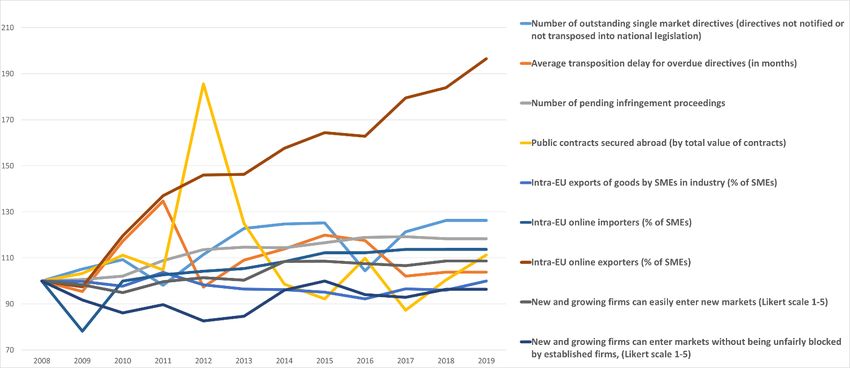
Figure 3: Performance measured by the SBA indicators

2019 SBA Fact Sheet — European Union                   5

3. SBA principles6

3.0 ‘Think Small First’
Recent policy developments under ‘Think Small First’                   More      than    300      policy    measures      have     been
                                                                       adopted/implemented under the ‘Think Small First’ principle since
The ‘Think Small First’ principle is meant to be a guiding principle   2011. Table 1 shows the overall policy progress and status in
for all policy- and law-making activities. It requires policymakers    terms of the key policy measures put in place at EU-28 level
to take SMEs’ interests into account at the early stages of the        under the ‘Think Small First’ principle. Regulatory impact
policymaking process. The principle also calls for newly designed      assessments (RIAs) are in place in almost every EU Member
legislation, and for administrative rules and procedures to be         State, and SME stakeholders are generally consulted on new
made simple and easy to apply.                                         legislative proposals, with most EU Member States also
                                                                       publishing the results of these consultations. In general, the
Over 15 policy measures have been adopted over the current             ‘Think Small First’ principle is applied to both legislation and
reference period (2018-Q1/2019), as shown in Figure 4. As in           administrative procedures affecting SMEs. However, 8 EU
previous years, most of the measures aimed to minimise red             Member States are still struggling to use the results of RIAs
tape for businesses. Recent examples of policy developments            effectively and to systemically apply the ‘SME test’. Most EU
include Spain’s SME platform, which improves access to                 Member States still do not have common commencement dates
information to SMEs and entrepreneurs through a single point of        for new or amended legislation.
information, and Finland’s removal of minimum share-capital
requirements for limited liability companies.

2019 SBA Fact Sheet — European Union                                                                                                  6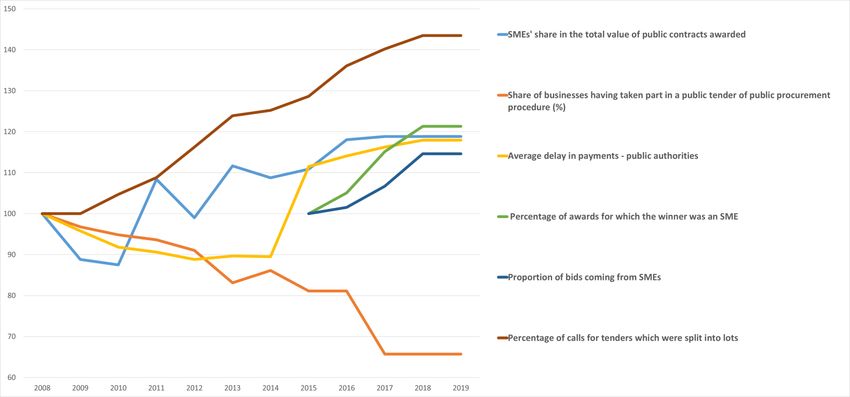
Figure 4: SBA policy measures at EU-28-level for ‘Think Small First’ (2011 — Q1/2019)

Table 1: Overall policy implementation at EU-28 level for ‘Think Small First’7

 Think Small First                        Is the ‘Think Small First’ principle applied both to legislation and administrative   25
                                          procedures affecting SMEs?
                                          Have specific targets to reduce red tape been set and achieved?                       22

                                          Is the regulatory impact assessment (RIA) process in place?                           27
                                          If so, are the results of the impact assessment effectively used to change (or        20
                                          cancel) the proposed legislation?
                                          Is the ‘SME test’ systematically applied as an integral part of regulatory impact     20
                                          assessments?
                                          Are SME stakeholders consulted on new legislative proposals?                          28
                                          If so, are consultation results taken into consideration and made publicly            24
                                          available?
                                          Is there a ‘common commencement date’ for all new legislation and                     7
                                          amendments to the existing legislation relevant to SMEs?

2019 SBA Fact Sheet — European Union                                                                                                 7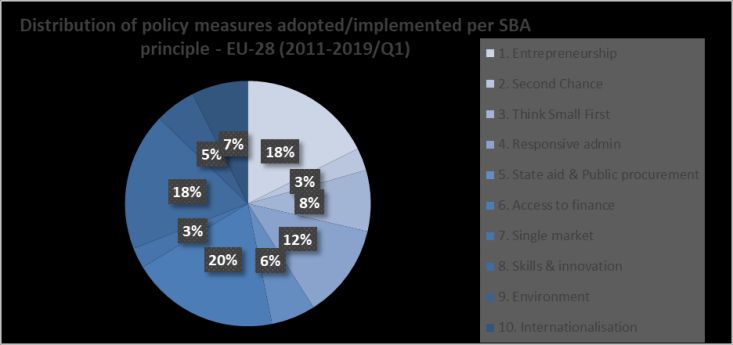
3.1 Entrepreneurship
Comparative performance of EU Member States EU-28 progress on the entrepreneurship indicator
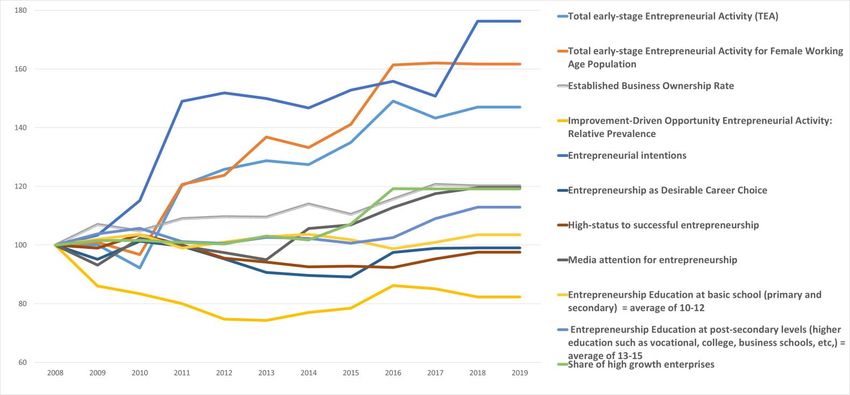
Figure 5 shows the relative position of the EU Member States in As shown in Figure 7, entrepreneurial intentions have increased
terms of: (i) their performance for the most recent year on the significantly since 2008. Additionally, total early-stage
entrepreneurship principle; and (ii) their distance from the EU entrepreneurial activity has increased both overall and for the
average. The best performing EU Member States are currently female working-age population, as have the indicators for the
the Netherlands, Estonia and Ireland. The worst performing EU established business ownership rate and media attention for
Member States overall are Bulgaria, Italy and Belgium. entrepreneurship. However, education-related indicators remain
around the same level as in 2008, with the exception of
entrepreneurial education at college-and-university level, which
Figure 5: Entrepreneurship performance (2018-Q12019) has seen good progress. Perceptions of entrepreneurship as a
desirable career choice remain static, while the indicator for the
high-status of successful entrepreneurship has stagnated after
showing improvements in recent years.
Recent policy developments under entrepreneurship
During the current reference period (2018-Q1/2019), over 60
policy measures were adopted/implemented under the
entrepreneurship principle. This is a lower level of policy activity
than in the previous reference period (2017-Q1/2018) (see
Figure 9). As in previous years, most of the measures recently
adopted/implemented aimed to promote an entrepreneurial
mind-set. Recent examples of policy developments include: (i)
Austria’s ‘Change Maker’ programme, which supports and
mentors young people in senior vocational schools to develop
and implement a start-up project; (ii) Belgium’s ‘Yet Awards’
contest for 12-18 year olds who have started a project; and (iii)
Germany’s blockchain strategy, which is an open public
Note: Malta is not included on this graph due to a lag in data on consultation to develop blockchain strategy in the country.
performance.
More than 665 policy measures have been
Comparative progress of EU Member States adopted/implemented under the entrepreneurship principle since
2011. All EU Member States now have specific measures in
The quadrant chart below (Figure 6) shows each Member State’s
place to increase the number of entrepreneurs and new
relative position in terms of its performance and progress over
companies. Most Member States also have a strong focus on
time on the entrepreneurship principle. The chart shows
entrepreneurial education for both teachers and students (see
disparities in both performance and progress among the EU
Table 2). And more than half of EU Member States also have: (i)
Member States with the most significant progress over time
measures in place that target female and immigrant
(measured as the compound annual growth rate during 2008-
employment; (ii) measures to promote the sharing economy; and
2019), such as Romania, Portugal and Denmark.
(iii) a marketplace and/or specific support/matching schemes to
ensure successful business transfers.
2019 SBA Fact Sheet — European Union 8
Figure 6: Positioning of each EU-28 Member State in terms of their performance and progress over time for
entrepreneurship (2008-2019)

Note: Malta is not included on the entrepreneurship graph due to a lag in data on performance.

2019 SBA Fact Sheet — European Union                                                                    9
Figure 7: EU-28 progress on the entrepreneurship indicator; Base year: 20087

Figure 8: SBA policy measures at EU-28-level for Entrepreneurship (2011 — Q1/2019)

Figure 9 SBA policy measures at EU-28 level for entrepreneurship (2011-Q1/2019)

2019 SBA Fact Sheet — European Union                                                 10
Table 2: Overall policy implementation at EU-28-level for entrepreneurship and scale-up support

 Entrepreneurship                        Are there programmes incorporated into the education curriculum to teach,    23
                                         improve and measure entrepreneurial skills from an early age?
                                         Is there training in place to allow teachers to teach entrepreneurship?      22
                                         Are there sufficient measures in place to provide entrepreneurship support   18
                                         that is specifically targeted at women, young people, the unemployed,
                                         immigrants, and refugees? Entrepreneurship support includes advice,
                                         training, financing, mentoring etc.
                                         Is there a marketplace and/or specific support and matching schemes to       15
                                         ensure successful business transfers?
                                         Are there specific measures to increase the number of entrepreneurs/new      28
                                         company formations?

                                         Specific measures include, in particular: business plan competitions,
                                         rewarding role-model entrepreneurs, entrepreneurship grants, support to
                                         start up a company, measures on social security, tax incentives, strategic
                                         support from clusters, etc.
 Entrepreneurship                        Are new developments in the area of the sharing economy closely              17
 SME Action Programme                    monitored?

2019 SBA Fact Sheet — European Union                                                                                       11
3.2 ‘Second chance’
Comparative performance of EU Member States The chart shows a wide variety of performance levels, with less
variety in progress made. The EU Member States with the most
Figure 10 shows the relative position of the EU Member States significant progress over time (measured as the compound
in terms of: (i) their performance for the most recent year on the annual growth rate in 2008-2019) include Austria, Czechia and
‘second chance’ principle; and (ii) their distance from the EU Cyprus.
average. The best performing states are currently Finland, the
Netherlands and Germany. The worst performing EU Member EU-28 progress on the ‘second chance’ indicator
States overall are currently Malta, Greece, and Luxembourg.
Although ‘second chance’ is not the worst performing principle at
Figure 10: ‘Second chance’ performance (2018-Q12019) EU level, compared to the other principles, there has been little
progress achieved since 2008 (see Figure 12). Meanwhile, the
fear-of-failure rate is the ‘second chance’ indicator which
recorded the highest deterioration since 2011. The indicator for
the cost and time to resolve insolvency has stagnated since
2011, while the indicator for the strength of the insolvency
framework index only started to moderately increase in 2015.
Recent policy developments under ‘second chance’
During the current reference period (2018-Q1/2019), over 10
policy measures were adopted/implemented under the ‘second
chance’ principle (see Figure 14). Recent examples of policy
developments include France’s cancelling of the ‘050’ rating for
failed entrepreneurs, and Luxembourg’s reform of the right of
establishment.
More than 110 policy measures have been
adopted/implemented under the ‘second chance’ principle since
2011. However, it is still not possible to complete legal
bankruptcy proceedings within a year in most EU Member States,
nor is it possible in most EU Member States to be discharged
from bankruptcy within 3 years. Similarly, in most Member
States there is no possibility of automatic discharge for honest
entrepreneurs after liquidation (i.e. there is no ‘fast-track’
Comparative progress of EU Member States discharge). Re-starters are generally treated the same as start-
ups in 19 EU Member States (see Table 3). However, just over
The quadrant chart below (Figure 11) shows each Member half of EU Member States now have early warning and help-
State’s relative position in terms of its performance and desk mechanisms in place to prevent entrepreneurs from going
progress over time on the ‘second chance’ principle. into bankruptcy.
2019 SBA Fact Sheet — European Union 12Figure 11: Positioning of each EU-28 Member State in terms of their performance and progress over time for ‘second chance’ (2008-2019) 2019 SBA Fact Sheet — European Union 13
Figure 12: EU-28 progress on the ‘second chance’ indicator; Base year: 20087

2019 SBA Fact Sheet — European Union                                           14
Figure 13 SBA policy measures at EU-28 level for ‘second chance’ (2011-Q1/2019)

Table 3: Overall policy implementation at EU-28-level for ‘second chance’

 Second chance                           Are legal bankruptcy procedures completed within a year, and is it               10
                                         possible to be discharged from bankruptcy in a maximum of 3 years?

                                         Are re-starters treated on an equal footing with new start-ups?                  19
                                         Are there early warning and help-desk mechanisms in place to prevent             15
                                         entrepreneurs          from         going          into          bankruptcy?
                                         Prevention measures include, in particular: information campaigns, training,
                                         and information sessions on procedures to reduce the stigma of failure.

                                         Is there the possibility of automatic discharge for honest entrepreneurs after   14
                                         liquidation (or fast-track and specific procedures in place for SMEs)?

2019 SBA Fact Sheet — European Union                                                                                           15
3.3 ‘Responsive administration’
Comparative performance of EU Member States The quadrant chart below (Figure 15) shows each Member
State’s relative position in terms of its performance and
Figure 14 shows the relative positioning of EU Member States in progress over time on the ‘responsive administration’ principle.
terms of: (i) their performance for the most recent year on the The chart shows a wide variety of performance levels, with less
‘responsive administration’ and ‘Think Small First’ principles; and variation in progress made. The EU Member States with the
(ii) their distance from the EU average. The best performing most significant progress over time (measured as the compound
states are currently Estonia, Ireland and the Netherlands. annual growth rate during 2008-2019) include Poland, Greece
Croatia, Italy and Slovakia are the worst performing EU Member and the Netherlands.
States.
EU-28 progress on the ‘responsive administration’
Figure 14: ‘Responsive administration’ & ‘Think Small indicator
First’ performance (2018-Q12019)
As shown in one of the ‘responsive administration’ indicators
that showed the most significant progress in the last several
years is the indicator on the time it takes to start a business. The
EU average as of 2018 is just 2.7 days to start a business, at an
average cost of €270.
Recent policy developments under ‘responsive
administration’
More than 60 policy measures were adopted/implemented
during the current reference period (2018-Q1/2019) under the
‘responsive administration’ principle (see Figure 17). Recent
examples of policy developments include Slovenia’s e-
application for a single residence and work permit for foreigners,
and Latvia’s single account to pay all taxes.
Overall, more than 465 policy measures have been
adopted/implemented since 2011 at EU level under the
‘responsive administration’ principle. The ‘once only’ principle has
yet to be fully applied, with most EU Member States failing to
sufficiently connect various public administration databases (see
Table 4). However, most EU Member States now have a one-stop
shop for SMEs, and an effective e-government infrastructure
allowing SMEs to handle many administrative procedures online.
Comparative progress of EU Member States More than half of EU Member States also have an SME envoy
who is highly visible among SME stakeholders and plays a
proactive role in advancing the interests of SMEs.
2019 SBA Fact Sheet — European Union 16Figure 15: Positioning of each EU-28 Member State in terms of their performance and progress over time for ‘responsive administration’ (2008-2019) 2019 SBA Fact Sheet — European Union 17
Figure 16: EU-28 progress on the ‘responsive administration’ indicator; Base year: 20087

2019 SBA Fact Sheet — European Union                                                       18
Figure 17: ‘Responsive administration’ and ‘Think Small First’ performance — (2011-Q1/2019)

Table 4: Overall policy implementation at EU-28-level for ‘responsive administration’

 Responsive administration               Is there a one-stop shop where SMEs can perform all administrative                  20
                                         requirements and where guidance is provided?
                                         If so, is the existing single point of contact responsible for ensuring the         14
                                         effectiveness of start-up procedures?
                                         Is there an effective and SME-friendly e-government infrastructure allowing         19
                                         SMEs to quickly handle all online procedures?
                                         E-government infrastructure of this sort would mean that there is no need for a
                                         notary or in-person application (e.g. for filing tax returns, and social security
                                         returns). It would also mean that credit/debit compensation is allowed, etc.
                                         Are the various databases of different public administrations sufficiently          11
                                         connected so that companies can provide information only once (except for
                                         updates)?
                                         Public administrations include: company registration offices, the tax
                                         administration, the social security administration, labour authorities, etc.
Better regulation                        Is the cross-border implementation of the ‘once only’ principle supported?          10
SME Action Programme
                                         Is the SME envoy highly visible among SME stakeholders, and does he/she play        19
                                         a proactive role between SME stakeholders, the regulatory scrutiny board and
                                         policy makers at national level?

2019 SBA Fact Sheet — European Union                                                                                          19
3.4 State aid & public procurement
Comparative performance of EU Member States EU-28 progress on the state aid & public procurement
indicator
Figure 18 shows the relative positioning of the EU Member
States in terms of: (i) their performance for the most recent year Important methodological changes have been made to this
on the state aid & public procurement principle; and (ii) their principle in this year’s fact sheet. Three new indicators from the
distance from the EU average. The best performing states are Tenders Electronic Daily database have been added. These new
currently Latvia, Lithuania and Czechia. The worst performing EU indicators are:
Member States overall are Italy, Portugal and Belgium. • percentage of awards for which the winner was an SME;
Figure 18: State aid & public procurement performance • proportion of bids by SMEs;
(2018-Q12019) • percentage of calls for tenders which were split into lots.
In addition, the indicator on e-procurement has been removed.
Therefore, the overall performance in this area cannot be
compared with last year’s.
As shown in Figure 20, one of the indicators that showed the
most significant progress since 2008 is the percentage of calls
for tenders which were split into lots. However, the indicator for
the share of businesses having taken part in a public tender of
public procurement procedure has shown the least progress.
Recent policy developments under state aid & public
procurement
During the current reference period (2018-Q1/2019), over 30
policy measures were adopted/implemented under the state aid
& public procurement principle (see Figure 21). Recent examples
of policy developments include Hungary’s changes to the public
procurement law (which improves the operation of the electronic
public procurement system) and Germany’s IT procurement
strategy.
Around 220 policy measures have been adopted/implemented
under the state aid & public procurement principle since 2011. In
almost every EU Member State, state-aid policy addresses SME
Comparative progress of EU Member States needs and there is an effective e-procurement portal through
which all public procurement can be conducted (see Table 5).
The quadrant chart below (Figure 19) shows each Member Most Member States have put in place: (i) ‘public procurement of
State’s relative position in terms of its performance and innovation’ procedures; and (ii) protective measures for SMEs in
progress over time on the state aid & public procurement case of late payments. However, it is common practice in less
principle. The chart shows significant disparities in both than half of EU Member States to cut big tenders into smaller
performance and progress among EU Member States. The EU lots so that small SMEs can apply and bid collectively.
Member States with the most significant progress over time
(measured as the compound annual growth rate during 2008-
2019) include Greece, Portugal and Cyprus.
2019 SBA Fact Sheet — European Union 20Figure 19: Positioning of each EU-28 Member State in terms of their performance and progress over time for state aid & public procurement (2008-2019) 2019 SBA Fact Sheet — European Union 21
Figure 20: EU-28 progress on the state aid & public procurement indicator; Base year: 20087

2019 SBA Fact Sheet — European Union                                                          22
Figure   21:   SBA   policy   measures   at   EU-28 level      for   state   aid   &    public   procurement      (2011-Q1/2019)

Table 5: Overall policy implementation at EU-28 level for state aid & public procurement

 State aid & public procurement           Does the state-aid policy address SMEs’ needs?                                      27
                                          Is there an effective e-procurement portal where all public procurement can         25
                                          be screened and applied?
                                          Are there protective measures in place for SMEs in case of late payments?           18

                                          Is it common practice to: (i) divide big tenders into smaller lots, so that small   13
                                          SMEs can also apply; and (ii) provide opportunities for collective bidding for
                                          SMEs (e.g. via clusters)?
                                          Is there ‘public procurement of innovation’ in place?                               19
                                          Public procurement of innovation refers in particular to pre-commercial
                                          procurement, including procurement of R&D such as: (i) green public
                                          procurement; (ii) sustainable public procurement; (iii) socially responsible
                                          public procurement; (iv) low-carbon procurement, etc.

2019 SBA Fact Sheet — European Union                                                                                               23
3.5 Access to finance
Comparative performance of EU Member States EU-28 progress on the access to finance indicator
Figure 22 shows the relative positioning of the EU Member Three key access to finance indicators have substantially
States in terms of: (i) their performance for the most recent year improved since 2008 (see Figure 24). The number of
on the access to finance principle; and (ii) their distance from the respondents who said there had been a deterioration in the
EU average. The best performing states on this indicator are willingness of banks to provide a loan is half the number of
Belgium, Finland and Denmark. The worst performing EU respondents who indicated a deterioration in 2014 and one third
Member States are currently Greece, Malta and Cyprus. of the number who indicated a deterioration in 2008. In addition,
the percentage of rejected loan applications and loan offers
Figure 22: Access to finance performance (2018-Q12019) whose conditions were deemed unacceptable has decreased
since 2015. The indicator on access to public financial support
including guarantees has improved since 2014.
Recent policy developments under access to finance
During the current reference period (2018-Q1/2019), more than
85 policy measures were adopted/implemented under the access
to finance principle (see Figure 25). This is an increase from the
previous reference period (2017-Q1/2018). As in previous years,
most of the measures consisted of public financing programmes
for SMEs. Recent examples of policy developments include the
launch of Denmark’s ‘InnoFounder’ programme (which brings
financial support to graduates or to entrepreneurs with work
experience), and the Netherlands’ ‘Fund for Responsible
Business’.
More than 735 policy measures have been
adopted/implemented related to the access to finance principle
since 2011. All EU Member States now have funding dedicated
to starting up a business, innovation, proof-of-concept and
commercialisation. All EU Member States also have bank loans
and corresponding guarantee schemes to improve access to
finance for start-ups (see Table 6). EU-based funds for SMEs are
relatively accessible in most EU Member States. Most Member
States also have established business angel funds and venture
Comparative progress of EU Member States capital funds. Almost all EU Member States also have national
grants and risk capital to support SMEs. Funds-of-funds for
The quadrant chart below (Figure 23) shows each Member
alternative equity and debt financing are present in most EU
State’s relative position in terms of its performance and
Member States, as is knowledge on the impact of microfinancing
progress over time on the access to finance principle. The chart
activities. More than half of EU Member States have: (i) a one-
shows significant disparities in both performance and progress
stop shop to help SMEs access funds; or (ii) an expert group
among EU Member States. The EU Member States with the most
offering inspiration and guidance on alternative finance
significant progress over time (measured as the compound
annual growth rate during 2008-2019) include Spain, Portugal .
and Ireland.
2019 SBA Fact Sheet — European Union 24Figure 23: Positioning of each EU-28 Member State in terms of their performance and progress over time for access to finance (2008-2019) 2019 SBA Fact Sheet — European Union 25
Figure 24 EU-28 progress on the access to finance indicator; Base year: 20087

§

2019 SBA Fact Sheet — European Union                                            26
Figure 25: SBA policy measures at EU-28 level for access to finance (2011-Q1/2019)

Table 6: Overall policy implementation at EU-28 level for access to finance

 Access to finance                       Are there bank loans and corresponding guarantee schemes to promote access      28
                                         to loans for SMEs?
                                         Are there business angel funds and venture capital funds established?           27
                                         Are EU-based funds for SMEs relatively easily accessible?                       27
                                         Are there national grants and risk capital to support SMEs and start-ups?       27
                                         Is there funding dedicated to: starting up a business, innovation, proof-of-    28
                                         concept, and the commercialisation of innovation?
                                         Do the legal, tax and/or regulatory frameworks not restrict access to these     26
                                         sources of funding?
                                         Is there a one-stop-shop to help SMEs access the required funds?                17
 Access to finance                       Are funds-of-funds for alternative equity and debt financing established?       24
 SME Action Programme
                                         Is there an expert group on alternative finance, to offer inspiration and       15
                                         guidance?
                                         Has knowledge of the impact of microfinance activities increased? Is the need   21
                                         for target group-specific microfinancing analysed?

2019 SBA Fact Sheet — European Union                                                                                      27
3.6 Single market
Comparative performance of EU Member States shows disparities in both performance and progress among EU
Member States, though there is less variation here than in the
Figure 26 shows the relative position of the EU Member States other 9 principles. Since 2008, far more countries have improved
in terms of: (i) their performance for the most recent year on the overall than deteriorated. The EU Member States with the most
single market principle; and (ii) their distance from the EU significant progress over time (measured as the compound
average. The best performing states are currently Estonia, annual growth rate during 2008-2019) include Portugal, Greece,
Luxembourg and Austria. The worst performing EU Member and Cyprus.
States overall are currently Spain, Romania and Poland.
EU-28 progress on the single market indicator
Figure 26: Single market performance (2018-Q12019)
The average transposition delay of overdue directives at EU level
has overall remained steady during the past several years, but
the number of outstanding single market directives and the
number of pending infringement proceedings have decreased
substantially since 2008 (see Figure 28). The share of SMEs that
are intra-EU online importers and intra-EU online exporters
continues to improve since the adoption of the SBA in 2008. The
latter has nearly doubled since 2008.
Recent policy developments under single market
More than 10 policy measures under the single market principle
were adopted/implemented during the current reference period
(2018-Q1/2019), as shown by Figure 29. Recent examples of
policy developments include Austria’s 5G strategy, and Malta’s
online facilities to facilitate the registration and management of
intellectual property.
Since 2011, more than 100 policy measures related to the single
market have been adopted/implemented. Great policy progress
has been made by all EU Member States in implementing the
various single market directives. And most EU Member States
have now established a comprehensive single point of contact
Comparative progress of EU Member States and an effective SOLVIT centre to help SMEs navigate the single
market and benefit more from it (see Table 7). However, not all
The quadrant chart below (Figure 27) shows each Member EU Member States have put in place measures to help SMEs
State’s relative position in terms of its performance and overcome the difficulties of accessing patents and trademarks
progress over time on the single market principle. The chart within the single market.
2019 SBA Fact Sheet — European Union 28Figure 27: Positioning of each EU-28 Member State in terms of their performance and progress over time for single market (2008-2019) 2019 SBA Fact Sheet — European Union 29
Figure 28: EU-28 progress on the single market indicator; Base year: 20087

2019 SBA Fact Sheet — European Union                                         30
Figure 29: SBA policy measures at EU-28 level for single market (2011 — Q1/2019)

Table 7: Overall policy implementation at EU-28 level for single market

 Single market                          Does the national government take steps to correctly transpose EU laws on       27
                                        time?
                                        Is there a single-point-of-contact to support SMEs within the single market?    24

                                        Is there an effective internal market information system and SOLVIT centre to   26
                                        solve the single-market-related problems of SMEs?
                                        Are there measures to enable SMEs to participate in the development of          24
                                        standards and to help them better access European standards?
                                        Are there measures to help SMEs overcome the difficulties in accessing          22
                                        patents and trademarks within the single market?

2019 SBA Fact Sheet — European Union                                                                                         31
3.7 Skills & innovation
Comparative performance of EU Member States shows disparities in both performance and progress among the
EU Member States. There is an equal split between the share of
Figure 30 shows the relative position of the EU Member States EU Member States that improved or progressed against those
in terms of: (i) their performance for the most recent year on the that have deteriorated. The EU Member States with the most
skills & innovation principle; and (ii) their distance from the EU significant progress over time (measured as the compound
average. The best performing EU Member States are currently annual growth rate during 2008-2019) include Lithuania, Latvia,
Ireland, Belgium and Finland. The worst performing EU Member and Bulgaria.
States overall are currently Romania, Bulgaria and Poland.
EU-28 progress on the skills & innovation indicator
Figure 30: Skills & innovation performance (2018-
Q12019) The share of SMEs selling online has consistently increased each
year since 2008, and the share of SMEs innovating in-house has
also steadily increased. The share of SMEs introducing product or
process innovations has also climbed by more than 5% since
2015. However, the percentage of enterprises employing ICT
specialists has consistently declined since 2008, and has
declined further since last year (see Figure 32).
Recent policy developments under skills & innovation
During the current reference period (2018-Q1/2019), more than
100 policy measures were adopted/implemented under the skills
& innovation heading (see Figure 33). As in previous years, most
of the measures aim to develop the RD&I skills or capacities of
SMEs. Recent examples of policy developments include Spain’s
new grant to SMEs to help with patent applications in Spain and
abroad, and Slovakia’s ‘ICT skills for employees’ (IKT zručnosti
pre zamestnancov) measure, which aims to develop and
strengthen the ICT skills of SME employees.
Overall, since 2011, more than 680 policy measures have been
adopted/implemented under the skills & innovation heading.
Since that time, all EU Member States have established
measures to help SMEs offer training to employees and get
Comparative progress of EU Member States access to business advisory/support services (see Table 8). In
addition, all EU Member States have specific measures in place
The quadrant chart below (Figure 31) shows each Member to support the development of the RD&I skills of SMEs. Most
State’s relative position in terms of its performance and have mechanisms in place to support the commercialisation of
progress over time on the skills & innovation principle. The chart RTD results.
2019 SBA Fact Sheet — European Union 32Figure 31: Positioning of each EU-28 Member State in terms of their performance and progress over time for skills & innovation (2008-2019) 2019 SBA Fact Sheet — European Union 33
Figure 32: EU-28 progress on the skills & innovation indicator; Base year: 20087

2019 SBA Fact Sheet — European Union                                               34
Figure 33: SBA policy measures at EU-28 level for skills & innovation (2011-Q1/2019)

Table 8: Overall policy implementation at EU-28 level for skills & innovation & digitalisation

 Skills & innovation                      Is there a well-developed network of training providers accessible across the       24
                                          country and across different sectors?
                                          Are there public measures to ensure that SMEs can: (i) provide/get access to        28
                                          training for employees; and (ii) get access to business advisory/support
                                          services?
                                          Is there a mechanism in place to assess labour-market needs and to provide          24
                                          education and vocational training to meet the labour-market demand?

                                          Are there specific measures in place to develop the RD&I skills of SMEs and         28
                                          to support high-growth innovative companies?
                                          Is there a mechanism to help SMEs: (i) take part in innovation partnerships at      23
                                          national/EU level; and (ii) commercialise RTD results (i.e. intellectual property
                                          (IPR) management)?
                                          Is there financial support for SMEs which engage in vocational education and        22
Skills & innovation                       training (VET)?
 SME Action Programme                     Is there a common methodology for building a long-term outlook for jobs             13
                                          and skills in each industry to forecast the training and labour needs of SMEs?

                                          Is the European Social Fund used to finance digital skills training for SMEs?       22

                                          Is there appropriate and easily accessible funding for cross-border training?       13

2019 SBA Fact Sheet — European Union                                                                                               35
Digitalisation Is the roll-out of broadband infrastructure supported? 27
Is there a beginner’s guide for SME-digitisation? 12
Is there any help provided to SMEs on digital regulation? 17
Are good-practice sharing opportunities provided for project managers (e. g. 14
for developers of digital learning tools)?
2019 SBA Fact Sheet — European Union 363.8 Environment
Comparative performance of EU Member States Comparative progress of EU Member States
Figure 34 shows the relative position of the EU Member States The quadrant chart below (Figure 35) shows each Member
in terms of: (i) their performance for the most recent year on the State’s relative position in terms of its performance and
environment principle; and (ii) their distance from the EU progress over time on the environment principle. The chart
average. The best performing states are Austria, Luxembourg shows significant disparities in both performance and progress
and Germany. The worst performing EU Member States overall among EU Member States. The EU Member States with the most
are currently Hungary, Cyprus and Greece. significant progress over time (measured as the compound
annual growth rate in 2008-2019) include Luxembourg, Cyprus,
Figure 34: Environment performance (2018-Q12019) and Sweden.
Recent policy developments under environment
More than 30 policy measures were adopted/implemented
during the current reference period (2018-Q1/2019, see Figure
37). Most measures aimed to: (i) provide incentives to
businesses to be eco-efficient; and (ii) fund sustainable energy
use. Recent examples of policy developments include Estonia’s
investment grant for solar panels, and Sweden’s innovation
cluster for liquid biogas, which aims at promoting the transition
to heavy transportation that does not use fossil fuels.
Overall, since 2011, over 200 policy measures were
adopted/implemented at EU level under the environment
heading. Support measures and incentives are widely in place
across the EU to encourage energy efficiency and the use of
renewables by SMEs. Support measures and incentives are also
widely in place to encourage the development of innovative eco-
efficient processes, products or services (see by Table 9).
However, green public procurement is not yet commonplace, and
most EU Member States have not adopted measures to help
SMEs become EMAS certified.
2019 SBA Fact Sheet — European Union 37Figure 35: Positioning of each EU-28 Member State in terms of their performance and progress over time for environment (2008-2019) 2019 SBA Fact Sheet — European Union 38
Figure 36: EU-28 progress on the environment indicator;
Base year: 20087

2019 SBA Fact Sheet — European Union                      39
Figure 37: SBA policy measures at EU-28 level for environment (2011-Q1/2019)

Table 9: Overall policy implementation at EU-28 level for environment

 Environment                            Are there support measures in place to ensure energy efficiency/use of         26
                                        renewables by SMEs?
                                        Support measures include measures to encourage the development of
                                        innovative eco-efficient processes, products or services; and measures to
                                        encourage their uptake by traditional companies.
                                        Are there support measures to incentivise SMEs to become EMAS certified?       10

                                        Are there support measures to put in place green public procurement?           18
                                        Are there support measures such as an organisation specifically responsible    15
                                        for providing strategic support to SMEs to ensure to ensure they comply with
                                        environmental and energy regulations?

2019 SBA Fact Sheet — European Union                                                                                        40
3.9 Internationalisation
Comparative performance of EU Member States progress over time on the internationalisation principle. The chart
shows more disparities in performance than in progress. Nearly
Figure 38 shows the relative position of the EU Member States all EU Member States have improved in internationalisation since
in terms of: (i) their performance for the most recent year on the 2008. The EU Member States with the most significant progress
internationalisation principle; and (ii) their distance from the EU over time (measured as the compound annual growth rate in
average. The best performing EU Member States are Denmark, 2008-2018) include Poland, Italy, and Slovakia.
Lithuania and Croatia. The worst performing EU Member States
overall are currently Czechia, Greece, and Portugal. EU-28 progress on the internationalisation indicator
Figure 38: Internationalisation performance (2018- According to the latest figures, the percentage of extra-EU
Q12019) exports and imports of goods by SMEs in industry has increased
overall since 2008 (see Figure 40). Indeed, the share of SMEs
who are ‘extra-EU online exporters’ has substantially increased
since 2008.
Recent policy developments under internationalisation
More than 40 policy measures were adopted/implemented in the
current reference period (2018-Q1/2019), as illustrated in Figure
41. Recent examples of policy developments include Ireland’s
nationwide delivery of ‘Prepare Your Business for Customs’
training workshops, and Portugal’s ‘Internationalisation
opportunities voucher’ (Vale oportunidades de
internacionalização). Portugal’s programme provides financial
support to SMEs to access consultancy services on assessing
internationalisation skills, developing an internationalisation
business plan, and developing a marketing strategy.
Since 2011, around 280 policy measures have been
adopted/implemented in the EU to help SMEs do business
abroad. Most EU Member States have now set up an umbrella
organisation to provide different types of support services to
help SMEs to do business abroad. And nearly all EU Member
States have put in place different types of financial support
Comparative progress of EU Member States measures dedicated to helping SMEs in their international
business activities (see Table 10).
The quadrant chart below (Figure 39) shows each Member
State’s relative position in terms of its performance and
2019 SBA Fact Sheet — European Union 41Figure 39: Positioning of each EU-28 Member State in terms of their performance and progress over time for internationalisation (2008-2019) 2019 SBA Fact Sheet — European Union 42
Figure 40: EU-28 progress on the internationalisation
indicator; Base year: 20087

2019 SBA Fact Sheet — European Union                    43
Figure 41: SBA policy measures at EU-28 level for internationalisation (2011-Q1/2019)

Table 10: Overall policy implementation at EU-28 level for internationalisation

 Internationalisation                     Is there an umbrella organisation providing all sorts of support (strategic,     24
                                          operational, legal, financial, linguistic, etc.) to SMEs to promote their
                                          internationalisation and to stimulate trade and exports?
                                          Is there financial support (loans, guarantees, equity, export credit insurance   27
                                          facilities) available specifically for SME internationalisation?
                                          Are there missions/partnership agreements/trips/networking events                28
                                          organised by the responsible authorities to promote new market entry by
                                          SMEs inside and outside the EU?
                                          Are there clusters, accelerators and trade organisations in the country to       27
                                          boost SME internationalisation?

 Access to market                         Are there single access points for information on applicable rules and           24
 SME Action Programme                     regulations in foreign markets?

2019 SBA Fact Sheet — European Union                                                                                            44
4. Interesting initiatives In this section, we present recent examples of interesting initiatives for each SBA principle from EU Member States to show what governments can do to support SMEs. 2019 SBA Fact Sheet — European Union 45
Entrepreneurship

GO! campaign — Germany

The GO! start-up campaign aims to promote business start-ups; strengthen the culture of entrepreneurship in Germany;
and encourage people to identify opportunities to start a business and put their own ideas into practice. The GO! initiative
bundles several existing and new measures in 10 focus areas. These focus areas include: the improvement of social and
political appreciation for self-employed people; the provision of economic knowledge and entrepreneurial thinking; the
simplification of company succession; the improvement of the environment for setting up businesses; and encouraging
women and migrants to found their own companies. GO! also aims to simplify business creation and business succession,
while improving the conditions for start-up financing. It is supported by a joint declaration of the Ministry of Economy and
Energy and key business organisations. GO! is being supported by a comprehensive communication campaign (outdoor,
print and online advertising, post cards, website), trade fairs, conferences, etc.

References:

https://www.existenzgruender.de/DE/GO/inhalt.htmlwww.abc.se

https://www.bmwi.de/Redaktion/DE/Downloads/Monatsbericht/Monatsbericht-Themen/2018-12-auf-einen-
blick.pdf?__blob=publicationFile&v=4

‘Second chance’

Second Chance Business Scheme — Greece

The ‘Second Chance Business Scheme’ (Πρόγραμμα δεύτερης επιχειρηματικής ευκαιρίας) is being implemented by the Manpower
Employment Organisation. The scheme aims to reintegrate 5,000 unemployed — or formerly self-employed — people back into
the workforce or to provide them with an opportunity to set up a business. Eligible and selected applicants will receive grants to
create the new business. The scheme has a budget of €80 million.

References:

http://www.oaed.gr/-/programma-deuteres-epicheirematikes-eukairias-5-000-anergon-proen-autoapascholoumenon-me-stocho-
ten-epanentaxe-tous-sten-agora-ergasias

2019 SBA Fact Sheet — European Union                                                                                                 46
You can also read