NIRP, Bank Profitability and Risk-Taking: Much Ado About 50 Basis Points - European Parliament
←
→
Page content transcription
If your browser does not render page correctly, please read the page content below

IN-DEPTH ANALYSIS
Requested by the ECON committee
Monetary Dialogue Papers, June 2021

 NIRP, Bank
 Profitability and Risk-
 Taking: Much Ado
 About 50 Basis Points

 Policy Department for Economic, Scientific, and Quality of Life Policies
 Directorate-General for Internal Policies
 Authors: Daniel GROS, Farzaneh SHAMSFAKHR EN
 PE 662.919 - June 2021

NIRP, Bank
Profitability and Risk-
 taking: Much Ado
About 50 Basis Points
 Monetary Dialogue Papers
 June 2021

 Abstract
 A widespread concern about negative policy rates is that they
 might depress bank profits and encourage risk-taking. We find
 that the impact of negative rates per se is limited. Other policy
 measures (TLTROs, tiered deposits) have largely neutralised the
 impact of NIRP on bank profits. Asset purchases might have
 been more important by compressing the yield curve. Any small
 positive impact of negative rates on lending and aggregate
 demand may have been swamped by the negative impact of
 low rates on productivity.
 This paper was provided by the Policy Department for
 Economic, Scientific and Quality of Life Policies at the request of
 the committee on Economic and Monetary Affairs (ECON) ahead
 of the Monetary Dialogue with the ECB President on 21 June
 2021.
This document was requested by the European Parliament's committee on Economic and Monetary
Affairs (ECON).

AUTHORS
Daniel GROS, CEPS
Farzaneh SHAMSFAKHR, CEPS

ADMINISTRATOR RESPONSIBLE
Drazen RAKIC

EDITORIAL ASSISTANT
Janetta CUJKOVA

LINGUISTIC VERSIONS
Original: EN

ABOUT THE EDITOR
Policy departments provide in-house and external expertise to support European Parliament
committees and other parliamentary bodies in shaping legislation and exercising democratic scrutiny
over EU internal policies.

To contact the Policy Department or to subscribe for email alert updates, please write to:
Policy Department for Economic, Scientific, and Quality of Life Policies
European Parliament
L-2929 - Luxembourg
Email: Poldep-Economy-Science@ep.europa.eu

Manuscript completed: June 2021
Date of publication: June2021
© European Union, 2021

This document was prepared as part of a series on “Low for Longer: Effects of Prolonged Negative
Interest Rates”, available on the internet at:
https://www.europarl.europa.eu/committees/en/econ/econ-policies/monetary-dialogue

 Follow the Monetary Expert Panel on Twitter: @EP_Monetary

DISCLAIMER AND COPYRIGHT
The opinions expressed in this document are the sole responsibility of the authors and do not
necessarily represent the official position of the European Parliament.
Reproduction and translation for non-commercial purposes are authorised, provided the source is
acknowledged and the European Parliament is given prior notice and sent a copy.
For citation purposes, the publication should be referenced as: Gros, D, Shamsfakhr, F. NIRP, Bank
Profitability and Risk-Taking: Much Ado About 50 Basis Points, Publication for the committee on
Economic and Monetary Affairs, Policy Department for Economic, Scientific, and Quality of Life
Policies, European Parliament, Luxembourg, 2021.
NIRP, Bank Profitability and Risk-Taking: Much Ado About 50 Basis Points

CONTENTS
LIST OF BOXES 4
LIST OF FIGURES 4
LIST OF TABLES 4
LIST OF ABBREVIATIONS 5
1. INTRODUCTION 7
2. NEGATIVE RATES IN THE EURO AREA 9
3. MODEL OF THE REVERSAL RATE 13
4. THE MODEL AND REALITY 16
5. A LOOK AT THE DATA 18
6. RISK-TAKING CHANNEL 21
7. LOW RATES AND LOW PRODUCTIVITY 28
8. CONCLUSION 29
REFERENCES 30

 3 PE 662.919
IPOL | Policy Department for Economic, Scientific and Quality of Life Policies

LIST OF BOXES
Box 1: The two-tier system 9
Box 2: The reversal rate in a nutshell 13
Box 3: Literature on risk taking and low or negative rates 22

LIST OF FIGURES
Figure 1: Key ECB policy interest rates, TLTRO, PSPP 10
Figure 2: Estimated impact of NIRP on bank loans to firms (percentage p.a.) 12
Figure 3: Return on assets (percentage) 18
Figure 4: Lending margins on loans to NFCs (percentage point) 19
Figure 5: Ratio of net fee and commission income to total assets (percentage) 20
Figure 6: Ratio of risk-weighted assets to total assets (percentage) 25
Figure 7: Loan-to-deposit ratio (percentage) 26
Figure 8: Volatility of return on assets (over five years, percentage) 27

LIST OF TABLES
Table 1: Measures of risk in the literature 22

PE 662.919 4
NIRP, Bank Profitability and Risk-Taking: Much Ado About 50 Basis Points

LIST OF ABBREVIATIONS
APP Asset purchase programme

BoJ Bank of Japan

ECB European Central Bank

EP European Parliament

EU European Union

LCR Liquidity coverage ratio

NFCs Non-financial corporations

NIRP Negative interest rate policy

NPLs Non-performing loans

PEPP Pandemic emergency purchase programme

PSPP Public sector purchase programme

QE Quantitative easing

RoA Return on assets

SSM Single Supervisory Mechanism

TLTRO Targeted longer-term refinancing operations

ZIRP Zero interest rate policy

 5 PE 662.919
IPOL | Policy Department for Economic, Scientific and Quality of Life Policies

EXECUTIVE SUMMARY
● The presumption that negative interest rate policies (NIRP) depress profitability of banks
 and lead to more risk-taking is widespread, but difficult to document. The available evidence
 does not suggest a large effect either way.
● Much of the literature does not distinguish between low and negative rates. This
 contribution focuses mainly on negative policy rates, not “low for long”.
● Negative rates are supposed to constitute a special case of low rates because banks have not
 been able or willing to institute negative deposit rates for retail deposits, thus leading to a loss of
 revenues.
● This potential impact of negative rates on bank profitability could be substantial, but it has
 been offset by two other policy measures: targeted longer-term refinancing operations
 (TLTROs) and tiered deposits.
● Banks have re-financed almost half of their lending to non-financial corporations (NFCs)
 through very cheap long-term lending from the ECB (longer-term refinancing operations
 [TLTRO]). The interest savings alone from the TLTRO compensated the loss of income from not
 charging negative rates on household deposits.
● Under the two-tier deposit scheme introduced in 2019, the negative rate applies only to
 about three quarters of excess reserves, providing further relief to banks.
● The popular model of a “reversal rate” (Brunnermeier and Koby, 2018) does not assume
 that negative rates are special. On the contrary, the reversal rate, i.e. the level below which
 further rate cuts become contractionary, could well be positive in this model.
● Bank profitability has not shown a clear trend in the euro area since NIRP was introduced in
 2014. Profitability as measured by standard indicators has in general remained low, but increased
 slightly since NIRP started. Whether this was because of NIRP or in spite of it is impossible to
 prove, given that different indicators point in different directions. Moreover, there is great
 heterogeneity across different national banking markets.
● A number of indicators suggest a slight reduction in banks’ risk since 2014, and again there
 are large differences between different countries.
● A more important negative side effect of “low for long” might arise through an entirely
 different channel, namely through the impact on competition since low rates give an
 advantage to incumbent firms, making it easier for them to either buy up competitors or price
 them out of the market. A prolonged period of low/negative rates could thus have a negative
 impact on growth.

PE 662.919 6
NIRP, Bank Profitability and Risk-Taking: Much Ado About 50 Basis Points

1. INTRODUCTION
Following the 2008-2009 global financial crisis, central banks in several developed economies
employed unprecedented monetary policies including quantitative easing (QE), forward guidance,
and lowering their policy rates to zero (ZIRP). In the summer of 2014, the ECB went further and
adopted a negative interest rates policy (NIRP) to provide additional monetary stimulus to the
economy, and thus to get inflation up to a level consistent with its price-stability mandate (“below
but close to 2%”). However, this policy, like other unconventional measures, has remained
controversial. The debate has mostly centred on the possible side effects of NIRP and the
transmission of monetary policy.
The longer-term consequences of keeping rates negative have been studied for some time, first
under the heading: “low for long” (with negative rate regarded as being simply a special kind of low
interest rate). A 2016 European Systemic Risk Board (ESRB) report (ESRB, 2016), on the danger of “low
for long”, was mainly concerned with the life insurance sector, which has considerable contracts
outstanding with guaranteed rates of return above the current rates (on riskless securities). This
concern has abated as the actual returns on the portfolios of life insurance companies have remained
high enough to cover the older guaranteed returns given the performance of stock markets. Very
recently the ESRB has returned to this argument finding more reasons to be concerned about the
negative impact of an environment of ‘lower for longer’ for the wider financial system (ESRB, 2021).
One interpretation of “low of long” means that as short-term rates (determined basically by ECB
policy rates) remain low for a long time, the long-term rates fall towards the level of the short-term
ones. This was the case for a few years after negative rates were first introduced in 2014. By 2018-2019
long-term riskless rates as proxied by the ten-year Bund had converged to the policy rates of the ECB.
However, recent developments in financial markets have illustrated once more that central banks
have only a limited influence over long-term rates. Over the last months, riskless long rates have
increased substantially although the ECB has not changed its stance.
In economic theory, there should be little difference between very low but positive and negative
interest rates. However, in practice it seems that negative rates constitute a special case because de
facto banks are reluctant to charge for deposits. This seems to be the case much more for household
deposits than for deposits by commercial entities. Schnabel (2020) shows that only a very small
fraction of household deposits are remunerated at negative rates. In this sense, negative rates are
special. This report will thus concentrate on the impact of negative rates, not on the effect of low
interest rates in general.
We set the scene in Section 2 by describing the timeline of negative rates, emphasising the fact that
most NIRP steps were accompanied by other policy actions, some of which offset the impact of NIRP
on profits and some of which may have had a negative impact on profits of banks.
Section 3 examines the model proposed by Brunnermeier and Koby (2018), which emphasises that
the reversal rate could also be positive. In Section 4, we discuss whether key features of the model
correspond to reality. Section 5 concentrates on different measures of profitability since the start of
NIRP, and Section 6 provides a summary of the literature on NIRP and risk-taking.
The discussion about the potential limits to the effectiveness of negative policy rates to stimulate
bank lending, and thus to influence aggregate demand, neglects another strand of the literature
which has investigated the impact of low interest rates on productivity and supply. Several
contributions to this literature have found that lower interest rates can have a negative effect on

 7 PE 662.919
IPOL | Policy Department for Economic, Scientific and Quality of Life Policies

productivity growth. We briefly summarise this strand of the literature in Section 7. Section 8
concludes the paper.

PE 662.919 8
NIRP, Bank Profitability and Risk-Taking: Much Ado About 50 Basis Points

2. NEGATIVE RATES IN THE EURO AREA
A closer look at the history of negative rates in the euro area reveals that they were introduced and
changed in a very gradual manner. Moreover, many of the steps concerning negative rates were
accompanied by other measures, making it difficult to disentangle the impact of negative rates from
that of these other measures.
The ECB first set its deposit rate at a negative value in June 2014 (-0.1%). It decreased this later the
same year to -0.2 %, with further cuts of 0.1 points in 2015, 2016, and 2019. Each step was thus only
ten basis points whereas the “normal” change in policy rates was 25 basis points as long as the
deposit rate was positive.
The introduction of negative rates in 2014 was accompanied by the first TLTROs, which provide term
financing at special low rates. Later pushes of the deposit rate further into negative territory were
accompanied by the asset purchase programmes, which are designed to lower long term rates, and
the final lowering of the deposit rate was accompanied by the introduction of a two-tier system,
under which part of excess reserves are exempted from the negative deposit rate. Figure 1 illustrates
this.

Box 1: The two-tier system

 The two-tier system exempts an amount equal to six times the required reserves of a bank from the
 negative rate. As of May 2021, the result of this system was that about EUR 880 billion of excess
 reserves were exempted from paying the deposit rate of 0.5%, resulting in savings for banks of
 around EUR 4.4 billion annually. About EUR 2,400 billion of excess reserves, plus the total amount
 under the deposit facility, were still subject to the negative rate, implying that the exempted
 amount represented about a quarter of the total (880 out of 3,280 billion) 1.
 This implies that the “effective deposit rate” (effective in terms of the profits and loss account of
 banks) is now close to 37.5 basis points, lower than the official rate of 50 basis points.
 The total in negative rates owed by commercial banks to the Eurosystem under the tiered system
 amounts now to about EUR 16 billion per annum (0.5% of 3,280 billion).
 A two-tier system has also been applied in other countries with negative rates.
 For example, the Swiss National Bank, whose deposit rate is at -0.75%, even more negative than
 that of the ECB, has exempted an even larger share of excess reserves (up to 20 times the required
 reserve ratio) from this rate, so that in reality only a small proportion of excess reserves are charged
 the negative rate. In Japan, the negative rate is still only -0.1%, a negligible magnitude, but even
 still, a large part of reserves is exempted. This shows that central banks in general have been
 concerned about limiting the impact of negative rates on bank profits.
 The two-tier system of the ECB could also be described as an increase in the required reserve ratio
 by a factor of six. Such an increase in the required reserve ratio would have been considered
 extremely contractionary before the advent of negative rates. But with negative rates an increase in
 required reserves has the opposite effect.

1 ECB website: “Two-tier system for remunerating excess reserve holdings”. https://www.ecb.europa.eu/mopo/two-
 tier/html/index.en.html.

 9 PE 662.919
IPOL | Policy Department for Economic, Scientific and Quality of Life Policies

Figure 1: Key ECB policy interest rates, TLTRO, PSPP
 8

 7
 PSPP increase
 6
 TLTRO II
 5
 TLTRO TLTRO III
 4
 PSPP increase
 3
 PSPP start
 2

 1

 0

 -1

 ECB Deposit facility ECB Marginal lending facility ECB Main refinancing operations

Source: Authors’ own elaboration based on data from ECB Statistical Data Warehouse.

All these concomitant changes make it difficult to isolate the impact of negative rates in terms of
monetary policy transmission and key mechanisms such as the pass-through of funding costs to loan
rates.
A further difficulty for empirical studies regarding the impact of negative policy rates on credit
growth is that the deposit rate is the price for one very short-term financial instrument, namely excess
reserves at the ECB, which can be withdrawn on a daily basis. This is why one would expect the rate
on sight deposits at commercial banks to be closely related to the deposit rate of the ECB.
However, this represents only one aspect. Bank loans to non-financial corporations (NFCs) are usually
for 3-5 years. Banks will thus price their loan rates with respect to the riskless rate of this tenor. Other
policy measures, such as bond buying programmes and forward guidance were especially designed
to influence (lower) longer-term rates, including this intermediate part of the yield curve. When the
ECB uses several instruments at the same time as it introduces negative rates (or lowers them further)
it becomes impossible to disentangle the impact of the negative rate from that of bond buying or
forward guidance.
The broader point is that banks are engaged in maturity transformation, they “borrow short and lend
long”. The profitability of banks thus increases typically with the slope of the yield curve, bank profits
are higher when medium to long term rates are above the short-term rate. What matters for bank
profitability is thus not the level of the short-term rates, but the difference between long and short
rates. When the ECB started the public sector purchase programme (PSPP) (its largest asset purchase
programme), the intention was to compress the yield curve. Any negative impact on bank

PE 662.919 10
NIRP, Bank Profitability and Risk-Taking: Much Ado About 50 Basis Points

profitability one observes after 2014 could thus have been the consequence of a compression of the
yield curve, rather than the inability of banks to set negative deposit rates. 2
Figure 1 also shows that the magnitude of negative rates is small (0.5% in total over several years)
compared to the changes in the deposit rate in the first decade of the euro. Clearly, paying particular
attention to 0.5% negative rates makes sense only if negative rates are somewhat special, i.e. if
lowering the deposit rate from 1% to 0.5% is qualitatively different from lowering it from 0 to -0.5%.
Negative rates are supposed to be special because banks might not be able to set negative rates on
the deposits they need to finance lending. Schnabel (2020) shows that this has partially been the
case. Banks seem to have been able to pass negative rates on their deposits from NFCs, but not on
household deposits. This observation allows one to calculate an order of magnitude of the potential
impact of NIRP on bank profits.
Household (sight) deposits amount today to about EUR 4 trillion. The inability of banks to transmit
fully negative ECB rates to these customers could mean a potential loss of roughly 0.5% of this sum,
or about EUR 20 billion per annum. It has been shown above that the “effective” negative rate is closer
to -0.4% if one takes into account the tiered deposit scheme in force from 2019. The effective loss for
banks might thus be closer to EUR 16 billion. The loss from not charging negative rates on household
deposits is thus equal to the direct cost banks have to pay on all their excess reserves. 3
Moreover, the ECB is offering banks substantial amounts of long-term financing at, or even below, the
ECB’s deposit rate. As of May 2021, this long-term financing amounted to over EUR 2 trillion,
equivalent to nearly half of all the lending by banks to NFCs 4. Banks will be charged a rate of
potentially 50 basis points below the deposit rate if they meet certain thresholds on loan growth. This
means that banks can obtain funding at -1%, much less than even the zero rate they maintain for
most household deposits. A 1% gain on EUR 2 trillion represents a subsidy of EUR 20 billion annually.
The TLTROs can thus offset on their own the cost of negative ECB deposit rates for banks. 5
In principle, one needs to distinguish between the stimulating impact of negative rates by lowering
the market rates for very short-term assets and the impact on profits. The tiered deposit scheme is
designed to maintain the incentive of low interest rates while cushioning the impact on profits. By
contrast, the TLTROs were explicitly designed to provide incentives for more lending, with the impact
on profits just being a side effect.
Schnabel (2020) argues that NIRP has had a positive impact on loan growth in the euro area by
enhancing the monetary policy transmission. She argues that a survey of existing studies arrives at
the conclusion that the growth of loans extended to NFCs has been higher, since the start of the NIRP
in mid-2014, than it would have been in a counterfactual scenario of non-negative policy rates (see
Figure 2 below). 6
However, the difference between the actual growth of loans and the median of the counterfactual
estimates is minute, only 0.3% per annum. Over several years, a 0.3% difference can accumulate, but

2 One should also note that about 60% of all bank loans to NFCs are at variable rates. This implies that the debtor takes the risk of interest
 rate changes. This is a fact which is not taken into account in the “reversal interest rate” model presented below.
3
 It is also well known that interest rates do not constitute the main cost of deposits for banks. Set-up costs, including “know your
 customer” obligations and IT costs constitute a large share of the overall cost of collecting deposits. Over time, banks can thus adjust
 their fees for household deposits to offset the impact of negative interest rates. Non-interest income has indeed increased over the last
 year, suggesting that at least part of the cost of deposits has been transferred to consumers.
4 ECB website: “Consolidated financial statement of the Eurosystem”. 14 May 2021.
 https://www.ecb.europa.eu/press/pr/wfs/2021/html/ecb.fst210518.en.html
5 Somewhat surprisingly, ESRB, 2021, does not mention the TLTRO as a factor offsetting the impact of negative rates on bank profitability.
6 A very recent study by Rostagno et al. (2021), based on counterfactual analysis, show that in the absence of NIRP, forwards guidance
 and QE, euro area would have experienced a lower GDP growth and inflation by 1.1 pp and 0.75 pp, respectively, and a higher
 unemployment rate by 1.1 pp in 2019. However, they do not discuss the possible impact on banks profitability.

 11 PE 662.919
IPOL | Policy Department for Economic, Scientific and Quality of Life Policies

even over seven years one would arrive only at a gain of about 2%. Given a total volume of lending to
NFCs of less than EUR 5 trillion, this would translate into additional lending of EUR 100 billion, less
than 1% of the euro area economy (distributed over seven years).
Moreover, it is not clear what the counterfactuals assume about the TLTROs, which could be
considered as a part of NIRP, and might have had a substantial impact on lending.

Figure 2: Estimated impact of NIRP on bank loans to firms (percentage p.a.)

Source: ECB Economic Bulletin, Issue 03/2020, Altavilla et al. (2018), Bubeck et al. (2019), Bottero et al. (2019).

Note: The blue line is the actual annual NFC loan growth (six-month moving average). Based on a range of empirical studies,
the grey area represents the dispersion in loan growth among banks according to their exposure to NIRP-specific effects.
The dashed line represents the median across all studies.

PE 662.919 12
NIRP, Bank Profitability and Risk-Taking: Much Ado About 50 Basis Points

3. MODEL OF THE REVERSAL RATE
The reversal interest rate is defined as the rate at which accommodative policy becomes
contractionary. This concept is proposed and theoretically examined by Brunnermeier and Koby
(2018). They start with a partial equilibrium model, which means that they look only at the activities of
a single bank and do not examine the impact higher or lower bank lending overall might have on the
entire economy. Central to their model are two financial frictions. One limits lending to a certain
multiple of the net worth of the bank (not its capital, this distinction is important). The other one
forces banks to hold a certain amount of liquid assets, again as a proportion of net worth.
The first element is supposed to reflect the fact that banking regulation forces banks to hold a certain
amount of capital proportional to the amount of lending the bank does (or more general the amount
of risky assets on the balance sheet of the bank).
The second element corresponds to the liquidity coverage ratio (LCR) under which banks have to
hold a certain part of their balance sheet in highly liquid high-quality assets to be able to make good
any sudden loss of deposits.
An often overlooked aspect of the model is that it does not assume that negative rates are special.
Negative deposit rates can arise at commercial banks in this model, but this does not have to be the
case. In this model, banks will always set a rate on their deposits that is below the policy rate set by
the central bank. This implies that a policy rate of zero would correspond to a negative deposit rate at
commercial banks.
It is possible that the reversal rate could be positive, and the rate commercial banks offer on their
deposits could then be either positive or negative, depending on the mark-down banks adopt
towards their depositors.
Other, conventional, elements of the model are the assumptions that firms will demand more loans if
the bank lowers the interest rate and that depositors will increase their deposits if the bank offers a
higher rate. However, there is no special effect as the deposit rate offered by the bank goes negative.

Box 2: The reversal rate in a nutshell

 The starting point is the capital constraint specified as:
 ≤ (1)
 where ≥ 0 is risk weight, and and denote the bank's loans and bank's net worth
 respectively. The demand for bank’s loan ( ) is decreasing in the nominal policy interest rate .
 is the nominal rate on loans offered by the bank and increasing in .
 Banks also face a liquidity constraint:
 ≥ (2)
 where > 0 is weight, and and indicate bank’s deposit and fixed-income assets with a
 return equivalent to . Deposit ( ) and the deposit rate both are increasing in .
 Banks maximise their net worth:
 = (1 + ) + (1 + ) − (1 + ) (3)
 subject to the constraints, as well as its balance sheet + = + , which can be used to
 simplify equation (3) as:

 13 PE 662.919
IPOL | Policy Department for Economic, Scientific and Quality of Life Policies

 = + ( ) ∗ + − ( ) ∗ (4)
 in which one can substitute for and from the two financial friction constraints (1) and (2).

 0 = + ( / ) ∗ + − ( ) ∗ − (5)

 This defines an implicit function, ( , ) = 0, with deposits remaining the single choice variable.
 The derivative of with respect to is equal to:
 ( ) ( )
 = − − ( ) = − ( ) � ( )
 + 1� = 0 (6)

 With linear demand function for deposits: = + , this simplifies to:

 = − ( + + ) = − ( + 2 ) = 0 (6)′

 With linear demand for deposits the optimal amount deposits is given by:
 −
 = (6)′
 2

 Deposits and loans are related by the balance sheet balance identity and the liquidity constraint on
 holding safe assets: = (1 − ) + .
 It follows that, with linear demand for deposits, loans will always be a positive function of the safe
 interest rate and a reduction in interest rates will lower the supply of loans.
 The result would be different if the demand for deposits were given by a constant elasticity
 function.
 This implies that the optimal amount of deposits is given by:

 ( )
 = ( )
 � ( ) − 1�

 The optimal amount of deposits would then depend on the size of the elasticity, changing sign
 depending on whether that elasticity is greater or smaller than 1.
 Brunnermeier and Koby emphasise an additional effect by assuming that the value of equity, ( ),
 is a function of the riskless rate (set by the central banks) because it is subject to revaluation
 following changes in policy rates. It is assumed that the initial equity consists of an interest-
 insensitive ̅ component and interest-sensitive ( ) component where ( )/ < 0, reflecting a
 maturity mismatch. This is the second key element of the model.
 Solving the optimisation problem without substituting out for the constrained values for and
 leads to the following lending and deposit rates:
 1 ∗
 ∗ = + +
 λ (4)
 ∗ 1 +

 capital constraint

 1 ∗
 ∗ = − +
 λ (5)
 ∗ 1 +

 liquidity constraint

PE 662.919 14
NIRP, Bank Profitability and Risk-Taking: Much Ado About 50 Basis Points

 ( ) ( )
where ∗ = and ∗ = are, respectively, elasticity of loan demand and

deposit supply with respect to the corresponding rates.

Cut to policy rate initially increases the bank's loans < 0, by lowering the loan interest rate

insofar as the capital constraint does not bind, however it depresses the return on new
investments in fixed-income assets and, thus net interest income and profits leading to lower
bank's net worth:
 = + − (6)
There exists an interest rate , the largest rate, below which the capital constraint binds. For all
the interest rates below this threshold < , / > 0. At the point the policy rate hits the
reversal interest rate = , / = 0 , therefore banks divert loan investment into fixed-
income asset investment. Further interest rate cut amplifies the adverse impact on banks’ profit
which decreases the loans through the constraint.
In this model, a lower policy rate leads always to lower profits for banks. This raises the question
what happens if low rates persist for long and the rate of return on investment in banking falls
below the cost of capital. In this case, one would expect that banks close down or merge and
downsize (Repullo, 2020).

 15 PE 662.919
IPOL | Policy Department for Economic, Scientific and Quality of Life Policies

4. THE MODEL AND REALITY
In this section, we compare briefly the main elements of the model with a number of key elements of
the structure of the euro area banking system, in order to check whether the mechanisms described
by the model operate in reality.
The key element of the model is the assumption that the capital constraint for the bank depends on
its current period net interest income, which in turn depends on the interest rate set by the monetary
authorities. In reality, however, banking regulation is based on the accounting, or regulatory, value of
the capital of a bank, which is not adjusted when the interest rate changes. This implies that the
regulatory capital constraint is not affected by current profits and the interest rate.
This is an important point because in the traditional banking model, in which loans are limited to a
multiple of capital (in reality the regulatory capital, i.e. the capital as defined in great detail in banking
regulations) there can be no reversal rate. When banks face limits on how much lending is allowed
given their capital structure, they will simply go up to that limit. Lower central bank policy rates can,
under certain circumstances, lead to lower bank profits. But, whatever the level of profits, whether
high or low, banks still have an incentive to increase lending up to the limit imposed by regulators.
This remains true as long as lending rates exceed deposit rates, which is largely the case as
documented below. Repullo(2020) also emphasises this basic point.
High profits can lead over time to more capital, but this build-up of capital is too gradual to be
compatible with the assumption of the model that the capital ratio is defined in terms of net worth.
Repullo also makes this point and argues that the accumulation of profits contributes over time to
higher equity (only if profits are not distributed as dividends), but that this process takes time. The
profitability of banks is very low in Europe. This implies that the accumulation of profit can contribute
only little to the accumulation of capital, which in turn means that it is the level of current capital
which represents the main constraint.
The main limit to bank lending in the Brunnermeier-Koby model is the variable “net income” which is
also called “net worth”, should rather be called “lending margin” (on loans to NFCs). As will be shown
below, this lending margin oscillates around 1.5%. However, banks now hold close to 10% of capital
against such loans. It would thus take a long time for changes in the interest margin to lead to a
significant change in capital.
In the longer run, the level of capital available to the banking system should depend on its
profitability. Investors will provide banks with additional capital only if the rate of return in banking is
at least equal to the rate of return available in other sectors (on a risk-adjusted basis) and capital
would be taken out of banks as long as expected profit rates elsewhere are higher. In the long run,
one would thus expect that bank lending would indeed depend on the profitability of banks. This
raises the question of whether a reversal rate might still exist, as deeply negative rates could lower
the profitability of banks so much that capital flees the sector, reducing its ability to provide loans.
Repullo investigates this issue and finds that there can be no reversal rate even if the supply of capital
reacts to bank profitability.
Another aspect of this model which does not take into account reality is that the maturity of loans
and deposits is implicitly the same. This is difficult to accept given that the core of the business of
banks is to use short-term deposits to fund longer-term loans and mortgages.
Another feature of this model for which it is difficult to find an equivalent in reality is the assumption
that the value of equity of banks is a function of the riskless interest rate. The book value of equity is
usually just the difference between assets and liabilities. One could of course argue that the market

PE 662.919 16
NIRP, Bank Profitability and Risk-Taking: Much Ado About 50 Basis Points

value of equity of banks in general is a function of the riskless rate. But this does not mean that the
book value of equity should be just the difference between the value of all assets (loans and the
riskless asset) minus deposits.
There are other, perhaps minor, aspects of the model that also do not seem to be in line with reality.
For example, the funding cost for banks can also be influenced by other monetary policy instruments,
like the TLTRO. As documented above, banks have re-financed almost half of their lending to NFCs via
very cheap long-term lending from the ECB (TLTROs). Moreover, under the two-tier deposit scheme
introduced in 2019, the negative rate applies only to about three quarters of excess reserves.
Moreover, one needs to take into account that, since it is not possible to charge negative rates on
household deposits, lost income can be offset by higher fees. Murai and Schnabl (2021) document
that the share of fee income in total profits has increased from 5% to 20% since 1999 for Japanese
banks which have been operating in a very low interest rate environment for a long time.
One also needs to keep in mind that lending to NFCs constitutes only a small part (13%) of the total
assets of banks. Overall bank profitability is determined by many other factors.

 17 PE 662.919
IPOL | Policy Department for Economic, Scientific and Quality of Life Policies

5. A LOOK AT THE DATA
Even if there is no reversal rate, there still remains the concern that negative rates might have
depressed bank profits because household deposit rates have not become negative, at least not on a
wide scale. We thus provide some indicators of profitability.
In the following charts we show in general the data for the four largest euro area economies, because
in most instances the euro area average is not representative of anything. Individual countries are not
clustered around this average. The large countries (which dominate any average) are either below or
above that average.
The numbers for profits used in these statistics are of course the accounting profits reported by
banks. The managers of banks have an incentive to smooth profits. After a financial crisis, losses on
non-performing loans (NPLs) are often recognised only with a delay, in order to give the banks time
to replenish their capital. This is what happened in those countries most under financial stress in
2011-2012. For this reason alone, one would expect a number of years with low or even negative
profits after 2012. NIRP was introduced in 2014 when this process of recognising losses on NPLs was
still going on, making it difficult to identify the impact of negative rates.
Another reason why trends in reported profits might be misleading is that from time to time major
institutions experience a crisis which is often the result of having hidden problem loans until they are
discovered and all acknowledged at once. This leads to sudden large losses which might come after a
period of apparent profitability.

Figure 3: Return on assets (percentage)
 1
 0,8
 0,6
 0,4
 0,2
 0
 2008 2009 2010 2011 2012 2013 2014 2015 2016 2017 2018 2019
 -0,2
 -0,4
 -0,6
 -0,8
 -1
 -1,2

 Germany Spain France Italy EA

Source: Authors’ own elaboration based on data from ECB Statistical Data Warehouse.
Note: “EA” is euro area.

Figure 3 illustrates these problems. The return on assets (RoA) is extremely variable (and mostly
negative) in Italy up to 2016. The RoA is less volatile elsewhere, but there are large differences across
countries. The return on assets lowest in Germany for some years now, only about a third of the
return of French banks. The average for the euro area, which is in the middle of these extremes, has

PE 662.919 18
NIRP, Bank Profitability and Risk-Taking: Much Ado About 50 Basis Points

considerably increased since 2014. This suggests that either NIRP did not have any impact on
profitability (for the reasons outlined above: TLTROs and tiered deposits) or there were other factors,
which more than offset the inability to charge negative rates on household deposits.
However, another piece of evidence would seem to confirm the presumption that negative policy
rates depress the interest margin of banks because the cost of deposits cannot fall below zero. The
lending margin on loans to NFCs is shown in Figure 4. It is apparent again that there are very large
differences across member countries, but these differences do not correlate well with the data on
overall profitability presented above. Banks in Italy have the lowest margin, most of the time since
2012, 50% lower than those in Spain. But the difference in profitability is much smaller. This could be
due to higher loss rates in Spain or higher non-interest income in Italy (which will be documented
below). What is even more surprising is that the lending margin has been almost exactly the same in
France and Germany, but that the RoA are very different as shown above. The lending margin, which
in the model presented above plays a crucial role is thus in reality not a good indicator of profitability.

Figure 4: Lending margins on loans to NFCs (percentage point)
 3

 2,5

 2

 1,5

 1

 0,5

 0

 Germany Spain France Italy

Source: Authors’ own elaboration based on data from ECB Statistical Data Warehouse.
Note: First three months average.

Here again one can observe the long shadow of the financial crisis for Spain and Italy. The lending
margin shot up during the crisis, but this was due to the fact that banks had to ask for higher rates to
cover expected losses. Once the economy recovered, the lending margins declined because fewer
firms went bankrupt, reducing the loss rate on lending. The lending margin has been less variable in
countries where banks were not subject to financial stress in 2011-2012, like France and Germany.
ESRB (2021), which looks only at the euro area average emphasizes the fact that one can observe a
(small) fall in the margin, after the introduction of negative rates. Our interpretation is different as the
euro area average is influenced by the delayed impact of the financial stress in countries like Italy or
Spain. 7

7 Lending margins refer to the difference between interest rates on new business loans and a weighted average interest rate on new
 deposits, while interest margin is measured as the difference between interest income and interest cost in terms of average assets.

 19 PE 662.919
IPOL | Policy Department for Economic, Scientific and Quality of Life Policies

Another important element contributing to profitability is the income from fees and commissions.
Figure 5 below again shows very large differences, which explain the discrepancies between the data
on RoA and lending margins. Banks in Italy earn much more from fees than those in Germany. But this
source of income seems rather stable, showing on average a slight increase since 2014, which could
be partially explained by the substitution of negative rates on deposits by fees.

Figure 5: Ratio of net fee and commission income to total assets (percentage)
 1,5

 1,3

 1,1

 0,9

 0,7

 0,5

 0,3

 0,1

 -0,1

 Germany Spain France Italy Euro area

Source: Authors’ own elaboration based on data from ECB Statistical Data Warehouse.

The yield curve compression through asset purchases might have had a stronger impact on bank
profitability than negative (policy) rates. It is no coincidence that the second and third waves of the
TLRO, which provide lending at subsidised rates, were introduced when the three-year rates (on
riskless government bonds) reached new lows in 2016 and 2019.

PE 662.919 20
NIRP, Bank Profitability and Risk-Taking: Much Ado About 50 Basis Points

6. RISK-TAKING CHANNEL
Another key concern about NIRP is that negative interest rates can pose risks to financial stability.
Banks with profitability might increase their risk. The financial crisis of 2008-2009 showed that
excessive risk-taking by banks can be very costly to the economy. It is thus understandable that more
risk-taking by banks is seen a priori as undesirable. However, the term “risk” can have many different
meanings, especially for banks. For example, the risk for banks increases if they hold less equity to
absorb unexpected losses. A thin cushion of equity is generally held to have been one of the key
causes of the global financial crisis. After this crisis, supervisors all over the world forced banks to hold
more equity. This type of risk is thus in principle controlled. But when banks extend more credit to
new borrowers they take another type of risk, one that might be desirable. One of the aims of low
interest rates is to encourage this type of risk-taking, on condition that the risk be recognised and
adequately provisioned for.
Schnabel (2020) thus argues that inducing risk-taking should be regarded as a feature, not a bug, of
negative rate policies. The purpose of NIRP is to encourage higher bank lending to stimulate the
economy. More lending necessarily means more risk-taking by banks.
The ECB, in different functions, is responsible for both types of risk. By setting low, and now negative,
policy rates, it encourages risk-taking. At the same time, its supervisory arm, the Single Supervisory
Mechanism (SSM), is responsible for banking supervision, whose main aim is to “de-risk” banks. This
creates the danger that one arm of the ECB (monetary policy) encourages banks to take risks by
lending to new borrowers, while another arm prevents banks from doing so in the pursuit of financial
stability.
Even before central banks introduced negative rates there were warnings that banks were likely to
“search for yields” in response to decreased profitability at the cost of expanding loans with lower
credit quality (Rajan, 2005; Borio and Zhu, 2008). This phenomenon has been the subject of a number
of empirical studies8. Most of these studies deal with the issue of the consequence of low interest
rates in general (as opposed to negative rates). Many of them find evidence of increasing banks risks
in response to low rates (Altunbas et al., 2010; Gaggl and Valderrama, 2010; Maddaloni and Peydró,
2011; Buch et al. 2014; Genay and Podjasek, 2014; Jimenez et al., 2014; Aramonte et al., 2019;
Ioannidou et al., 2015; Andries et al., 2016; Dell’Ariccia et al., 2017). Fewer studies look more
specifically at negative rates (Nucera et al., 2017; Hong and Kandrac, 2018; Basten and Mariathasan,
2018; Heider et al., 2019).
The effect of interest rates on banks profitability and risk-taking can be very different depending on a
bank’s business model, balance sheet, degree of capitalisation and banking system, and regulatory
environment. This is emphasized in Buch et al. 2014; Dell’Ariccia et al., 2017; Nucera et al., 2017; BIS,
2018; Boungou, 2019. Table 1 provides a structured overview of the existing empirical literature on
risk-taking, including the measures used to assess the bank’s risk. Further below we look at some of
these measures for the EU's big four economies (alongside the euro area as a whole).

8 Angeloni et al. (2015) and Balloch and Koby (2019) investigate theoretically the impact of low interest rates on bank risk-taking and
 bank profitability.

 21 PE 662.919
IPOL | Policy Department for Economic, Scientific and Quality of Life Policies

Box 3: Literature on risk taking and low or negative rates

 The table below summarises the main results from this vast literature. Most of these contributions
 investigate the impact of low rates in general, only very few consider the specific case of negative
 (policy) rates. Basten and Mariathasan (2018) focus on domestically owned retail Swiss banks 9. They
 find that banks with higher exposed reserves to the negative deposit facility rate by one standard
 deviation increased the balance sheet shares of uncollateralized loans by 0.60 percentage points
 (pp), the share of mortgages by 0.69pp, and the share of financial assets by 0.26pp. Also based on
 their results, higher exposed reserves (by one standard deviation) lead to an increase in the ratio of
 risk-weighted assets by 1.51pp, which is attributable to riskier loans.
 Heider et al. (2019) show that the introduction of negative policy rates by the ECB leads to more
 risk-taking and less lending by euro area banks, which are more reliant on deposit funding.
 According to their result, 9.45pp increase in banks’ deposit ratio after July 2012 is associated with
 16% increase in their ROA volatility. Also, 14.76pp increase in a bank’s deposit ratio leads to a
 reduction in lending by 13%.
 Hong and John Kandrac (2018) document that bank stock prices dropped when in January 2016
 the Bank of Japan (BoJ) imposed a negative interest rate of -0.1% on banks' current accounts held
 at the BoJ. As a result, 1pp decline in a bank's stock price was followed by about a 4% increase in
 the standard deviation of its daily returns, 0.58% decrease in the bank's capital-to-asset ratio, and
 between a 10% and 15% increase in probability of default within the next five years after the
 announcement.

Table 1: Measures of risk in the literature
 Sample of
 Measures of bank’s risk Borrowers Findings
 banks
 ● Low levels of real policy
 rate (measured as money-
 ● Expected default
 Altunbas et market rate minus
 frequency (EDF) NFCs, HH EU, US
 al. (2010) inflation) over an extended
 ● ROA volatility
 period contribute to an
 increase in bank risk.
 ● Negative relation between
 ● Z-score (1) short-term and long-term
 Andries et al.
 ● Loan loss provisions NFCs, HH Euro area interest rates and bank risk-
 (2016)
 ● NPLs taking, with greater impact
 during 2008-2011 crisis.
 ● Decrease in longer-term
 Aramonte et ● Probability of default
 NFCs US interest rates increases the
 al. (2019) of loan portfolios
 risks for nonbanks.
 ● Expansionary monetary
 policy (low effective
 Buch et al. ● Loan risk assessed by Federal Funds rate)
 NFCs US
 (2014) the banks increases small domestic
 banks exposure to risk.
 ● “Too low for too long”

9 A cut from zero to -75 basis points was introduced in January 2015 and applied only to the fraction of each bank’s central bank reserves
 that exceeded twenty times its minimum reserve requirement.

PE 662.919 22
NIRP, Bank Profitability and Risk-Taking: Much Ado About 50 Basis Points

 Sample of
 Measures of bank’s risk Borrowers Findings
 banks
 interest rates affect foreign
 banks risk exposure.
 ● Negative policy rates
 ● Share and growth of
 increase credit and interest
 risk-weighted assets
Basten and rate risk for banks.
Mariathasan ● Banks’ credit risk,
 NFCs, HH Switzerland ● More exposed banks
 market risk, interest
(2018) maintain non-negative
 rate risk and
 deposit rates and larger
 operational risk
 deposit ratios.
 ● Increases in short-term
 ● Risk rating of new loans interest rates is negatively
 ● Change in commercial associated with ex ante
 and industrial (C&I) bank risk-taking.
Dell’Ariccia et loans NFCs US ● This relationship is less
al. (2017) ● Ratio of holdings of pronounced for banks with
 risky securities to total relatively low capital or
 assets during periods of financial
 distress.
 ● Period of low refinancing
 rates is associated with
Gaggl et al. ● Probability of
 NFCs Austria higher expected default
(2010) borrowers’ default
 rates within Austrian banks’
 business-loan portfolios.
 ● Borrowing firm’s ROA, ● More risk-taking and less
 stock-return volatility, lending by euro-area banks
Heider et al.
 leverage, and interest NFCs Euro area with higher reliance on
(2019)
 rate associated with deposit funding following
 the loan negative policy rates.
 ● Large banks with
 sufficiently diversified
 income streams are
 perceived to be less
Nucera et al.
 ● SRisk(2) NFCs, HH Euro area (systemically) risky. Smaller
(2017)
 banks that rely
 predominantly on deposit
 funding, are perceived as
 more risky.
 ● Low short-term interest
 ● High securitisation rates soften lending
Maddaloni
 activity, weak standards especially for
and Peydró NFCs, HH Euro area, US
 supervision for bank mortgages. The effect is
(2011)
 capital increased over prolonged
 period of low rates.
 ● Lower overnight interest
Jiménez et al. ● Borrowers’ credit
 NFCs Spain rate increases the risk for
(2014) history
 low capitalised banks.
 ● Lower policy rate
Ioannidou et ● Borrowers’ credit
 NFCs Bolivia encourages banks to
al. (2015) history
 extend riskier loans.
Hong and ● Share of risk-weighted ● More exposed banks to
 NFCs Japan
Kandarac assets negative rates increase

 23 PE 662.919
IPOL | Policy Department for Economic, Scientific and Quality of Life Policies

 Sample of
 Measures of bank’s risk Borrowers Findings
 banks
 (2018) ● Volatility of returns their credit and take on
 ● Banks' distance to more risk.
 default
 ● Kamakura Default
 Probability (KDP)
 ● Z-scores
 ● Capital-to-asset ratio

Source: Authors’ own elaboration
Note: (1) Z-score is computed as the ratio of the return on assets plus the capital-asset ratio, to the standard deviation of
assets returns. (2) SRisk is the estimated capital shortfall of a bank, conditional on a 40% drop in a world equity index over a
six months-ahead horizon.

The empirical studies surveyed here have generally found that banks increase risk-taking in response
to lower rates. But here again the impact of negative rates in the euro area since 2014 is difficult to
pinpoint in the aggregate data, especially lending to NFCs.
A key indicator of risk-taking for regulators is the ratio of risk-weighted assets to total assets, where
risk-weighted assets means that each asset is given a risk weight which could range from zero
(sovereign bonds, for example) to 100% or more (some loans to NFCs, for example).
Figure 6 shows that this indicator has been rather stable and on a declining trend since 2008, where
again the change is most noticeable in countries under financial stress (Spain and Italy), with little
change for France and Germany. This trend has most probably been due to the pressure of
supervisors who wanted to de-risk banks after the financial crisis. It is difficult to detect any change
after the start of NIRP in 2014. After that date, one observes a small increase in Germany, but the
decline continues in Spain and Italy. The small increase in risk-weighted assets in Germany is
compatible with the hypothesis that the negative deposit rate of the ECB had its strongest impact in
Germany where rates were already close to zero. But the increase is too small to have had any
significant impact.

PE 662.919 24
NIRP, Bank Profitability and Risk-Taking: Much Ado About 50 Basis Points

Figure 6: Ratio of risk-weighted assets to total assets (percentage)
 80

 70

 60

 50

 40

 30

 20

 10

 0

 Germany Spain France Italy Euro area

Source: Authors’ own elaboration based on data from ECB Statistical Data Warehouse.

Another more basic indicator, which is directly related to the models of banking mentioned above is
the ratio of loans to deposits. Figure 6 below shows that this ratio has declined continuously (except
for France, one year) since 2014, i.e. the start of NIRP. 10
This decline in the aggregate deposit ratio is probably due also to a macroeconomic factor, namely
the increase of the savings rate in the euro area. As savings tend to take the form of bank deposits in
Europe, any increase in the overall savings rate is likely to lead to higher bank deposits. If investment
does not increase at the same time, the ratio of loans to deposits must fall in the aggregate.

10 This indicator is available only since 2014 in the ECB’s Statistical Data Warehouse. It is thus impossible to compare the post-NIRP values
 to the preceding period.

 25 PE 662.919
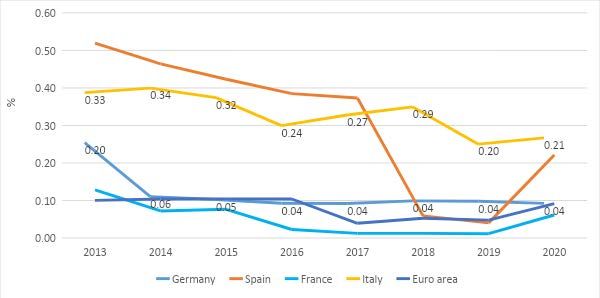
IPOL | Policy Department for Economic, Scientific and Quality of Life Policies

Figure 7: Loan-to-deposit ratio (percentage)

 120

 110

 100

 90

 80

 70

 60

 50

 Germany Spain France Italy Euro area

Source: Authors’ own elaboration based on data from ECB Statistical Data Warehouse.

The literature often uses another measure of risk, namely the volatility of the return of banks. Some
studies have used the standard deviation of the return on assets over the preceding five years. But
this measure is itself rather volatile due to the large jumps in profits illustrated above. Figure 8 shows
the very large difference across Member States and the large jumps in this measure for countries like
Spain where one year of large losses led to large jumps in the volatility measure based on five years of
data. The euro area average has fallen slightly since 2014 (from 0.6% to 0.4%), indicating that NIRP did
not lead to an increase in risk-taking large enough to overcome the overall reduction in risk due to
resumption of steady growth after the financial crisis.

PE 662.919 26
NIRP, Bank Profitability and Risk-Taking: Much Ado About 50 Basis Points

Figure 8: Volatility of return on assets (over five years, percentage)

Source: Authors’ own elaboration based on data from ECB Statistical Data Warehouse.

These traditional indicators of risk-taking by banks thus show a decline, rather than an increase in risk
taking by banks. But one might also use other, indirect, measures of risk.
For example, one would expect that lending to higher risk customers would be associated with
higher interest rates and loan losses. However, this has not been the case. NPL ratios have fallen,
rather than increased since the start of NIRP. Interest rates charged to NFCs have also fallen over time,
indicating that banks actually perceive a falling risk of default of their customers.
The fall in NPL ratios might be due to the gradual recovery of the economy from the deep recession in
2011-2012, but the fall in interest rates, relative to the refinancing costs of banks (the lending margin
shown above in Figure 4) is not compatible with the hypothesis that banks have taken on more risk
(unless one assumes that banks are knowingly taken on more risk without being compensated for it).
One measure of whether banks are taking more risks is the interest rate on loans to NFCs. The rates on
risky loans (or rather the difference between the cost of capital and these rates) needs to increase if
the banks incur more risk. (Banks can incur more risk by investing in risky securities, but this is not
how the usual banking model works.) The cost of borrowing (which includes more than just the
interest rate) of NFCs has fallen over the last years (absolute and relative to ECB policy rates).The same
applies to a more narrow concept, namely the interest rates on loans to NFCs. Banks were thus not
compensated for higher risk in lending to NFCs.
A general problem with linking indicators of risk after 2014 to negative rates is that there is another
confounding factor. 2014 was also the year that the ECB took over the responsibility of supervising
the bulk of the euro area’s banking system. It is generally agreed that the ECB enforced the existing
banking regulations more strictly than the national supervisors had done before. Moreover, the
regulations themselves were tightened, adding for example, a minimum of highly liquid assets which
banks have to hold. These developments forced banks to de-risk their balance sheets, potentially
more than offsetting any impact on risk-taking negative rates might have had.

 27 PE 662.919
IPOL | Policy Department for Economic, Scientific and Quality of Life Policies

7. LOW RATES AND LOW PRODUCTIVITY
The generally accepted view of monetary policy is that it cannot affect the “natural” or equilibrium
rate of interest, which is determined by longer run trends in the savings investment balance. The task
of monetary policy is merely to maintain price stability. The central bank can push actual inflation
towards the price stability target by (temporarily) setting its policy rates below the natural rate when
inflation is too low (and vice versa: when inflation is too high, the central bank should increase its
policy rate above the natural rate) (ESRB, 2021; Gros, 2019).
One could thus argue that monetary policy should not be held responsible for the negative impact of
lower interest rates on productivity, which operates in the medium- to long-term, and policy rates
should in principle be fluctuating around the natural rate, sometimes above and sometimes below.
However, the ECB has now held its policy rates in negative territory for a number of years, and this
may have contributed to the observed fall in productivity growth.
This literature has found several reasons why low interest rates might lower productivity growth.
One channel is via market structure. Incumbent firms are always tempted to deter new competitors
by charging a low price today in order to secure or maintain a monopoly position for later (Liu et al.,
2019).
Aghion et al. (2019) argue that the relationship between financial conditions and growth is (inverted)
U-form: a financial crisis kills investment and growth. Super accommodative financial conditions are
also bad for growth.
Empirical evidence is provided by Cette et al. (2016) who argue that a decline in real interest rates can
trigger unfavourable resource reallocations that reduce total factor productivity. They argue that this
has been the case particularly for the Southern members of the euro area since 1995, and can explain
the fact that in these countries total factor productivity even fell (a phenomenon which has been
dubbed the “great unlearning”, Hassan and Ottaviano, 2013)
ECB’s TLTROs illustrate the potential impact of low rates on productivity. Under the TLTRO III, banks
can refinance additional loans to NFCs or households at rates up to 50 basis points below the ECB
deposit rate (which is minus 50 basis points). This means that banks will have an incentive to
refinance even loss-making investments.

PE 662.919 28
You can also read