City of Wyndham Aboriginal Community 2009 - Early Childhood Community Profile
←
→
Page content transcription
If your browser does not render page correctly, please read the page content below

Early Childhood
                 Community Profile

 City of Wyndham
Aboriginal Community
       2009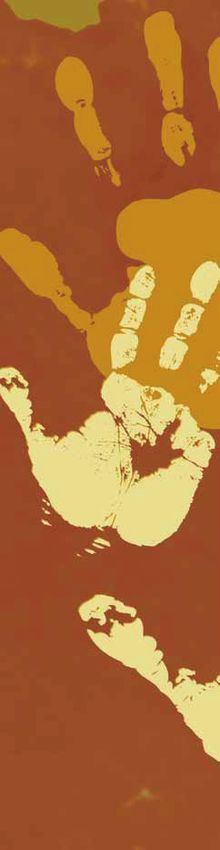
Early Childhood Community Profile

                City of Wyndham
              Aboriginal Community
                       2009

This Aboriginal Early childhood community profile was prepared by the Office for Children and Portfolio
Coordination,
C    di   i   in
              i the  Victorian
                  h Vi     i   Government
                               G          Department off Education
                                          D              Ed     i  and Early
                                                                      dE      Childhood
                                                                           l Childh    dDDevelopment.
                                                                                              l

The series of Early Childhood community profiles draw on data on outcomes for children compiled
through the Victorian Child and Adolescent Monitoring System (VCAMS).

The profiles are intended to provide local level information on the health, wellbeing, learning, safety
and developmental outcomes of young Aboriginal children. They are published to aid Aboriginal
organisations and local councils, as well as Best Start partnerships, with local service development,
innovation and program planning to improve these outcomes.

The Department of Human Services, the Department of Education and Early Childhood Development
and the Australian Bureau of Statistics provided data for this document.
Aboriginal Early Childhood Community Profile i Published by the Victorian Government Department of Education and Early Childhood Development, Melbourne, Victoria, Australia. January 2010 © Copyright State of Victoria, Department of Education and Early Childhood Development, 2010 This publication is copyright. No part may be reproduced by any process except in accordance with the provisions of the Copyright Act 1968. Principal author and analyst: Hiba Molaeb Authorised by the Department of Education and Early Childhood Development, 2 Treasury Place, East Melbourne, Victoria, 3002.
Aboriginal Early Childhood Community Profile ii

Contents
Introduction                                                                                               1

Part A:        Child and family demographics for Wyndham (C)
               A population profile                                                                        2
               Measuring disadvantage                                                                      3
               Aboriginal households                                                                       4
               Aboriginal families                                                                         4
               Families with Aboriginal children                                                           5
               Family composition                                                                          7
               Family income                                                                               8
               Family employment                                                                           9
               Education level of families                                                                 11
               Family Tenure                                                                               12
               Need for assistance with core activities                                                    13

               Victorian Child and Adolescent Outcomes Framework                                           14

Part B:        Early childhood indicators for Wyndham (C)
               Low birth weight babies                                                                     15
               Maternal and child health participation                                                     16
               Maternal and child health home consultation visit                                           18
               Maternal and child health 3.5 year ages and stages visit                                    19
               Child protection renotifications                                                            20
               Child protection substantiations                                                            21
               Children fully immunised                                                                    22
               Kindergarten participation                                                                  25
               Assessment of reading of children in government schools                                     26
               Hospitalisations for asthma                                                                 29
               Leading cause of hospitalisations                                                           31
               Teen births                                                                                 34

Appendices

Appendix A     Methodology for producing a guide measure of the Aboriginal population                      36
Appendix B     Data sources                                                                                38
Appendix C     Glossary of terms                                                                           40
Appendix D     Bibliography                                                                                47
gfhf
Aboriginal Early Childhood Community Profile   1

Introduction
The Aboriginal Early childhood community profiles are compiled by the Data, Outcomes and Evaluation Division of the
Department of Education and Early Childhood Development (DEECD).

The profiles are intended to provide local level information on the health, wellbeing, learning, safety and developmental
outcomes of young Aboriginal children. They are published to aid Aboriginal organisations and local councils, as well
as Best Start partnerships, with local service development, innovation and program planning to improve these
outcomes.

The Early Childhood Community Profiles , developed for all Local Government Areas (LGAs) in Victoria, the Aboriginal
Early Childhood Community Profiles , developed for LGAs with large Aboriginal communities, and the Catalogue of
evidence-based interventions, which provides evidence-based strategies to address the indicators reported in the
profiles, are all products of the Victorian Child and Adolescent Monitoring System (VCAMS).

VCAMS is a comprehensive, across government, monitoring system that reports on the safety, health, development,
learning and wellbeing of children and young people, aged 0 to 18, in Victoria. It is intended to underpin planning for
improvement at a program, local government and statewide level, as well as to inform research and evaluation to
generate new evidence on effectiveness.

What is included?
The 2009 Aboriginal Early childhood community profiles have been updated and expanded since the last release in
2007. Data are presented under the following two sections:

Aboriginal and Torres Strait Islander persons have been referred to as 'Aboriginal' throughout these profiles. For
definitions on the populations used throughout this section, please refer to the glossary at Appendix C.

Please note that due to the small population is Aboriginal young children and their families in the local area, large
percentage variations may be the result of minor changes in the actual data.

Part A: Child and family demographics
This section contains child and family demographics for the Aboriginal population within the LGA, sourced from the
2006 Census. This section has been expanded and updated since the previous edition of these profiles.

Please note that due to the introduced random error in large Census tables, totals presented in one section of these
profiles may differ slightly to those presented in other sections, or some percentages may sum to greater than 100%.
See 'introduced random error' in the glossary for more information.

Part B: Early Childhood Indicators
This section contains the most recent administrative data for a selection of health and wellbeing early childhood
indicators. The indicators included in this section are a subset of the 150 indicators that form VCAMS.

Data included in this section span across 7 outcome areas within VCAMS. A total of 12 indicators of child health,
development, learning, safety and wellbeing have been presented in these profiles. Four new indicators have been
included in this edition:

• Maternal and Child Health home consultation visits
• Maternal and Child Health 3.5 year key ages and stages visit
• Hospitalisations for asthma
• Leading cause of hospitalisations

Some data presented have been pooled across numerous financial or calendar years due to the small numbers of the
population being measured at an LGA level.

Data included in this edition of the profiles may not be comparable to the previous edition for the following reasons:
• pooled data for selected indicators have been aggregated for different reporting periods
• rate based calculations use a different population base as a new methodology to estimate the intercensal Aboriginal
population was introduced (see Appendix A).
Aboriginal Early Childhood Community Profile   2

  Demographics

  A population profile

  2006 Aboriginal population of Wyndham (C)

                                                Aboriginal population                             Total Population
                                                                Percentage                                       Percentage
                                          Children Total (all                            Children   Total (all
                                                                  children                                         children
                                          aged 0-8     ages)                             aged 0-8     ages)
                                                                  aged 0-8                                         aged 0-8
  Wyndham (C)                                    171            707           24.2         16,280        112,697             14.4
  Western Metropolitan Region                    569         2,880            19.8         78,478        682,900             11.5
  Victoria                                     6,650        30,143            22.1        556,791      4,932,422             11.3
  Source: ABS 2006 Census of Population and Housing

• At the 2006 Census, 4,932,422 persons were enumerated in Victoria. Of these, 30,143 were Aboriginal,
  representing 0.6% of Victoria's population.

• According
  A     di to t the
                th 2006 Census,
                          C      th
                                 there          Ab i i l persons in
                                       were 707 Aboriginal          i Wyndham
                                                                      W dh      (C) This
                                                                                (C). Thi representst 0.6%
                                                                                                     0 6% off
  the total population of Wyndham (C). This was greater than the percentage of Aboriginal persons in Victoria.

• In 2006, 556,791 children aged 0 to 8 years were counted in Victoria at the 2006 Census, representing 11.3%
  of Victoria's total population. Of these, 6,650 (1.2%) were Aboriginal children.

• In 2006, 24.2% of the Aboriginal population in Wyndham (C) were aged 0 to 8 years, compared to 14.4% in the
  total population
        population.

• Wyndham (C) was ranked 20 out of 76 LGAs in terms of the proportion of Aboriginal population aged 0 to 8
  years. A rank of 1 was assigned to the LGA with the highest proportion of its Aboriginal population aged 0 to 8.

  Figure 1: Percentage of children aged 0 to 8 years in Wyndham (C) compared to the Western
  Metropolitan region and Victoria.
               30

               25
                      24.2
               20                                                                               22.1
  Percentage

                                                            19.8
  Percen

               15
                                 14.4
               10                                                     11.5                                  11.3

                5

                0
                       Wyndham (C)                    Western Metropolitan Region                    Victoria
                                             Aboriginal population    Total population

• The percentage of Aboriginal children aged 0 to 8 years in Wyndham (C) was 24.2%. This was greater than the
  percentage of Aboriginal children aged 0 to 8 years in the Western Metropolitan region (19.8%) and greater
  than the percentage of Aboriginal children in this age group in Victoria (22.1%). This pattern is similar to that of
  all children aged 0 to 8 years.
Aboriginal Early Childhood Community Profile 3
Demographics
Measuring disadvantage
The Australian Bureau of Statistics (ABS) produces the Socio-Economic Indexes for Areas (SEIFA).
These indexes are derived from data collected in the Census of Population and Housing. SEIFA 2006
comprises four indexes that measure different aspects of socio-economic conditions by geographic
areas.
The Index of Relative Socio Economic Disadvantage (IRSED) is one part of SEFIA. It allows users to
identify geographic areas that are relatively disadvantaged.
IRSED is derived from Census attributes believed to reflect disadvantage, such as:
- low income
- low educational attainment
- high unemployment
- proportion of work force in relatively unskilled occupations
The IRSED score for Wyndham (C) is 1022.
A lower IRSED score means a more disadvantaged area.
• Wyndham (C) was in the 9th decile out of all LGAs across Australia. The 1st decile contains the 10% of
LGAs that are most disadvantaged across Australia and the 10th decile contains the least
disadvantaged.
• Wyndham (C) was ranked 58 out of 79 LGAs in Victoria. A rank of 1 was assigned to the most
disadvantaged LGA in Victoria.
The IRSED can be used to compare disadvantage across LGAs and within LGAs where the LGA
consists of more than one Statistical Local Area (SLA).
There are 204 SLAs in Victoria which make up the 79 LGAs.
Statistical Local Area IRSED scores within Wyndham (C)
Wyndham Wyndham
Statistical Wyndham
(C) - (C) -
Local Area (C) - West
North South
Wyndham (C) SLA
IRSED 1017 1006 1101
Rank out of 204 SLAs 124 108 196
• There are 3 SLAs in the LGA of Wyndham (C). The IRSED scores and ranks of these areas within
Victoria are presented in the table above.
A rank of 1 was assigned to the most disadvantaged Statistical Local Area in Victoria.
Note: Where "Bal" appears in the above table, it refers to balance or rest of LGA not covered by the other
SLAs.Aboriginal Early Childhood Community Profile 4
Demographics
Aboriginal households
• Based on the 2006 Census, there were 1,767,512 households in Victoria. Of these 14,154 or 0.8% were households with at
least one Aboriginal person resident in that household on Census night.
Aboriginal households in Wyndham (C)
Aboriginal households Other Households (a)
Aboriginal
Percentage of Households Percentage of
households
Total households with households
with Total other
Aboriginal with at least children with at least
children households
households one child aged aged 0 to 8 one child aged
aged 0 to 8
0 to 8 years years 0 to 8 years
years
Wyndham (C) 127 309 41.1 9,714 36,392 26.7
Western Metropolitan Region 437 1,453 30.1 47,578 239,033 19.9
Victoria 4,708 14,154 33.3 330,358 1,767,512 18.7
Source: ABS 2006 Census of Population and Housing
(a) Other household includes Non-Aboriginal households and households where Aboriginal status of residents were not stated.
• The percentage of Aboriginal households in Wyndham (C) with children aged 0 to 8 was 41.1%. This was greater than the
percentage of other households in Wyndham (C) with children aged 0 to 8 (26.7%).
Aboriginal families
• At the 2006 Census, 1,294,388 families were recorded in Victoria. Families with children under 15 years and/or dependent
students aged 15 to 24 years accounted for just under half (48.2% or 623,647 families) of all families in Victoria. Of these,
7,222 were families with Aboriginal children under 15 years and/or dependent students aged 15-24 years, representing 1.2%
of all families in this category.
• Of the 336,092 families in Victoria with children aged 0 to 8 years, 4,654 were families with Aboriginal children aged 0 to 8
years, representing 1.4% of families in this category. The percentage of families with Aboriginal children aged 0 to 8 years is
higher in regional Victoria (2.8%) than in metropolitan Melbourne (0.9%).
Families with children in Wyndham (C).
Families with children under 15 years
and/or dependent students aged 15-24 Families with at least one child aged 0 to
years 8 years
Aboriginal Total Aboriginal Total
% Aboriginal % Aboriginal
families families families families
Wyndham (C) 193 16,959 1.1 125 9,879 1.3
Western Metropolitan Region 695 85,829 0.8 429 48,269 0.9
Victoria 7,222 623,647 1.2 4,654 336,092 1.4
Source: ABS 2006 Census of Population and Housing
• Of the 16,959 families counted in Wyndham (C) with children under 15 years and/or dependent students aged 15-24 years,
193 were Aboriginal families, representing 1.1% of all families with dependent children in Wyndham (C).
• The percentage of Aboriginal families with children under 15 and/or dependent students aged 15-24 years in Wyndham (C)
(1.1%) was greater than that in the Western Metropolitan Region (0.8%) and less than that in Victoria (1.2%).
• Of the 16,959 families counted in Wyndham (C) with children under 15 and/or dependent students, 58.3% had at least one
child aged 0 to 8 years. 1.3% of these families were Aboriginal. This was less than the proportion of Aboriginal families with at
least one child aged 0 to 8 years in Victoria (1.4%).Aboriginal Early Childhood Community Profile 5
Demographics
Families with Aboriginal children
• At the 2006 Census, there were 336,092 families with children aged 0 to 8 years old in Victoria. 4,654 were
families with Aboriginal
g children aged
g 0 to 8 years,
y , representing
p g 1.4 per
p cent of families in this category.
g y
• The percentage of families with Aboriginal children aged 0 to 8 years is higher in regional Victoria (2.8%)
than in metropolitan Melbourne (0.9%)
Map 1: All Familes with at least one Aboriginal child aged 0 to 8 years, within each LGA in Regional
Victoria as a percentage of all families with children aged 0 to 8 within each LGA.
Victoria, LGA
• In regional Victoria, the LGAs with the highest percentages of families with Aboriginal children aged 0 to 8
years, were Swan Hill (S) (8.5%), East Gippsland (S) (7.5%), Greater Shepparton (C) (6.8%) and Mildura
(RC) (6.6%).
• The lowest percentages were in the LGAs of Surf Coast (S), Macedon Ranges (S) and Moorabool (S) (all
under 1.0%).Aboriginal Early Childhood Community Profile 6
Demographics
Families with Aboriginal children
Map 2: All Familes with at least one Aboriginal child aged 0 to 8 years, within each LGA in Melbourne,
p g of all families with children aged
as a percentage g 0 to 8 y years within each LGA.
• In Wyndham (C), the percentage of families with Aboriginal children aged 0 to 8 years was 1.3%
• The highest percentages of families with Aboriginal children aged 0 to 8 years in the metropolitan area were
in the LGAs of Darebin (C) (1.9%), Frankston (C) (1.5%) and Whittlesea (C) (1.5%).
• The Inner-eastern and southern regions of Melbourne had the lowest percentages. This included the LGAs of
Bayside (C), Boroondara (C), Glen Eira (C) and Manningham (C), all with 0.2%.Aboriginal Early Childhood Community Profile 7
Demographics
Family composition
• The family composition of Aboriginal families with children aged 0 to 8 in Victoria was almost equally divided,
with 51.0% couple
p families and 49.0% one parent
p families. In comparison,
p , the majority
j y of families with children
aged 0 to 8 in Victoria were couple families (83.1%).
Figure 2: Familes with at least one child aged 0 to 8 years in Wyndham (C).
Aboriginall families
familie
Wyndham (C) 55.2% 44.8%
Victoria 51.0% 49.0%
Wyndham (C) 82.4% 17.6%
otal families
Total fam
Victoria 83 1%
83.1% 16.9%
16 9%
Couple families One parent families
Source: ABS 2006 Census of Population and Housing
• There were more Aboriginal couple families than Aboriginal one parent families with children aged 0 to 8 years
in Wyndham (C) (55.2% compared to 44.8% one parent families).
• The percentage of Aboriginal couple families with children aged 0 to 8 years in Wyndham (C) (55.2%) was
greater than the percentage of Aboriginal couple families with children in this age group in Victoria (51.0%) and
less than the percentage of all couple families with children aged 0 to 8 years in Wyndham (C) (82(82.4%).
4%)
• The percentage of Aboriginal one parent families with children aged 0 to 8 years in Wyndham (C) (44.8%) was
less than the percentage of Aboriginal one parent families with children in this age group in Victoria (49.0%)
and greater than the percentage of all one parent families with children aged 0 to 8 years in Wyndham (C)
(17.6%).Aboriginal Early Childhood Community Profile 8
Demographics
Family Income
• The median weekly family income of Aboriginal families in Victoria with at least one child aged 0 to 8 was $644. This was
almost three times lower than the median weekly income of all families in Victoria with at least one child aged 0 to 8 years
($1889 per week)
Median weekly income for families with children aged 0 to 8 years in Wyndham (C), by family type.
Aboriginal Total Population
Couple families One parent families Couple families One parent families
Median Median Median Median
No. of No. of No. of No. of
weekly weekly weekly weekly
families families families families
income income income income
Wyndham (C) 55 $1,145 56 $564 8,142 $1,316 1,737 $561
Western Metropolitan region 188 $1,233 177 $538 39,094 $1,359 9,175 $525
Victoria 2013 $1,073 2019 $510 279,376 $1,339 56,716 $551
Source: 2006 Census. Note: only those families that reported income are represented in this table.
• The median weekly family income for Aboriginal couple families in Wyndham (C) with at least one child aged 0 to 8 was
$1,145. This is less than the median weekly income of Aboriginal couple families with children aged 0 to 8 years in the
Western Metropolitan region ($1,233) and less than the median weekly income of all couple families in Wyndham (C) with
children in this age group ($1,316).
• 71 of the 79 LGAs in Victoria were ranked on the median weekly family income for Aboriginal couple familes with children aged
0 to 8 years. Ranks were not assigned to LGAs where less than five Aboriginal couple families reported a family income.
Wyndham (C) was ranked 26 on the median income for Aboriginal couple families with children aged 0 to 8 years. A rank of 1
was assigned
i d to
t the
th LGA with
ith the
th highest
hi h t median
di income.
i
• The median weekly family income for Aboriginal one parent families with at least one child aged 0 to 8 in Wyndham (C) was
$564. This was greater than the median weekly income of Aboriginal one parent families in the Western Metropolitan region
with children in this age group ($538) and greater than the median weekly income of all one parent families in Wyndham (C)
with at least one child aged 0 to 8 years ($561).
• 73 of the 79 LGAs in Victoria were ranked on the weekly family income for Aboriginal one parent familes with children aged 0
to 8. Ranks were not assigned to LGAs where less than five Aboriginal one parent families reported a family income.
Wyndham (C) was ranked 20 out of all LGAs on the median income for Aboriginal one parent families with children aged 0 to
8. A rank of 1 was assigned to the LGA with the highest median income.
Figure 3: Median weekly income of couple and one parent familes with children aged 0 to 8 years in Wyndham (C).
$1,600
Aboriginal population
$1,400
Total population
come
Median weekly income
$1,200 $1,316 $1,339
$1,000 $1,145
$1,073
$800
$600
$564 $561 $551
$400 $510
M
$200
$0
Wyndham (C) Victoria Wyndham (C) Victoria
Couple families One parent families
Source: 2006 Census. Note: only those families that reported income are represented in this table.Aboriginal Early Childhood Community Profile 9
Demographics
Family employment
Employment status of couple families with children aged 0 to 8 years in the Western Metropolitan region.
Both Parents unemployed or
Couple Families Both Parents Employed
not in the Labour Force
Number of Percentage of Percentage of Percentage of Percentage of
Number of
Aboriginal Aboriginal all couple Aboriginal all couple
Total families
families families families families families
Wyndham (C) 69 8,141 43.5 50.3 np 3.1
Western Metropolitan Region 228 39,094 37.3 49.0 11.8 5.1
Victoria 2,373 279,377 39.0 52.3 17.2 3.9
Source: 2006 Census. Note: not all families report on employment status
• Of the 69 Aboriginal couple families with children aged 0 to 8 years counted in Wyndham (C) during the 2006 Census, 43.5%
had both parents employed. This was less than the percentage of all couple families in Wyndham (C) with at least one child in
this agegroup, where 50.3% reported that both parents were employed and greater than the percentage of all Aboriginal couple
families with one child aged 0 to 8 years in Victoria (39.0%) where both parents were employed.
• 47 of the 79 LGAs in Victoria were ranked on terms of percentage of Aboriginal couple families with at least one child aged 0 to 8
and with both parents employed. Ranks were not assigned to LGAs with less than five families in this category. Wyndham (C)
was ranked 20 out of 47 LGAs. A ranking of 1 was assigned to the LGA with the highest percentage of Aboriginal couple families
with at least one child aged 0 to 8 and with both parents employed.
• The number of Aboriginal couple families with at least one child aged 0 to 8 years in Wyndham (C) who reported that both
parents were either unemployed or not in the labour force was suppressed due to small numbers. 11.8% of Aboriginal couple
families with children aged 0 to 8 years in the broader Western Metropolitan region, stated that both parents were either
unemployed or not in the labour force. This was greater than the percentage of all couple families in the Western Metropolitan
region with at least one child in this age group, where 5.1% reported that both parents were either unemployed or not in the
labour force, and less than the percentage of all Aboriginal couple families with one child aged 0 to 8 years in Victoria where
both parents were either unemployed or not in the labour force (17.2%).
Figure 4: Employment status of couple families in Wyndham (C) with at least one child aged 0 to 8 years.
Aboriginal families
Wyndham (C) 43.5% 36.2%
Victoria 39.0% 17.2% 36.5%
A
Total familiess
W dh (C)
Wyndham 50 3%
50.3% 3
3.1%
1% 37
37.4%
4%
Victoria 52.3% 3.9% 35.0%
Both parents
p employed
p y Both parents
p unemployed
p y or not in the labour force
One parent employed, one not in the labour force
Source: 2006 Census. Note: only those families that reported employment status are represented in this table.
Notes:
1. Where there are less than five families within the relevant category, data is not reported for confidentiality reasons and will not be plotted in the figure above.
2. Percentages will not sum to 100% as the other category is not represented in the figure above.Aboriginal Early Childhood Community Profile 10
Demographics
Family employment
Employment status of one parent families with children aged 0 to 8 in Wyndham (C)
Parent unemployed or not
One parent Families Parent Employed
in Labour Force
Percentage Percentage
Number of Number of Percentage Percentage
of all one of all one
Aboriginal Total of Aboriginal of Aboriginal
parent parent
families families families families
families families
Wyndham
W dh (C) 56 1
1,738
738 33
33.9
9 41
41.9
9 69
69.6
6 56
56.5
5
Western Metropolitan Region 201 9,180 29.4 35.1 64.2 62.1
Victoria 2,281 56,717 24.2 41.7 71.8 56.3
Source: 2006 Census. Note: not all families report on employment status
• In 33.9% of Aboriginal one parent families with children aged 0 to 8 in Wyndham (C), the parent was employed. This
was less than the percentage of all one parent families with children in this age group in Wyndham (C) where the
parent was employed (41.9%) and greater than the percentage of Aboriginal one parent families in Victoria with at
least one child aged 0 to 8 years and the parent employed (24.2%).
• 69.6% of Aboriginal
g one parent
p families with children aged
g 0 to 8 in Wyndham
y (C)
( ) were either unemployed
p y or not in
the labour force. This is higher than the percentage of all one parent families with at least one child aged 0 to 8 years
in Wyndham (C) where the parent was either unemployed or not in the labour force (56.5%) and lower than Aboriginal
one parent famililes in Victoria with children in this age group, where the parent was either unemployed or not in the
labour force (71.8%).
Figure 5: Employment status of one parent families in Wyndham (C) with at least one child aged 0 to 8 years.
Aboriginal families
Wyndham (C) 33.9% 69.6%
Victoria 24.2% 71.8%
Abo
Wyndham (C) 41.9% 56.5%
Total families
Victoria 41.7% 56.3%
Parent employed Parent unemployed or not in the labour force
Source: ABS 2006 Census of Population and Housing
Notes:
1. Where there are less than five families within the relevant category, data is not reported for confidentiality reasons and will not be
plotted in the figure above.
2. Percentages will not sum to 100% as the other category is not represented in the figure above.Aboriginal Early Childhood Community Profile 11
Demographics
Education level of families
Families with children aged 0 to 8 in Wyndham (C) where the highest school qualification of
the parent/parents is less than Year 12 or equivalent.
Couple families where both parents One parent families where the parent
have not completed Year 12 or its has not completed Year 12 or its
equivalent equivalent
Aboriginal Aboriginal
Total families Total families
families families
Number Percent Number Percent Number Percent Number Percent
Wyndham (C) 13 20.3 1,907 23.4 31 50.8 987 56.8
Victoria 558 23.6 59,172 21.2 1322 57.8 31,041 54.7
Source: 2006 Census. Note: not all families report education information
• The percentage of Aboriginal couple families in Wyndham (C) with children aged 0 to 8 where both parents had
not completed Year 12 or its equivalent was 20.3%. This was greater than the percentage of all couple families
with children in this age group in Wyndham (C) where both parents had completed Year 12 or its equivalent
(23.4%) and less than the percentage of Aboriginal couple families in Victoria with at least one child aged 0 to 8
years where both parents had completed Year 12 or its equivalent (23.6%).
• The highest school qualification of the parent is less than Year 12 or equivalent in 50.8% of Aboriginal one
parent families with children aged 0 to 8 in Wyndham (C). This was less than the percentage of Aboriginal one
parent families in Victoria with children in this age group (57.8%) and less than the percentage of all one parent
families in Wyndham (C) with children aged 0 to 8, where the parents highest school qualification was less than
Year 12 or its equivalent (56.8%).
Families with Children Aged 0 to 8 in Wyndham (C) where the parent/parents have a non-
school qualification
Couple families where both parents One parent families where the parent
have a non school qualification has a non school qualification
Aboriginal Total families Aboriginal Total families
Number Percent Number Percent Number Percent Number Percent
Wyndham (C) 5 7.8 1216 14.9 6 9.8 230 13.2
Victoria 132 5.6 62,362 22.3 193 8.4 10,104 17.8
Source: 2006 Census. Note: not all families report education information
The percentage of Aboriginal couple families in the Wyndham (C) with children aged 0 to 8, where both parents
had a non school qualification was 7.8%. This was less than the percentage of all couple families in Wyndham
(C) with children in this age group and where both parents had a non school qualification (14.9%) and greater
than the percentage of Aboriginal couple families in Victoria in this category (5.6%).
In 9.8% of Aboriginal one parent families with children aged 0 to 8 in Wyndham (C), the parent had completed a
non school qualification. This was less than the percentage of all one parent families in Wyndham (C) with
children aged 0 to 8 (13.2%) and greater than the percentage of Aboriginal one parent families in Victoria with
children in this age group (8.4%).Aboriginal Early Childhood Community Profile 12
Demographics
Family tenure
Figure 6: Tenure type of families with children aged 0 to 8 years in the Western Metropolitan region.
Couple families 50.0% 38.6% 3.9%
Aboriginal
families
One parent families 19.0% 44.5% 27.5%
Total families
amilies
Couple families 78.2% 7.2% 12.4%
One parent families 41.6% 28.0% 25.7%
Fully own or purchasing Renting Renting from a state housing authority
Source: ABS 2006 Census of Population and Housing
Notes:
1 Wh
1. Where ththere are less
l than
th five
fi families
f ili within
ithi the
th relevant
l t category,
t data
d t is
i nott reported
t d for
f confidentiality
fid ti lit reasons and
d will
ill nott b
be plotted
l tt d
in the figure above.
2. Percentages may not sum to 100% as the other category is not represented in the figure above.
• In Victoria, 50.1% of Aboriginal couple families with at least one child aged 0 to 8 were living in dwellings that
were either fully owned or being purchased, 31.8% were renting and 12.7% were renting from a State housing
authority.
• Based on the 2006 Census, fewer Aboriginal couple families than total couple families in the Western
Metropolitan region, with children aged 0 to 8, were living in dwellings that were either fully owned or being
purchased (50.0% compared to 78.2%).
• 3.9% of Aboriginal couple families with children aged 0 to 8 in the Western Metropolitan region were renting
their dwellings from a state housing authority. This is less than the percentage for all couple families in the
Western Metropolitan region with children in this age group (12.4%) and less than the percentage of all
Ab i i l families
Aboriginal f ili ini Victoria
Vi t i with
ith children
hild aged
d 0 to
t 8 whoh were renting
ti their
th i dwelling
d lli fromf a state
t t housing
h i
authority (12.7%).
• In Victoria, 17.0% of Aboriginal one parent families with at least one child aged 0 to 8 were living in dwellings
that were either fully owned or being purchased, 38.1% were renting and 40.1% were renting from a State
housing authority.
• Based on the 2006 Census, fewer Aboriginal one parent families than total one parent families in the Western
Metropolitan region, with children aged 0 to 8, were living in dwellings that were either fully owned or being
purchased (19.0% compared to 41.6%).
• 27.5% of Aboriginal one parent families with children aged 0 to 8 in the Western Metropolitan region were
renting their dwellings from a state housing authority. This is greater than the percentage for all one parent
families in the Western Metropolitan region with children in this age group (25.7%) and less than the
percentage of all Aboriginal families in Victoria with children aged 0 to 8 who were renting their dwelling from a
state housing authority (40
(40.1%).
1%)Aboriginal Early Childhood Community Profile 13
Demographics
Need for assistance with core activities
The 2006 Census is the first to collect data on need for assistance with core activities. The need for assistance with
core activities variable has been developed to measure the number of people with a profound or severe disability.
Please refer to 'need for assistance with core activities' in the glossary for more information.
Aboriginal persons aged 0 to 8 in the Western Metropolitan Region with a need for assistance with
core activities
Aboriginal population Total Population
Children % children Children % children
Children aged 0-8 who aged 0-8 who Children aged 0-8 who aged 0-8 who
aged
g 0-8 have need for have need for aged
g 0-8 have need for have need for
assistance assistance assistance assistance
Western Metropolitan Region 569 15 2.6 78,713 1,122 1.4
Metropolitan Victoria 3,736 88 2.4 401,524 5,383 1.3
Victoria 6,650 159 2.4 554,968 7,770 1.4
S
Source: ABS 2006 C
Census off P
Population
l ti and
d Housing
H i
• According to the 2006 Census, there were 159 Aboriginal persons aged 0 to 8 in Victoria with a need for assistance with
core activities. This represents 2.4% of all Aboriginal persons in Victoria aged 0 to 8 years.
• Due to confidentiality provisions, the percentage of children aged 0 to 8 in Wyndham (C) with a need for assistance with
core activities could not be derived. As Wyndham (C) is part of the Western Metropolitan region, comparisons can be
made using the region data. The percentage of Aboriginal children aged 0 to 8 in the Western Metropolitan Region with
a need for assistance with core activities was 22.6%.
6% This was greater than the percentage of all children aged 0 to 8 in
the Western Metropolitan Region with a need for assistance (1.4%) and less than the percentage of Aboriginal children
aged 0 to 8 in Victoria with a need for assistance (2.4%).
Figure 7: Percentage of children aged 0 to 8 with a need for assistance with core activities
Western Metropolitan 1.4%
2.6%
Southern Metropolitan 1.3%
3.9%
Northern Metropolitan 1.3%
2.7%
2 7%
Eastern Metropolitan 1.4%
2.6%
Loddon Mallee 1.4%
1.1%
Region
Hume 1.3%
1.6%
Grampians
p 1.8%
1.6%
Gippsland 1.8%
3.4%
Barwon South West 1.6%
2.2%
0.0% 0.5% 1.0% 1.5% 2.0% 2.5% 3.0% 3.5% 4.0% 4.5% 5.0%
Total population Aboriginal population
• The Southern Metropolitan region had the highest percentage of Aboriginal children aged 0 to 8 with a need for
assistance with core activities (3.9%). This was followed by Gippsland (3.4%) and Northern Metropolitan region (2.7%).
Loddon Mallee region had the lowest percentage of children aged 0 to 8 with a need for assistance with core activities
(1.1%).
• The percentage of Aboriginal children aged 0 to 8 years with a need for assistance with core activities was more than
double that of the total population in the Southern and Northern metropolitan regions and almost double that of the total
population in the Western and Eastern metropolitan regions and in the rural region of Gippsland.Aboriginal Early Childhood Community Profile 14
Victorian Child and Adolescent Outcomes Framework
Each of the indicators presented in the following pages of this community profile link to the Victorian Child
and Adolescent Outcomes Framework.
The framework represents a whole of government approach and provides a common basis for setting
objectives
bj ti and
d planning
l i for
f children,
hild young people
l and
d their
th i families
f ili ini Victoria.
Vi t i
The 35 agreed outcomes incorporate health, safety, learning, development and wellbeing from birth to 18
years and reflect an ecological model that places the child at the centre of family, community and society.
For further information on the Outcomes Framework, visit
http://www.education.vic.gov.au/about/directions/children/vcams/default.htm
Please note:
Each of the indicators presented in the following pages of this Aboriginal community profile contain
information on why the indicators have been selected and what is measured. Data sources and notes for
the indicators presented in this section can be found in Appendix B. For definitions of terms used
throughout these profiles, please refer to Appendix C.Aboriginal Early Childhood Community Profile 15
Outcome: Optimal Antenatal and Infant Development
Indicator: Low birth weight babies
What is measured?
This indicator measures the number of low birth weight babies per 1000 live births. Low birth weight is defined as weighing less
than 2500 grams1 (2.5 kilograms or 5 pounds and 8 ounces). This includes both premature and full term babies.
Note: For 65 of the 79 Local Government Areas (LGAs) in Victoria, data on the number of Aboriginal live births and of Aboriginal
low birth weight babies were suppressed due to small numbers. Data for the broader region in which that LGA is contained has
been substituted for this indicator where applicable.
Why is it important?
Low birth weight is an indicator of the general health of a newborn. Low birth weight is also a key determinant of infant survival,
health and development 1. Low birth weight babies are at greater risk of dying in the first years of life2 and also of:
- hospitalisation2
- physical and neurological complications2
- development of psychosocial problems2
Low birth weight babies (Aboriginal Early Childhood Community Profile 16
Outcome: Early identification of and attention to child health needs
Indicator: Proportion of children participating in Maternal and Child Health Services
What is measured?
This indicator measures the number of children aged 0 to 3 years and aged 3 to 6 years who have used the
Maternal and Child Health Service at least once in the financial year (also known as 'active' children).
Why is it important?
The Maternal and Child Health (MCH) Service is a universal primary care service for all Victorian families
with children from birth to school age. The service offers support, information and advice regarding parenting,
child health and development, child behaviour, maternal health and well-being, child safety, immunisation,
breastfeeding, nutrition and family planning3.
The MCH Service aims to promote a comprehensive and focused approach for the promotion, prevention,
early detection and intervention of physical, emotional or social factors affecting young children and their
families4.
All children can benefit from their family having access to helpful guidance as they grow and develop4.
Number of Aboriginal children who are active in the MCH Service in Wyndham (C).
2003-04
Aged 0 to 3 Aged 3 to 6
Active Total Active Total
% active % active
children cards children cards
Wyndham (C) 24 33 72.7 6 30 20.0
Western Metropolitan region 114 136 83.8 31 90 34.4
Victoria 1524 1998 76.3 479 1696 28.2
2004-05
Aged 0 to 3 Aged 3 to 6
Active Total Active Total
% active % active
children cards children cards
Wyndham (C) 20 28 71.4 9 42 21.4
Western Metropolitan region 125 153 81.7 35 129 27.1
Victoria 1626 2080 78.2 530 1867 28.4
2005-06
Aged 0 to 3 Aged 3 to 6
Active Total Active Total
% active % active
children cards children cards
Wyndham (C) 15 30 50.0 np 31 np
Western Metropolitan region 126 168 75.0 30 120 25.0
Victoria 1748 2239 78.1 508 1850 27.5Aboriginal Early Childhood Community Profile 17
Outcome: Early identification of and attention to child health needs
Indicator: Proportion of children participating in Maternal and Child Health Services
Number of Aboriginal children who are active in the MCH Service in Wyndham (C) .... continued
2006-07
2006 07
Aged 0 to 3 Aged 3 to 6
Active Total Active Total
% active % active
children cards children cards
Wyndham (C) 27 33 81.8 7 35 20.0
Western Metropolitan region 120 149 80.5 35 137 25.5
Victoria 1841 2351 78.3 523 2007 26.1
2007-08
Aged 0 to 3 Aged 3 to 6
Active Total Active Total
% active % active
children cards children cards
Wyndham (C) 41 53 77.4 np 34 np
Western Metropolitan region 135 180 75.0 38 147 25.9
Victoria 1903 2464 77.2 480 2013 23.8
• In
I 2007-08,
2007 08 the
h percentage off MCH active
i Aboriginal
Ab i i l children
hild agedd 0 to 3 years in
i Wyndham
W dh (C) was 77.4%.
77 4%
This was greater than the percentage of MCH active Aboriginal children in this age group in the Western
Metropolitan Region (75.0%) and greater than the percentage of MCH active Aboriginal children aged 0 to 3
years in Victoria (77.2%).
• The percentage of Aboriginal children aged 3 to 6 years who were active in MCH services during 2007-08 in
Wyndham (C) was suppressed due to small numbers. In the broader Western Metropolitan region, 25.9% of
children aged
g 3 to 6 years
y were active in MCH services duringg this period.
Figure 9: The percentage of MCH active Aboriginal children aged 0 to 6 years in Wyndham (C), 2003-04
to 2007-08.
100
90
80
70
age
Percentage
60
50
40
30
20
10
0
2003-04 2004-05 2005-06 2006-07 2007-08
0 to 3 years Aboriginal 0 to 3 years Total 3 to 6 years Aboriginal 3 to 6 years Total
• The above figure shows the percentage of MCH active Aboriginal children in Wyndham (C) is higher in children
aged 0 to 3 years than for children aged 3 to 6 years. This trend is consistant to that observed in the total
population.Aboriginal Early Childhood Community Profile 18
Outcome: Early Identification of and attention to child health needs
Indicator: Proportion of children receiving a Maternal and Child Health Service home consultation
What is measured?
This indicator measures participation in the Maternal and Child Health home consultation.
Participation in key ages and stages visits in the Maternal and Child Health (MCH) services for Aboriginal children are not
fullyy represented
p in the figures
g below. This is because manyy Aboriginal
g children attend the Victorian Aboriginal
g Health
Service (VAHS) rather than their local MCH service.
Participation rates for Aborginal children at the LGA level is subject to volatility due to small numbers and cannot be
accurately represented at an LGA level. This indicator presents the number and proportion of Aboriginal children receiving a
home consultation within the broader DEECD region which contains the LGA.
Why is it important?
The Maternal and Child Health (MCH) Service is a universal service for all Victorian families with children from birth to
school age. The service offers support, information and advice regarding parenting, child health and development, child
behaviour, maternal health and well-being, child safety, immunisation, breastfeeding, nutrition and family planning 3.
The MCH Service aims to promote a comprehensive and focused approach for the promotion, prevention, early detection
and intervention of physical, emotional or social factors affecting young children and their families 4. All children can benefit
from their family having access to helpful guidance as they grow and develop 4.
Aboriginal
g children receiving
g a Maternal and Child Health Service home consulation in the Western Metropolitan
p
region, 2006-07 and 2007-08.
2006-07 2007-08
Percentage Percentage of
Infant record of children Infant record children
Home cards receiving a Home cards receiving a
consultations - children home consultations - children home
aged 0 to 1 consultation aged 0 to 1 consultation
Western Metropolitan region 38 43 88.4 54 71 76.1
Metropolitan Victoria 286 301 95.0 377 373 101.1
Victoria 685 777 88.2 801 877 91.3
• In 2007-08, the percentage of Aboriginal children seen at the home consultation visit in the Western Metropolitan region
was 76.1%. This has decreased since 2006-07, where 88.4% of Aboriginal children were seen at the home consulation
visit.
Figure 10: Percentage of children seen at the MCH home consultation visit in the Western Metropolitan region and
Victoria, 2007-08.
110
100
ercentage
98.4% 98.9%
90
Percenta
91.3%
80
70 76.1%
60
50
Western Metropolitan region Victoria
Aboriginal population Total population
Note: Percentage of children receiving a key ages and stages visit may exceed 100% in some areas. See 'key ages and stages visit' in glossary for more
information.
• In 2007-08, the percentage of Aboriginal children seen at the home consultation visit in the Western Metropolitan region
was less than the percentage of the total population in the Western Metropolitan region seen at home consultation visit
(98.4%) and lower than the percentage of Aboriginal children seen at the home consultation visit in Victoria (91.3%).Aboriginal Early Childhood Community Profile 19
Outcome: Early Identification of and attention to child health needs
Indicator: Proportion of children attending the Maternal and Child Health Service 3.5 year ages and stages visit
What is measured?
This indicator measures the number of children attending the Maternal and Child Health (MCH) 3.5 year ages and stages visit.
Participation in key ages and stages visits in the Maternal and Child Health (MCH) services for Aboriginal children are not fully
represented in the figures below. This is because some Aboriginal children attend the Victorian Aboriginal Health Service (VAHS)
rather than their local MCH service
service.
Participation rates for Aborginal children at the LGA level is subject to volatility due to small numbers and cannot be accurately
represented at an LGA level. This indicator presents the number and proportion of Aboriginal children receiving a 3.5 year ages and
stages visit within the broader DEECD region which contains the LGA.
Why is it important?
The Maternal and Child Health (MCH) Service is a universal service for all Victorian families with children from birth to school age. The
service offers support, information and advice regarding parenting, child health and development, child behaviour, maternal health and
well-being, child safety, immunisation, breastfeeding, nutrition and family planning 3.
The MCH Service aims to promote a comprehensive and focused approach for the promotion, prevention, early detection and
intervention of physical, emotional or social factors affecting young children and their families 4. All children can benefit from their family
having access to helpful guidance as they grow and develop 4.
Aboriginal children seen at Maternal and Child Health Service 3.5 year ages and stages visit in the Western Metropolitan
region, 2006-07 and 2007-08.
2006-07 2007-08
Mean infant Percentage of Mean infant Percentage of
3.5 Ages record cards children 3.5 Ages record cards children
and Stages - children aged attending 3.5 and Stages - children aged attending 3.5
visit 3 to 4 and year ages and visit 3 to 4 and year ages and
aged 4 to 5 stages visit aged 4 to 5 stages visit
Western Metropolitan Region 22 50.5 43.6 22 49.0 44.9
Metropolitan
e opo a Victoria
co a 115
5 303.0
303 0 38.0
38 0 126
6 289.0
89 0 43.6
36
Victoria 255 681.0 37.4 281 696.5 40.3
• In 2007-08, the percentage of Aboriginal children seen at the 3.5 year key ages and stages visit in the Western Metropolitan region was
44.9%. This has increased since 2006-07, where 43.6% of Aboriginal children were seen at the 3.5 year ages and stages visit.
• In
I 2007-08, the percentage
2007 08 th t off Aboriginal
Ab i i l children
hild seen att the
th 3.5
3 5 year ages and
d stages
t visit
i it in
i the
th Western
W t Metropolitan
M t lit region
i was
higher than the percentage seen at the 3.5 year ages and stages visit in Metropolitan Victoria (43.6%) and higher than the percentage
seen in Victoria (40.3%).
Figure 11: Percentage of children seen at the 3.5 year ages and stages visit in the Western Metropolitan region and Victoria,
2007-08.
100
80
tage
Percentage
60
60.1%
40 51.3%
44.9%
40.3%
20
0
Western Metropolitan region Victoria
Aboriginal population Total population
Note: Percentage of children receiving a key ages and stages visit may exceed 100% in some areas. See 'key ages and stages visit' in glossary for more information.
• The percentage of Aboriginal children seen at the 3.5 year ages and stages visit in the Western Metropolitan region in 2007-08 was
less than the percentage of the total population seen at the 3.5 year ages and stages visit (51.3%) and greater than the percentage of
Aboriginal children in Victoria seen at the 3.5 year ages and stages visit (40.3%).Aboriginal Early Childhood Community Profile 20
Outcome: Early Identification of and attention to child health needs
Indicator: Proportion of children who are the subject of a child abuse notification within 12 months of a notification
What is measured?
This indicator measures the rate of child protection renotifications for children aged 0 to 8 years. A child is "renotified" if they
are notified to Child Protection more than once in a 12 month period.
Why is it important?
Childhood trauma, abuse and neglect is one of the most significant factors impacting on child health, wellbeing and
development5. Abuse in childhood can result in a wide range of long and short term consequences. In addition to physical
harm, abused children can develop ongoing mental health and behavioural issues2.
Number and rate of child protection notifications, renotifications and re-reports within a year, for children aged 0 to 8
years in Wyndham (C), 2001-02 to 2007-08.
Ab i i l child
Aboriginal hild protection
t ti tifi ti
notifications Total child protection notifications
Number of Number of Re-reports within Number of Number of Re-reports within
notifications Renotifications a year (%) notifications Renotifications a year (%)
2001-02 12 5 41.7 02 310 90 29.0
2002-03 14 np np 03 389 95 24.4
2003-04 9 np np 04 356 115 32.3
2004-05 15 6 40 0
40.0 05 351 128 36 5
36.5
2005-06 28 12 42.9 06 405 97 24.0
2006-07 * 27 11 40.7 07 392 121 30.9
2007-08 * 28 14 50.0 08 474 144 30.4
* From 23 April 2007 the child protection reporting system changed resulting in notifications being replaced by child protection reports.
• In 2007-08, 40.9% of Aboriginal children aged 0 to 8 years in Victoria were re-reported to child protection services within 12
th off a notification.
months tifi ti Thi rate
This t has
h decreased
d d from
f 43 8% in
43.8% i 2001-02.
2001 02 Over
O th 7 year period
the i d between
b t 2000 01 to
2000-01 t 2007-08,
2007 08
the percentage of re-reports within 12 months of a notification in Aboriginal children aged 0 to 8 years in Victoria has been
decreasing at an average rate of 1.0% per year.
• In 2007-08, the proportion of Aboriginal children aged 0 to 8 years in Wyndham (C) who were re-reported to child protection
services within 12 months of a notification was 50.0%. This rate has increased from 40.7% in 2006-07 and increased from
41.7% in 2001-02.
Figure 12: The rate of children aged 0 to 8 years in Wyndham (C) re-reported to child protection within 12 months of a
notification, 2001-02 to 2007-08.
60.0
50.0
ification rate
40.0
Renotificatio
30.0
20.0
10.0
0.0
2001-02 2002-03 2003-04 2004-05 2005-06 2006-07 2007-08
Aboriginal All children
Note: Due to new service and data reporting arrangements introduced in 2006
2006-07,
07 child protection data from 2006
2006-07
07 onwards may not be fully comparable
with data from previous years. From 23 April 2007 the child protection reporting system changed resulting in notifications being replaced by child protection
reports.
• In 2007-08, the rate of Aboriginal children aged 0 to 8 years re-reported to child protection services within 12 months of a
notification in Wyndham (C) (50.0%) was greater than the percentage of re-reports of all children aged 0 to 8 years in Wyndham
(C) (30.4%) and greater than the percentage of re-reports of all Aboriginal children aged 0 to 8 years in Victoria (40.9%).Aboriginal Early Childhood Community Profile 21
Outcome: Early Identification of and attention to child health needs
Indicator: Number of children who are the subject of a child abuse substantiation
What is measured?
This indicator measures the rate of child protection substantiations for children aged 0 to 8 years. The rate of
substantiations is the number of substantiations per 1000 of the estimated population in the age-group.
Substantiations are those finalised investigations of child maltreatment that result in a conclusion that a child has
been or is likely to be abused, neglected or otherwise suffer harm6.
The rate of child protection substantiations for children aged 0 to 8 years is usually derived using the Estimated
Resident Population (ERP) of all children aged 0-8 during the reference period. As Aboriginal population estimates
are not produced annually at the local government area level by single year of age, a methodology was introduced
by Statewide Outcomes to combine Aboriginal census counts with the Experimental Estimates of the Aboriginal
population produced by the ABS. See Appendix A for more information on this methodology. This information
should be used as a guide to depict trends over time and highlight any areas of concern.
Why is it important?
Childhood trauma, abuse and neglect is one of the most significant factors impacting on child health, wellbeing and
development5.
Abuse in childhood can result in a wide range of long and short term consequences. In addition to physical harm,
abused children can develop ongoing mental health and behavioural issues2.
Number and rate of child protection substantiations for Aboriginal children aged 0 to 8 years in Wyndham
(C), 2003-04 to 2007-08.
Aboriginal children All children
Estimated Estimated
Rate per 1000 Rate per 1000
Number of population Number of Resident
children aged children aged
substantiations aged 0 to 8 substantiations Population aged
0 to 8 years 0 to 8 years
years (a) 0 to 8 years
2003-04 np 167 np 2003 85 14,380 5.9
2004-05 np 177 np 2004 72 15,300 4.7
2005-06 8 187 42.8 2005 84 16,199 5.2
2006-07 9 197 45.7 2006 106 17,228 6.2
2007-08 10 207 48.3 2007 104 17,826 5.8
(a) Statewide Outcomes methodology (see Appendix A)
• In 2007-08, the rate of child protection substantiations in Victoria was 68.2 per 1000 Aboriginal children aged 0 to 8
years. This rate has increased from 66.9 per 1000 children aged 0 to 8 years in 2006-07 and decreased from 74.5
per 1000 children aged 0 to 8 years in 2003-04. Over the 5 year period between 2003-04 to 2007-08, the rate of
child protection substantiations in Aboriginal children aged 0 to 8 years in Victoria has been decreasing at an
average rate of 1.8 per year.
• In 2007-08, the rate of child protection substantiations in Wyndham (C) was 48.3 per 1000 Aboriginal children aged
0 to 8 years. This rate has increased from 45.7 per 1000 Aboriginal children aged 0 to 8 years in 2006-07 and
increased from 42.8 per 1000 children aged 0 to 8 years in 2005-06.
• In 2007-08, the rate of child protection substantiations per 1000 Aboriginal children aged 0 to 8 years in Wyndham
(C) was greater than the total rate of child protection substantiations for all children aged 0 to 8 years in Wyndham
(C) (5.8 per 1000 children aged 0 to 8 years) and less than the rate of child protection substantiations for all
Aboriginal children aged 0 to 8 years in Victoria (68.2 per 1000 children aged 0 to 8 years).Aboriginal Early Childhood Community Profile 22
Outcome: Free from preventable disease
Indicator: Proportion of children who are fully immunised
What is measured?
This indicator measures children fully immunised at age group 1 (12-Aboriginal Early Childhood Community Profile 23
Outcome: Free from preventable disease
Indicator: Proportion of children who are fully immunised
Aboriginal children fully immunised at the 24 -< 27 month age cohort in Wyndham (C), 2005-06 to 2007-08.
2005-06 2006-07 2007-08
No. of Fully Immunised No. of Fully Immunised No. of Fully Immunised
children Number % children Number % children Number %
Wyndham (C) 9 9 100.0 13 13 100.0 12 11 91.7
Western Metropolitan region 64 58 90.6 62 57 91.9 68 61 89.7
Victoria 748 699 93.4 713 656 92.0 676 619 91.6
• In 2007-08, 619 Aboriginal children aged 24 to 27 months in Victoria were fully immunised, representing 91.6% of all
Aboriginal children aged 24 to 27 months in Victoria. The percentage of Aboriginal children in Victoria fully immunised
at 24 to 27 months has decreased from 93.4% in 2005-06 to 91.6% in 2007-08.
• The percentage of children fully immunised at the 24-Aboriginal Early Childhood Community Profile 24
Outcome: Free from preventable disease
Indicator: Proportion of children who are fully immunised
Aboriginal children fully immunised at the 72-Aboriginal Early Childhood Community Profile 25
Outcome: High quality early education and care experiences available
Indicator: Kindergarten participation rate
What is measured?
This indicator measures the number of Aboriginal children who were enrolled in a funded kindergarten the year before they
start school. Enrolments include first year and second year enrolments in a funded kindergarten.
The kindergarten participation rate for Aboriginal children is measured as the number of enrolled children identified as being
Aboriginal as a percentage of the subsequent year's grade prep enrolment who are identified as being Aboriginal. Aboriginal
Prep enrolments may include students enrolled in their second year of Prep. Differences in calculation methods in
kindergarten participation rates in the Aboriginal population mean that the Aboriginal kindergarten participation rate cannot be
validly compared with general participation rates.
The participation rate for Aboriginal children is not currently measured at an LGA level. This indicator presents the number of
Aboriginal children enrolled in a funded four year old kindergarten within the LGA, and the Statewide kindergarten participation
rates.
See Appendix C for more information on kindergarten and kindergarten participation rates.
Why is it important?
Kindergarten is a Victorian State Government funded program for all children in the year before entering primary school.
Attendance at a quality preschool program is considered to have a number of benefits, including better intellectual
development and independence, sociability and concentration, cognitive development in the short-term and preparation for
success in school9.
The Best Start Indicators Project recognises that early childhood education is important in preparing children for school and
introducing them to organised learning5. International evidence suggests that participation in early childhood education and
organised learning can produce a range of short-term and long-term benefits, including improved literacy and numeracy,
improved self-esteem, positive social, emotional and linguistic effects, better employment prospects and improved health
outcomes5.
u be of
Number o Aboriginal
bo g a children
c de eenrolled
o ed in four
ou year
yea old
o d kindergarten
de ga te in Wyndham
y d a (C), 2004
00 to 2008.
008
2004 2005 2006 2007 2008
Wyndham (C) 10 8 np 7 5
Western Metropolitan region 30 27 25 25 36
Victoria 534 465 529 504 525
• In 2008, there were 5 Aboriginal children enrolled in four year old kindergarten in Wyndham (C).
Figure 16: Kindergarten participation rate for Aboriginal children in Victoria, 2004 to 2007.
100
80
78.5%
60
67.4% 66.0%
59.1%
40
20
0
2004 2005 2006 2007
• In 2007, the kindergarten participation rate for Aboriginal children in Victoria was 59.1%, decreasing from 66.0% in the
previous year and from 78.5% in 2004.You can also read