Data sources for the timely monitoring of the social situation in EU Member States - Working Paper 2/2013 Paul Minty & Isabelle Maquet-Engsted
←
→
Page content transcription
If your browser does not render page correctly, please read the page content below

Data sources for the timely
       monitoring of the social
situation in EU Member States
                    Working Paper 2/2013
                              Paul Minty &
                  Isabelle Maquet-Engsted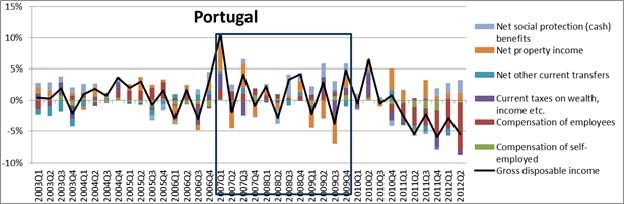
Social Europe
Data sources for the timely monitoring of the social situation in EU
                                                    Member States

This paper reviews the current problems in obtaining timely information on social developments within
EU Member States, and reports on a stocktaking exercise of existing national approaches to providing
timely social data, as well as the possibilities that are being explored within the framework of the
European Statistical System (ESS) to improve the situation.
Making use of sources of information going beyond the more traditional indicators available to monitor
poverty and inequalities, the paper also presents some illustrative, concise overviews which have been
developed to produce a consistent and more timely picture of recent social developments in eight
Member States, among those that have been most affected by the crisis. This shows that in the
countries reviewed the working age population has been the most affected by the impact of the
economic downturn and subsequent fiscal consolidation measures. The most recent data also points to a
severe deterioration of social trends in a few countries, including the weakening of safety nets.

Employment and social analysis portal: http://ec.europa.eu/social/main.jsp?catId=113&langId=en

Contact: empl-analysis@ec.europa.eu

Neither the European Commission nor any person acting on behalf of the Commission may be held
responsible for the use that may be made of the information contained in this publication.

                 Europe Direct is a service to help you find answers
                    to your questions about the European Union

                                    Freephone number (*):
                                     00 800 6 7 8 9 10 11

          (*)    Certain mobile telephone operators do not allow access to 00 800 numbers
             or these calls may be billed.

More information on the European Union is available on the Internet (http://europa.eu).

Cataloguing data as well as an abstract can be found at the end of this publication.

Luxembourg: Publications Office of the European Union, 2013

ISBN 978-92-79-30539-9
ISSN 1977-4125
doi: 10.2767/52293

© European Union, 2013
Reproduction is authorised provided the source is acknowledged.

                                                                                          July 2013 I   2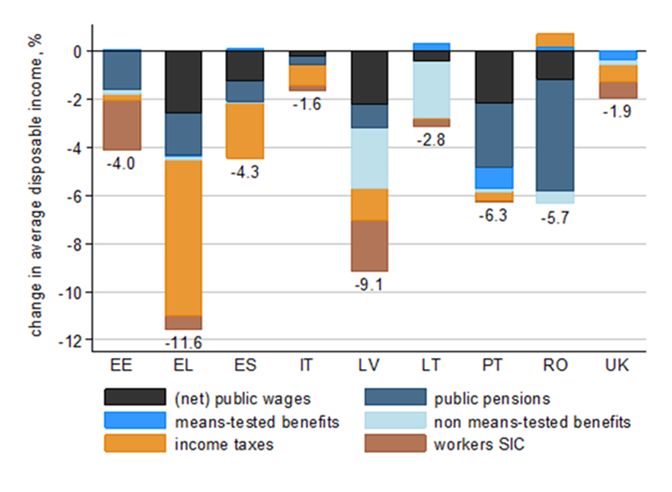
Social Europe
Data sources for the timely monitoring of the social situation in EU
                                                    Member States

                                          Table of Contents

Summary ................................................................................................... 4
Introduction ............................................................................................... 5
Problems in the timeliness of data on social trends and how to improve it............ 5
  Why is it time consuming to measure poverty accurately? .............................. 6
Stocktaking of existing national approaches to providing timely social data.........10
Review of social developments in countries hardest hit by the crisis ...................11
Conclusion.................................................................................................11
Annex.......................................................................................................12
Social developments country report: Greece...................................................13
Social developments country report: Ireland ..................................................21
Social developments country report: Italy ......................................................28
Social developments country report: Portugal.................................................35
Social developments country report: Spain ....................................................42
Social developments country report: Estonia ..................................................50
Social developments country report: Latvia ....................................................56
Social developments country report: Lithuania................................................63
Appendix to Annex .....................................................................................70
  Indicator definitions and sources of data used..............................................70
    Key social Indicators .............................................................................70
    Additional, more timely social Indicators ..................................................72
    Macro-economic indicators and forecasts..................................................73
    Other data sources................................................................................73

                                                                                               July 2013 I   3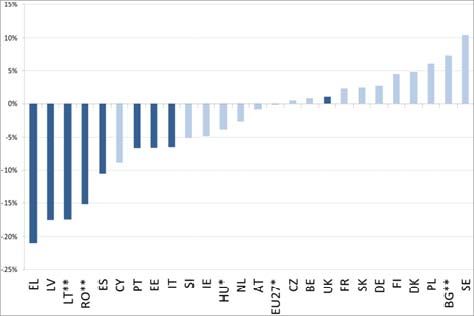
Social Europe
Data sources for the timely monitoring of the social situation in EU
                                                    Member States

Summary
Fresh data on the social situation of households is essential for policy formulation
and monitoring, in particular in times of crisis. Currently, at EU and Member State
level, the lack of fresh data on the social situation of households hampers the
monitoring of poverty and inequalities as well as the assessment of the impact of
the crisis and policy responses on households.
This paper reviews the current problems in obtaining timely information on social
developments within EU Member States, and reports on a stocktaking exercise of
existing national approaches to providing timely social data, as well as the
possibilities that are being explored within the framework of the European
Statistical System (ESS) to improve the situation.
Making use of sources of information going beyond the more traditional indicators
available to monitor poverty and inequalities, the paper presents some illustrative,
concise overviews which have been developed to produce a consistent and more
timely picture of recent social developments in eight Member States, among those
that have been most affected by the crisis. This shows that in the countries
reviewed the working age population has been the most affected by the impact of
the economic downturn and subsequent fiscal consolidation measures. The most
recent data also points to a severe deterioration of social trends in a few countries,
including the weakening of safety nets.

                                                                          July 2013 I   4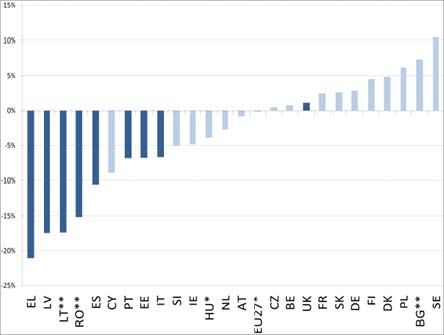
Social Europe
Data sources for the timely monitoring of the social situation in EU
                                                    Member States

Introduction
Fresh data on the social situation of households is essential for policy formulation
and monitoring, in particular in times of crisis. Currently, at EU and Member State
level, the lack of fresh data on the social situation of households hampers the
monitoring of poverty and inequalities as well as the assessment of the impact of
the crisis and policy responses on households.
With the adoption of the Europe 2020 strategy, the European Union has placed the
fight against poverty and social exclusion high on the political agenda. The
reshaping of policy objectives through the Europe 2020 strategy brought to the
fore the weaknesses of the traditional core statistics and indicators available to
monitor poverty and inequalities, notably the lack of timely data on income and
living conditions.
The social consequences of the economic and financial crisis have made the lack of
timely data on the extent of poverty and social exclusion an even more burning
issue — not least in the countries where the crisis has hit hardest. In the
conclusions of the December 2010 EPSCO1 ministers of social affairs recognise the
importance of this issue and 'invite the Commission to support, in collaboration
with the Member States, the timely availability of valid indicators to monitor the
social dimension of the Europe 2020 Strategy'. The Social Investment Package"
adopted in February 20132 takes stock of the progress made so far and identifies a
number of ways to further improve the timeliness of social data, notably through
the European Statistical System.
This paper reviews the current problems in obtaining timely information on social
developments within EU Member States, and reports on a stocktaking exercise of
existing national approaches to providing timely social data, as well as the
possibilities that are being explored, together with Eurostat, within the framework
of the European Statistical System (ESS) to improve the situation.
In the meantime, an investigation has been carried out to explore the use of
alternative sources of information which could be used to build a more timely
overall picture of social developments at Member State level, mainly focused on
income related impacts and going beyond the use of the more traditional indicators
in this area. In this context, illustrative overviews have been developed, making
use of these more timely data sources, to get a picture of recent social
developments in eight Member States, generally some of the countries hit hardest
in the crisis: Greece, Ireland, Italy, Portugal, Spain, and the three Baltic States
(Estonia, Latvia and Lithuania). These overviews are provided in the annex to the
present document.

Problems in the timeliness of data on social trends
and how to improve it
The lack of timely information on social developments, and on poverty in
particular, is the main data gap hampering evidence-based policy-making. Since
the crisis, it has become clear that policy-makers at EU and national level do not
have the necessary tools to monitor the short-term social impact of economic
shocks, or the effectiveness of policy responses. However, it is essential to capture
changes in social conditions at an early stage, and to identify those who are worst
affected by the crisis, as well as those who benefit most from a policy change.

1
   Council Conclusions on 'The social dimension in the context of an integrated Europe 2020 strategy' 3053rd
Employment, Social Policy, Health and Consumer Affairs Council Meeting 6 December 2010:
http://www.consilium.europa.eu/uedocs/cms_data/docs/pressdata/en/lsa/118244.pdf
2
  http://ec.europa.eu/social/main.jsp?catId=1044&langId=en
                                                                                             July 2013 I   5
Social Europe
Data sources for the timely monitoring of the social situation in EU
Member States
Why is it time consuming to measure poverty accurately?
At EU level, the Council Decision establishing the third anti-poverty programme
defined the poor as "persons, families or groups of persons whose resources
(material, cultural and social) are so limited as to exclude them from the minimum
acceptable way of life of the Member State in which they live". This definition
emphasizes the lack of command over resources that can hamper full participation
in society. The main EU agreed indicators of poverty are based on current income.
It captures the flow of (mostly monetary) resources that are available to a
household, and thereby is generally considered as a good proxy of the
sustainability of access to resources by the household. If the flow is insufficient
and/or interrupted, this can be interpreted as a sign of vulnerability, and people
living on a low income (below a set threshold) are considered at-risk-of-poverty3.
A number of issues linked to the collection of information on income lead to
significant delays in data availability of up to two years. To determine whether an
individual is at-risk-of poverty (based on disposable income) one needs rather
detailed information:
• on all sources of income, some of which have an irregular pattern (self-
employment income, taxes, etc.), or are received only once a year
(benefits, capital income). The data needs to cover a full twelve months
period; this is why the data usually refers to the calendar year before the
survey. This adds a delay (at the end of 2012 we will have 2010 income
data)
• on the distribution of income: this requires a big enough sample and rather
heavy treatment of the data.
• in addition, some countries use registers instead of surveys, which can add
to the delay if the administrative timing is late.
Box 1: Alternative measures of poverty and their impact on timeliness
There are several possible ways to capture the phenomenon of poverty, based on
different measures such as current income, consumption, wealth, or ability to
afford essential goods. All of these variables are, to various extents, difficult and
costly to collect; and most require household surveys, unless they can be obtained
from administrative registers (e.g. main components of income, or wealth).
In addition to the main indicator of poverty based on current income, another EU
agreed indicator is based on material deprivation, which refers to the lack of
ability to afford a number of essential goods or services. It focuses on the
situations of those with a low level of welfare (it is not appropriate to measure
overall inequalities in society). With regards to timeliness the advantage of
material deprivation is that it refers to the current situation of households, and is
less heavy to collect, but it cannot be collected through registers.
Consumption (mainly used in the developing countries) is collected through
surveys. It refers to the current situation of household, but doesn't take account of
the capacity of households to save or to run into debt, and could therefore
misrepresent the actual level of "command of resources" of households.
Subjective poverty, which is based on a self-assessment of the financial situation
of households, is easier and quicker to collect, but its relation to objective
3
However, it doesn't easily take account of the availability of other resources, such as non-monetary goods (e.g. in-
kind benefits, own-produced goods, imputed rent, etc.), or assets. Efforts are made to complement measures based
on current income with estimates of the non-monetary goods.
July 2013 I 6Social Europe
Data sources for the timely monitoring of the social situation in EU
Member States
measures of income or consumption tends to vary over time and place. It cannot
be used to obtain sound information on the distribution of resources, but it can be
much timelier and provide an indication of the deterioration/improvement of the
financial situation of households.
Efforts are being made by the European Statistical System to shorten these delays
while maintaining good data quality. In addition, the Commission is currently
exploring different ways to speed up the monitoring of social trends at EU level,
including through the use of alternative sources of information beyond those from
which the more traditional indicators of the social situation are derived (mainly EU-
SILC). More timely indicators of poverty could notably be based on some of the
alternative variables described in box 1. A number of options have been identified,
for some the feasibility of which will be assessed by the European Statistical
System during 2013:
1. Early estimates of material deprivation (and possibly subjective poverty,
monthly income) based on faster treatment of EU-SILC data. Material
deprivation measures are already more timely than income-based data, as
they refer to the survey year rather than to the ‘income year’ (generally the
year prior to the survey). In addition, they could be treated faster and
published earlier. Analysis also shows that the ‘economic strain’ dimension of
material deprivation is quite responsive to the effects of economic shocks4.
This property could be reinforced by developing questions on a household’s
current situation. In addition, a few countries5 have published early estimates
of the poverty rate based on faster treatment of survey data about one year
after the end of the income year.
2. Alternative indicators, some already existing, can be used to provide early
warning of a deterioration in the situation of households:
- A financial distress indicator6 derived from harmonised EU consumer
surveys, which are conducted on a monthly basis (see box 2 for further
details). This is well suited to signal significant changes in the financial
situation of households, by broadly defined income groups (income
quartiles). This indicator is very timely (available with only a few months
delay) and is currently published by DG EMPL in the European Employment
and Social Quarterly Review7.
- Changes in gross household disposable income (GHDI) derived from
national accounts data. This provides an indication of general material well-
being and the adequacy of labour market income in sustaining domestic
demand, but also reflects the effectiveness of replacement income schemes
(unemployment benefits) in offsetting market income declines (wages).
Detailed quarterly data on GHDI and its components exist for around half of
the EU Member States.
- In future it may be possible to collect monthly current income through a
high frequency survey and also use this as an indicator per se, providing
timely information on trends in incomes and their distribution for broad age
groups. For example, if collected through the Labour Force Survey, the
4
For instance, items such as ‘ability to face unexpected expenses’ or ‘ability to afford a week of holidays away from
home’ have been responsive to the crisis while the main indicator was still stable
5
A few countries have produced or are planning to produce early estimates (ES, CZ, PT, RO, AT, LV, NL, and SK).
6
The combined population shares reporting they are either having to draw on savings or are running into debt.
7
The reports are available on the following site: http://ec.europa.eu/social/main.jsp?catId=113&langId=en
July 2013 I 7Social Europe
Data sources for the timely monitoring of the social situation in EU
Member States
indicator would be available with a delay of three to six months. The
feasibility of this is to be assessed by Eurostat together with national
statistical offices during 2013.
3. Nowcasts of the poverty rate and related measures based on micro-simulation
(taking into account policy and economic/labour market changes as far as
possible). Nowcasts are estimates that are similar to economic forecasts, and
would be available in year N for income year N (see box 3 on nowcasting with
the Euromod tool). The Commission is also testing the possibility of using the
monthly current income survey (or possibly the financial distress indicator
derived from EU harmonised consumer surveys) to predict trends in poverty.
The gain in timeliness would depend on the frequency of the survey used to
collect such auxiliary variables.
4. Another type of information that is important to policy-makers concerns the
behavioural response of households in reaction to an income shock8 (due to
unemployment, reduced working hours, etc.), and the transmission channels
through which household welfare is affected — labour markets, access to
credit, government services9. This is especially useful in a downturn, and
possibilities to obtain such "coping mechanism" data are being explored.
5. Trends in the disbursement of social benefits, drawn from administrative
sources, typically available on a monthly or quarterly basis, can provide timely
information on increased pressure on safety nets. However, such measures are
not comparable across countries and there may be major breaks in series
when policies or administrative rules change. The Social Protection Committee
(SPC) is currently monitoring the number of social benefit recipients/new
registrations for selected social benefits.
Information on trends in the number of clients of social services (publicly
provided, or through NGOs) - emergency services, shelters, soup kitchens, etc.
- could also be collected more systematically and provide useful insight into
pressure on social services. Currently, such information is only available on an
ad hoc basis through service providers.
Among the possible developments suggested above, some are well advanced
(financial distress indicator, SPC data collection, etc.); others are being
investigated and would require further investment. An important element will be
how to use and present these indicators for a coherent overall picture, including
the role of each and the way in which they will relate to current measures of
poverty and social exclusion.
Box 2: The financial distress indicator
The Commission collects monthly information on consumer sentiment in the
context of the programme of joint harmonised EU business and consumer surveys.
These very timely surveys include a question on household financial situations,
which has been used to derive a ‘financial distress’ indicator. The indicator focuses
on households declaring that they had ‘to draw on their savings or go into debt in
8
Such a module has been run as a stand-alone survey or as a module in existing surveys (LFS, LITS) in a few EU and
neighbouring countries (Bulgaria, Romania, Latvia, Croatia, Serbia) at the request of the World Bank.
9
Examples of variables that can be envisaged include: the share of people having to reduce their expenses (by type of
expenses — food, healthcare education, housing, etc.); the share of people having to draw on their savings or go into
debt; the share of people who increase their working hours because their partner has lost their job; the share of
people experiencing difficulties in accessing essential services (healthcare, education, housing, banking, etc.).
July 2013 I 8Social Europe
Data sources for the timely monitoring of the social situation in EU
Member States
order to meet current expenditure’. Breakdowns are provided by household income
quartile. These ‘financial distress’ data can provide a timely indication of trends in
the share of the population whose households are facing financial difficulties, and
how households in the different income quartiles have been affected by the crisis.
The indicator shows that people with lower to middle income have seen their
financial situation deteriorating faster than the rest of the population. In some
countries, the gap is increasing very rapidly.
Furthermore, it can be used to some extent as an advanced indicator of some
more established ‘hard’ indicators of trends in the social situation in several
Member States, although the actual hard indicators it can predict depend on the
particular Member State in question and there is no indicator/set common to all
countries. The financial distress series may also help to signal when rather
dramatic changes have occurred, i.e. when there are really noticeable
developments in the underlying hard social indicators. Its use as a key variable in a
model combined with a set of other potentially relevant variables could be explored
once long enough time series of key social indicators would become available.
Box 3: Nowcasting with Euromod
Nowcasts are similar to economic forecasts, and aim to provide estimates of the
evolution of the income distribution, and key income poverty indicators up to year
N for income year N. The method uses the micro-simulation model Euromod to
adjust market incomes with what is known about their development (wages,
prices, etc.) and simulate the effects of the current design of the tax-benefit
system in year N (level of benefit, duration, conditionality, etc.). Further data
adjustments are made to account for labour market developments between the
latest year for which data is available and year N (e.g. the increase in
unemployment). The method doesn’t take account of demographic and other
compositional changes. However, it makes it possible to predict the potential
change in the risk of poverty and other variables (including the poverty threshold)
for the total population and specific sub-groups. It can also illustrate the
contribution of different factors to the change, e.g. worsening labour market
conditions or changes in the tax-benefit system.
The example below presents results for 8 countries among those that have been
most affected by the crisis. They point to a significant decrease of median income
in Greece, and to strong increases in inequality and poverty. In Latvia and
Lithuania, the increase in the risk of poverty among children and the elderly would
also reflect measures taken to freeze/reduce some benefits (such as child benefits
and minimum pensions) in these countries.
July 2013 I 9Social Europe
Data sources for the timely monitoring of the social situation in EU
Member States
Example of nowcasting the development of income distribution up to 2012 on the basis of
SILC 2008 data (2007 incomes) - Change since income year of latest SILC statistics
Source: Eurostat working paper: "Using Euromod to "nowcast" poverty risk in the European Union (J. Navicke, O.
Rastrigina and H. Sutherland.
http://epp.eurostat.ec.europa.eu/cache/ITY_OFFPUB/KS-RA-13-010/EN/KS-RA-13-010-EN.PDF
Stocktaking of existing national approaches to
providing timely social data
It is also important to identify what use can be made of potential higher-frequency
data on the basis of national experiences and empirical analysis. Member States’
current practices can be used as a source of inspiration, and relevant time series
identified could be analysed to identify the links between timely indicators and
standard poverty and social exclusion measures.
In this context, on the basis of a questionnaire submitted to the Directors of Social
Statistics of the national statistical institutes (NSIs) and to the national delegates
in the indicators subgroup of the Social Protection Committee, a stocktaking of
existing national approaches to providing timely social data has been carried out.
This exercise suggests that the delivery of yearly data on income distribution
through EU-SILC can be improved for most Member States by rationalizing and
improving the processing of the data, thereby reducing to 18 months (or less) after
the end of the reference year the delay for publication of the main income
distribution indicators. However, a number of countries still face rather stark
constraints linked to the late availability of register data.
A few countries are already able to deliver early estimates of key income
distribution indicators (around 12 months after the end of the reference year) on
the basis of rapid treatment of the data. However, most Member States are
reluctant about delivering such early estimates, which are seen as resource
intensive.
Most countries would be able to deliver fresh data or early estimates on material
deprivation within 6 months after the end of the reference year (the same as the
survey year in the case of material deprivation). Data processing on material
deprivation variables is lighter than that required for the income variable (i.e. no
delays related to late availability for administrative data, less checks on material
deprivation variables).
Most Member States do not currently make much use of financial distress
indicators. Regarding nowcasts, experiences are varied, although several Member
States indicate using micro-simulation models for national use. On general trends
July 2013 I 10Social Europe
Data sources for the timely monitoring of the social situation in EU
Member States
derived from data from administrative sources, most Member States already make
use of such data and some have used it to estimate the social impacts of the crisis.
Review of social developments in countries hardest
hit by the crisis
Making use of some of the alternative sources of information mentioned previously,
which go beyond the more traditional indicators available to monitor poverty and
inequalities, concise overviews have been developed of the social developments in
eight Member States, generally some of the countries hit hardest in the crisis:
Greece, Ireland, Italy, Portugal, Spain, and the three Baltic States (Estonia, Latvia
and Lithuania). These overviews are illustrative of the intelligence that can be
gathered to build an overall picture of recent social trends (based on data available
at the time they were compiled (late 2012)), and are provided in the annex to the
present document. (The appendix to that annex provides information on the
definitions and data sources for the indicators used in the country overviews.)
These country-focussed assessments make use a wide range of potential data
sources, depending on the availability for the specific country in question. They
combine the monitoring of the traditional EU-SILC based indicators with
information on gross disposable household income, the impact of the austerity
packages (as mainly derived from Euromod simulations), administrative data on
benefit recipients collected through the Social Protection Committee, the evolution
in the financial situation of households as derived from the consumer survey-based
indicator of financial distress, and key indicators from the latest European
Commission economic forecasts.
A fairly consistent picture emerges of the particularly strong deterioration in
household financial situations following the crisis in the Baltic States (although the
situation now appears to be improving there), Greece, Ireland and Spain, and with
more recent indications of a rapidly worsening situation in Italy.
Conclusion
This paper has reviewed the current problems in obtaining timely information on
social developments within EU Member States, and reports on a stocktaking
exercise of existing national approaches to providing timely social data, as well as
the possibilities that are being explored within the framework of the European
Statistical System (ESS) to improve the situation.
Making use of sources of information going beyond the more traditional indicators
available to monitor poverty and inequalities, concise overviews can be developed
to produce a consistent and more timely picture of recent social developments in
Member States. The analysis presented in annex concentrates on 8 countries
among those that have been most affected by the crisis. It shows that in the
countries reviewed the working age population has been the most affected by the
impact of the economic downturn and subsequent fiscal consolidation measures.
The most recent data also points to a severe deterioration of social trends in a few
countries, including the weakening of safety nets.
July 2013 I 11Social Europe
Data sources for the timely monitoring of the social situation in EU
Member States
Annex
Country specific reports on social developments in the crisis:
• Greece
• Ireland
• Italy
• Portugal
• Spain
Baltic States
• Estonia
• Latvia
• Lithuania
July 2013 I 12Social Europe
Data sources for the timely monitoring of the social situation in EU
Member States
Social developments country report: Greece
Synopsis: Sharp deterioration in the social situation, especially
among young adults, with the impact of austerity measures on
household incomes particularly strong and worrying signs of a
potential lack of social benefits coverage, …………… and with no end
in sight
Summary table of key social indicators for Greece, 2008-2011
Change 2008-
2011
2008 2009 2010 2011
(percentage
points or %)
At-risk-of-poverty-or-social-
28.1 27.6 27.7 31.0 2.9 pps
exclusion rate (% of population)
At-risk-of-poverty rate after social
20.1 19.7 20.1 21.4 1.3 pps
transfers (% of population)
At-risk-of-poverty threshold (Single
7219 7575 7559 6930 -4.0 %
person, PPS)
Poverty gap (Relative median
24.7 24.1 23.4 26.1 1.4 pps
poverty risk gap, %)
At-risk-of-poverty rate anchored at a
fixed moment in time (2005) (% of 18.6 16.4 16.3 22.9 4.3 pps
population)
Severely materially deprived people
11.2 11.0 11.6 15.2 4.0 pps
(% of population )
People living in households with
very low work intensity (% of 7.4 6.5 7.5 11.8 4.4 pps
population 0-59)
Children (0-17 years) at-risk-of-
poverty-or-social-exclusion (% of 28.7 30.0 28.7 30.4 1.7 pps
population 0-17)
Young adults (18-24) at-risk-of-
poverty-or-social-exclusion (% of 34.0 31.6 38.4 40.3 6.3 pps
population 18-24)
Working age adults (18-64) at-risk-
of-poverty-or-social-exclusion (% of 27.9 27.1 27.7 31.6 3.7 pps
population 18-64)
Elderly (65+) at-risk-of-poverty-or-
social-exclusion (% of population 28.1 26.8 26.7 29.3 1.2 pps
65+)
Self reported unmet need for
medical examination or treatment 4.3 4.1 4.2 6.3 2.0 pps
(% of population)
People living in households making
ends meet with great difficulty (% of 20.0 22.3 24.2 25.6 5.6 pps
population)
People in arrears on mortgage or
5.5 8.6 10.2 11.0 5.5 pps
rent payments (% of population)
Employment Rate (% of population
61.9 61.2 59.6 55.6 -6.3 pps
aged 15-64)
Real gross wages and salaries per
-1.9 2.8 -5.2 -4.9 -7.3 %
employee (annual % change)
Unemployment rate (% of labour
7.7 9.5 12.6 17.7 10.0 pps
force)
Long term unemployment rate (%
3.6 3.9 5.7 8.8 5.2 pps
of labour force)
Youth unemployment rate (% of
22.1 25.8 32.9 44.4 22.3 pps
labour force aged under 25)
Source:Eurostat, EU-SILC and EU-LFS
July 2013 I 13Social Europe
Data sources for the timely monitoring of the social situation in EU
Member States
Developments in key social indicators to date
The social situation, as indicated by the risk of poverty or social exclusion, deteriorated
markedly in Greece between 2008 and 2011 (see preceding summary table), in part
reflecting sharp falls in employment and real average wages. The 2.9 percentage point
increase in the at-risk-of-poverty-or-social exclusion rate reflected rises in all three sub-
components of the indicator, but mainly in the population share affected by severe
material deprivation and the share in very low work intensity (i.e. jobless or quasi-
jobless) households, both of which rose around 4 percentage points. The latter reflects a
particularly sharp rise in unemployment, which more than doubled between 2008 and
2011, and related to this a doubling also in the long term unemployment rate. The risk of
poverty rose rather less (around 1 pp), but was associated with an underlying 4%
decrease in the poverty threshold. Poverty developments are more evident in the
anchored poverty rate, which in fact also rose around 4 pps, while the severity of poverty
(as shown by developments in the poverty gap) has also risen. Other indicators also
suggest a clearly worsened social situation in Greece (the share of people in households
making ends meet with great difficulty and the share of people in arrears on mortgage or
rent payments are both up over 5 pps). Nowcast estimates10 using the EUROMOD tax-
benefit simulation model predict continued sharp falls in median income in Greece
through to 2012 and a continuing rise in the risk of poverty to 22.8% for that year.
With regard to the impact of the crisis on particular age groups, the increase in the risk
of poverty or social exclusion is most evident among young adults, for whom the risk
rose around 6 pps to 40%, some 10 pps higher than for all other age groups. This
reflects a particularly strong deterioration in the situation of youth on the labour market,
with their unemployment rate rising by a massive 22 pps between 2008 and 2011, and
with one-in-two active young adults in unemployment by 2011.
As a result of these developments, households in Greece are facing heightened financial
difficulties leading to severe social tensions. A clear example of the deterioration in
people's financial situations is given by the sharp rise in both the share of the population
in arrears on mortgage or rent payments and that in arrears on utility bills (Chart 1). The
rise in both has been substantial in Greece, leading to the country standing out in term of
the combined impact, and especially with regard to arrears on mortgage/rent where the
share has doubled between 2008 and 2011 and now stands well above that for other EU
Member States at 11%. Moreover, the share of the population facing great difficulty in
making ends meet has been increasing rapidly, and Chart 2 suggests that the situation is
continuing to deteriorate faster in Greece than in similar "crisis-hit" countries.
10
"Using EUROMOD to "Nowcast" poverty risk in the European Union", report by Jekaterina NAVICKE, Olga RASTRIGINA and
Holly SUTHERLAND, supported by the second Network for analysis of EU-SILC (Net-SILC2).
July 2013 I 14Social Europe
Data sources for the timely monitoring of the social situation in EU
Member States
Chart 1: Change between 2008-2011 in the population shares in arrears on mortgage/rent
payments and on utility bills, and situation in 2011
6 12
Sha re of population i n a rrears on mortgage or rent payments, 2011
Cha nge i n % of population in arrears on mortgage or rent payments
EL EL
5
10
4
LV 8 IE*
3 LV
PT
HU
HU
IE* 6
2008-2011
PT
FR
2 CY *
UK* FI
CY *
SK SK
CZ ES IT*
DK 4
EE AT EU27
1 UK* BE
LT CZ SI
PL
NL BE SI NL
SE LU
EU27 FI DK DE EE
DE ES 2 SE
0 MT RO
BG IT* MT PL
FR BG
AT LU LT
RO
-1 0
-6 -4 -2 0 2 4 6 8 10 12 14 0 5 10 15 20 25 30 35
Change in % of population in arrears on utility bills 2008-2011 Share of population i n arrears on utility bills, 2011
Source: Eurostat, EU-SILC. Note: *Cha nges for CY, IE, IT a nd UK a re to 2010 Source: Eurostat, EU-SILC. Note: *Figures for CY, IE, IT and UK are for 2010
ins tead of 2011, and for EU27 a re based on Eurostat estimates for 2011. i ns tead of 2011. 2011 EU27 figures are Eurostat estimates.
Chart 2: Trends in selected Member States for the population share living in households facing great
difficulty in making ends meet, 2006-2011
Trends in selected Member States for the population living in households
making ends meet with great difficulty, 2006-2011
30
25 EE
EL
20 ES
IE
15 IT
LT
10 LV
EU-27
5
0
2006 2007 2008 2009 2010 2011
Source: Eurostat, EU-SILC
What underpins the development in the social situation since the crisis
and what lies ahead?
In Greece, household income (as measured by gross household disposable income,
GHDI) was relatively stable in the initial period after the crisis (Chart 3). Compensation
of the self-employed started to decrease already in 2008 and in 2009 but, in contrast,
compensation of employees maintained slight increases. Only large changes in property
income had any major impact on GHDI. Social protection expenditure rose in this first
period, which helped to reduce the impact of the crisis on household income.
July 2013 I 15Social Europe
Data sources for the timely monitoring of the social situation in EU
Member States
However, the subsequent period witnessed a very sharp fall in GHDI. Post 2010 work
incomes both for employees and self-employed declined dramatically, with the impact
added to further by reduced spending on social protection benefits, although over 2011
the latter increased again and helped mitigate somewhat the overall drop in GHDI, which
nevertheless remained substantial.
Chart 3: Developments in real gross household disposable income (GHDI) and underlying
components in Greece 2003-2012 (% change for GHDI (deflated by HICP), contribution to change in
pps for the components)
Source: Eurostat, national accounts
Recent results from the EUROMOD micro-simulation model11 allow to illustrate the
impact of some austerity measures on households’ incomes in Greece, and in selected
other Member States (results focus on the fiscal consolidation measures implemented
after the 2008 economic downturn and up to mid-2012, and hence cover a longer period
than the standard social indicators mentioned previously). The simulations imply the
impact of austerity measures on household incomes has been particularly strong in
Greece (a drop of 11.6% excluding effects from VAT rises), mainly reflecting large
increases in income taxes together with declines in public sector wages and cuts in public
pensions (Chart 4).
In terms of distributional implications, the EUROMOD simulations suggest that in Greece
the better-off lost a higher proportion of their incomes than the poor as a result of the
consolidation measures modelled (Chart 5). However, while the effect of consolidation
measures can be labelled progressive, significant drops in income tend to weigh more
heavily on the already constrained budgets of the poorest households, and affect their
actual living standards more severely. The overall progressive effect of the consolidation
measures in Greece is primarily due to public-sector wage cuts, further strengthened by
cuts in public pensions and the broadly progressive nature of tax increases. The overall
pattern across income deciles is little changed when including the effect of increases in
the standard rate of VAT, which is regressive, but the effect is important and for the
lower income groups is of a similar magnitude to the measures affecting household
incomes directly. Focusing on the most recent changes introduced between mid-2011
and mid-2012, they appear to have an even stronger progressive impact.
11
"The distributional effects of fiscal consolidation in nine EU countries", Social Situation Observatory, Research Note 01/2012.
July 2013 I 16Social Europe
Data sources for the timely monitoring of the social situation in EU
Member States
Chart 4 — Contribution of austerity packages to change in household incomes
Source: Social Situation Observatory, Research note 01/2012, based on EUROMOD
Note: chart shows the effects of simulated household income-based fiscal consolidation measures in place from 2008 to 2012
as a percentage of total household disposable income, by type of policy (excluding VAT). Source: EUROMOD (cumulated impact
of austerity measures on household disposable incomes).
Chart 5 — Simulated household income-based fiscal consolidation measures as a percentage of
household disposable income by income decile group: change excluding and including VAT increases
Source: Social Situation Observatory, Research note 01/2012, based on EUROMOD
With the deterioration in the employment situation and the growing number of
unemployed and their longer stay in unemployment, more people are in need of social
transfers. Administrative data collected via the Social Protection Committee on benefit
July 2013 I 17Social Europe
Data sources for the timely monitoring of the social situation in EU
Member States
recipients for different social schemes, gives a picture of the pressure on the social
security system in Greece. The data suggest that the rapid growth in unemployment has
not been matched by similar trends in benefit recipients, which may lead to a potential
lack of social benefits coverage (Chart 6). Indeed, there is a worrying sign of a diverging
trend between the number of unemployed and the number of recipients of
unemployment benefits, suggesting that more and more people are not covered by this
safety net. The relatively low coverage rate in Greece (calculations from EU-SILC data
indicate the proportion of unemployed receiving unemployment benefits at around 30%
back in 2009), combined with the lack of a minimum income guarantee, is having serious
social impacts. Furthermore, the healthcare aspect of social protection also appears to be
affected, as evidenced by the rise in the reported unmet need for medical care (see initial
summary table of social indicators), which has increased by 2 pps.
Chart 6 — Evolution of the number of benefit recipients and number of unemployed (in 1000) in
Greece
Source: Data on number of unemployed from Eurostat (ILO definition, in 1000 persons, seasonally adjusted); data on number
of benefit recipients collected from Member States through SPC delegates.
The worsening in household financial positions from 2010 onwards as evidenced via GHDI
is supported by data on the evolution in the financial situation of households as derived
from a consumer survey-based indicator of financial distress12. This shows that
compared to pre-crisis levels (2007), the share of the population facing financial distress
has risen most strongly in Greece among all Member States (Chart 7). Furthermore, over
the year to October 2012, the share of the population living in households reporting
financial distress has continued to rise significantly, and the trend seems to point to
further increases going forward (Chart 8). All this suggests that a further noticeable
weakening of the social situation in Greece could be expected in the standard social
indicators for 2012.
12
The combined population shares reporting they are either having to draw on savings or are running into debt. The data
source is consumer surveys carried out under the joint harmonised EU programme of business and consumer surveys
July 2013 I 18Social Europe
Data sources for the timely monitoring of the social situation in EU
Member States
Chart 7: Change in share of the population in households reporting financial distress across EU
Member States (as at October 2012)
Change over last year vs av over 2007 (pre-crisis)
25.00
20.00
15.00
percentage points
10.00
5.00
0.00
-5.00
-10.00
SE LT DE PL MT FI BE FR LU AT NL EE DK PT SI CY EU LV RO UK HU CZ SK BG IT ES EL
Source: Joint harmonised EU consumer surveys & DG EMPL calculations.
Chart 8: Developments in the share of households reporting financial distress in Greece, 2000-2012
(as at October 2012)
Greece: Reported financial distress in households (2000-2012)
Total Long term av H-P Total
40
35
30
% of responses
25
20
15
10
5
0
Jan-2000
Jan-2001
Jan-2002
Jan-2003
Jan-2004
Jan-2005
Jan-2006
Jan-2007
Jan-2008
Jan-2009
Jan-2010
Jan-2011
Jan-2012
May-2000
Sep-2000
May-2001
Sep-2001
May-2002
Sep-2002
May-2003
Sep-2003
May-2004
Sep-2004
May-2005
Sep-2005
May-2006
Sep-2006
May-2007
Sep-2007
May-2008
Sep-2008
May-2009
Sep-2009
May-2010
Sep-2010
May-2011
Sep-2011
May-2012
Sep-2012
Source: Joint harmonised EU consumer surveys & DG EMPL calculations.
Note: 3 month centred moving average figures
Source: Joint harmonised EU consumer surveys & DG EMPL calculations.
Note: 3 month centred moving average figures, HP refers to smoothed series using a Hodrick-Prescott filter.
Moreover, according to the latest European Commission economic forecasts, the
economic and labour market situation is expected to have deteriorated markedly further
over 2012 (Table 1). GDP is estimated to have declined a further 6.4% in 2012 following
a 7% reduction the year before, with even more marked impacts on the labour market as
employment is estimated to have contracted by 8%. As a result unemployment has risen
sharply to affect almost one in four of the labour force. All this is suggesting yet further
significant impacts on the social situation and the associated main social indicators which
could be expected for 2012.
July 2013 I 19Social Europe
Data sources for the timely monitoring of the social situation in EU
Member States
Table 1: Key macroeconomic indicators for Greece, 2008-2013
2012 2013
2008 2009 2010 2011
(forecasts) (forecasts)
GDP growth (% change on prevous
-0.2 -3.1 -4.9 -7.1 -6.4 -4.2
year)
Employment growth (% change on
1.2 -0.6 -2.6 -5.6 -8.3 -3.5
previous year)
Unemployment rate (% of the
7.7 9.5 12.6 17.7 24.3 27.0
labour force)
Source: Eurostat, national accounts and EU-LFS, and European Commission Spring 2013 economic forecast
Conclusion
Available key social indicators suggest that Greece has suffered considerable social
impacts following the crisis, with no signs yet of any relief. Although household financial
situations were relatively stable in the initial period following the outbreak of the crisis,
sharp falls in household income have occurred in the subsequent period. The latter
reflects sharp declines in earnings post 2009, which have not been offset by any
substantial rise in social protection expenditure. Moreover, data suggest that the rapid
growth in unemployment has not been matched by similar trends in benefit recipients,
with worrying signs of a potential lack of social benefits coverage and concerns over the
effectiveness of safety nets. EUROMOD simulations imply that the impact of austerity
measures on household incomes has been particularly strong in Greece, mainly reflecting
large increases in income taxes and VAT together with declines in public sector wages
and cuts in public pensions. Despite their progressive nature, such significant drops in
income weigh more heavily on the already constrained budgets of the poorest
households, and affect their actual living standards more severely. Recent data suggest
no easing in the financial situation of households, which can be expected to translate into
even worse figures for the standard social indicators (AROPE, AROP, SMD etc.) for 2012.
July 2013 I 20Social Europe
Data sources for the timely monitoring of the social situation in EU
Member States
Social developments country report: Ireland
Synopsis: Rising share of people in jobless households and sharp
falls in household income, with consequent increased risks of
poverty or social exclusion especially among children and young
adults
Summary table of key social indicators for Ireland, 2008-2010
Change 2008-
2010
2008 2009 2010 2011
(percentage
points or %)
At-risk-of-poverty-or-social-
23.7 25.7 29.9 6.2 pps
exclusion rate (% of population)
At-risk-of-poverty rate after social
15.5 15.0 16.1 0.6 pps
transfers (% of population)
At-risk-of-poverty threshold (Single
10901 10556 9705 -11.0 %
person, PPS)
Poverty gap (Relative median
17.7 16.2 15.2 -2.5 pps
poverty risk gap, %)
At-risk-of-poverty rate anchored at a
fixed moment in time (2005) (% of 9.9 9.9 15.8 5.9 pps
population)
Severely materially deprived people
5.5 6.1 7.5 2.0 pps
(% of population )
People living in households with
very low work intensity (% of 13.6 19.8 22.9 9.3 pps
population 0-59)
Children (0-17 years) at-risk-of-
poverty-or-social-exclusion (% of 26.6 31.4 37.6 11.0 pps
population 0-17)
Young adults (18-24) at-risk-of-
poverty-or-social-exclusion (% of 23.7 26.4 34.4 10.7 pps
population 18-24)
Working age adults (18-64) at-risk-
of-poverty-or-social-exclusion (% of 22.6 24.8 29.7 7.1 pps
population 18-64)
Elderly (65+) at-risk-of-poverty-or-
social-exclusion (% of population 22.5 17.9 12.9 -9.6 pps
65+)
Self reported unmet need for
medical examination or treatment 1.2 1.2 1.7 0.5 pps
(% of population)
People living in households making
ends meet with great difficulty (% of 9.3 11.2 15.2 5.9 pps
population)
People in arrears on mortgage or
5.6 6.5 8.1 2.5 pps
rent payments (% of population)
Employment Rate (% of population
67.6 62.2 59.6 58.9 -8.0 pps
aged 15-64)
Real gross wages and salaries per
8.2 3.6 -1.2 -0.9 1.5 %
employee (annual % change)
Unemployment rate (% of labour
6.4 12.0 13.9 14.7 7.5 pps
force)
Long term unemployment rate (%
1.7 3.5 6.8 8.7 5.1 pps
of labour force)
Youth unemployment rate (% of
13.3 24.0 27.6 29.1 14.3 pps
labour force aged under 25)
Source:Eurostat, EU-SILC and EU-LFS
July 2013 I 21Social Europe
Data sources for the timely monitoring of the social situation in EU
Member States
Developments in key social indicators to date13
The social situation, as indicated by the risk of poverty or social exclusion, deteriorated
markedly in Ireland between 2008 and 2010 (see preceding summary table). The 6.2
percentage point increase in the at-risk-of-poverty-or-social exclusion rate reflected rises
in all three sub-components of the indicator, but especially the share of the population
living in very low work intensity (i.e. jobless or quasi-jobless) households, a direct
consequence of the surge in unemployment. Indeed, the unemployment rate more than
doubled between 2008 and 2010, while long term unemployment has risen rapidly, with
the rate having quadrupled to almost 7%, albeit from a relatively low starting level.
More limited rises have been observed in the population shares affected by severe
material deprivation (SMD) and by the risk of poverty. However, the latter was
associated with a substantial underlying decrease in the poverty threshold of 11%, and
the alternative measure of the poverty rate anchored at a fixed point in time, up around
6 pps, gives a much clearer indication of the extent of poverty developments. Other
indicators also suggest a clearly worsened social situation in Ireland: the share of people
in households making ends meet with great difficulty has risen by close to 6 pps, and the
share of people in arrears on mortgage or rent payments is up 2.5pps, and at 8% is now
second only to Greece.
As a result of these developments, Ireland now finds itself alongside some of the Member
States hit hardest by the crisis, such as Greece, Hungary and Lithuania in terms of
overall poverty and social exclusion (Chart 1). However, most of this arises specifically
from the issue of jobless households (i.e. labour market exclusion), rather than aspects
related to poverty or deprivation. Indeed, in terms strictly of the standard measures of
the extent and severity of poverty, Ireland remains in a relatively good position
compared to many other Member States (Chart 2).
13
Social indicators for Ireland are currently only available up to the year 2010 (due to non-delivery of EU-SILC data), hence this
review currently only refers to the situation up to 2010.
July 2013 I 22Social Europe
Data sources for the timely monitoring of the social situation in EU
Member States
Chart 1: Developments in the risk of poverty or social exclusion across EU Member States between
2008 and 2010
Chart 2: Developments over 2008-2011 in the poverty gap and the risk of poverty across EU Member
States in 2008 and 2011
Changes 2008-2011 in
2008 percentage points 2011
35 AROP Poverty Gap 35
BE 0.6 1.4
BG 1.0 2.0
RO CZ 0.8 -1.3 LV RO
DK 1.2 3.4 ES
30 DE 0.6 -0.8 30
EE -2.0 5.7 BG
LV LT
IE* 0.6 -2.5
BG EL 1.3 1.4
ES 2.2 7.2 EE EL
LT
25 FR 1.3 2.3 25
EL IT*
IT* -0.5 1.5
Poverty Gap
Poverty Gap
ES
PT CY* 0.1 1.5 EU27 PT
IT SK
DE LV -6.3 3.1
EU27 DE
UK
LT 0.0 3.0 DK PL
MT PL LU 0.2 -0.9 UK*
20 EE 20 SI
SI HU 1.4 1.0
ATSE
CZ SK MT 0.4 -2.7 BE
SE HU CY*
DK HU BEIE NL 0.5 0.6 CZ FR MT
LU CY AT 0.2 3.7
AT FI LU
PL 0.8 0.8 NL IE*
15 NL FR 15
PT -0.5 0.0
RO -1.2 -0.5 FI
SI 1.3 0.6
SK 2.1 4.7
FI 0.1 -2.2
10 10
5 10 15 20 25 30
SE 1.8 0.5 5 10 15 20 25 30
UK* -1.6 0.4
AROP AROP
Source: Eurostat, EU-SILC. Note: changes in AROP and Poverty gap of more than 1 percentage point are highlighted in grey.
*Figures for CY, IE, IT and UK are for 2010 instead of 2011. 2011 EU27 figure is Eurostat estimate.
With regard to the impact of the crisis on particular age groups, the increase in the risk
of poverty or social exclusion is most evident among children and young adults, with the
risk for both age groups up around 11pps. The risk for working age adults in general also
rose markedly. All this reflects the particularly strong deterioration in the labour market
situation, especially for youth (close to one-in-four active young adults was unemployed
in 2011) and the knock-on effects on people living in jobless households. In contrast, the
July 2013 I 23Social Europe
Data sources for the timely monitoring of the social situation in EU
Member States
risk of poverty or social exclusion for the elderly declined sharply, reflecting the fact that
this age group is not affected by labour market developments and rising unemployment,
and that pensions remained largely unchanged during the crisis which has improved
pensioners’ relative position in the income distribution without necessarily altering their
actual situation.
What underpins the development in the social situation since the crisis
and what lies ahead?
In Ireland, household income (as measured by gross household disposable income,
GHDI) declined in the initial period after the crisis (Chart 3), despite increased social
protection expenditure. During this first period it was mainly the large decrease in the
work income of both employees and self-employed that drove the fall in GHDI from 2009
onward. The positive effect of social protection benefits on GHDI, together with a smaller
positive effect from changes in taxes, was not strong enough to compensate for the
sharp falls in income from work. Property income played nearly no role in Ireland.
In the second period (2010 onward), the drop in GHDI continued, mainly because social
protection benefits did not compensate for the further decreases in the compensation of
employees. In 2011 particularly, increases in social protection benefits were accompanied
by increases in taxes, which during most of that year resulted in GHDI continuing to
decrease. Only at the end of the year did growth in GHDI finally turn positive again.
Chart 3: Developments in real gross household disposable income (GHDI) and underlying
components in Ireland 2003-2012 (% change for GHDI (deflated by HICP), contribution to change
in pps for the components)
Source: Eurostat, national accounts
Based on micro-simulation exercises, notably using EUROMOD14, the impact of austerity
measures in Ireland appears rather progressive, though the latest changes seem to have
softened somehow the assessment. In broad terms the measures included lowering of
income tax bands and reduction in tax credits, introduction of a new income levy,
increased social insurance contributions, cuts in cash benefits and a freeze in contributor
benefits, and cuts in public sector pay. Minor changes to indirect taxes were not
simulated.
- The assessment of austerity measures 2009-2011 showed a progressive impact
on the income distribution (showing a decline of around 6.5% on household
14
"The distributional effects of austerity measures: a comparison of six countries", Social Situation Observatory, Research Note
2/2011
July 2013 I 24You can also read