COVID-19, SOCIAL PROTECTION, AND THE LABOUR MARKET IN SOUTH AFRICA: Are social grants being targeted at the most vulnerable? - Africa Portal
←
→
Page content transcription
If your browser does not render page correctly, please read the page content below
COVID-19, SOCIAL PROTECTION,
AND THE LABOUR MARKET IN
SOUTH AFRICA:
Are social grants being targeted at the
most vulnerable?

By Tim Köhler and Haroon Bhorat

DPRU Working Paper 202008
                 August 2020
COVID-19, SOCIAL PROTECTION, AND THE
                LABOUR MARKET IN SOUTH AFRICA:
Are social grants being targeted at the most vulnerable?

                      DEVELOPMENT POLICY RESEARCH UNIT

                                          TIM KÖHLER
                                      tim.kohler@uct.ac.za

                                         HAROON BHORAT

                                     Working Paper 202008

                                   ISBN 978-1-920633-80-6

                                             August 2020

                      © DPRU, University of Cape Town 2020
    This work is licensed under the Creative Commons Attribution-Non-Commercial-Share Alike 2.5 South Africa License. To view a copy of this licence,
    visit http://creativecommons.org/licenses/by-nc-sa/2.5/za or send a letter to Creative Commons, 171 Second Street, Suite 300, San Francisco,
    California 94105, USA.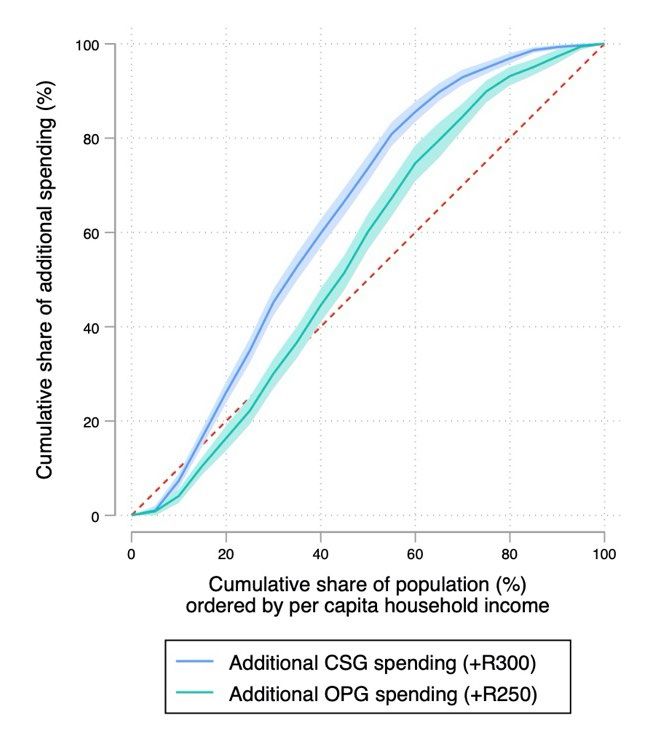
Abstract
In light of the South African government’s pandemic-induced expansion of the country’s social
protection system to provide relief to vulnerable individuals and households, this paper aims
to use newly available, nationally representative survey data – Wave 1 of the NIDS-CRAM – to
provide a quantitative, descriptive evaluation of whether social grants are being successfully
targeted at the most vulnerable in the context of the national lockdown and COVID-19 crisis.
In particular, we highlight heterogeneity in labour market outcomes before and during the
national lockdown to show that social grants are an important source of income relief for
individuals in low-income households. We show that these individuals have been
disproportionately burdened by adverse labour market effects induced by the lockdown with
respect to employment loss, the likelihood of having a paid job to return to, and reductions in
working hours and earnings. We show that grants substantially increase the incomes of poor
households in relative terms and, through fiscal incidence analysis, we show that the
pandemic-induced additional government spending on grants have been pro-poor, especially
that on the Child Support Grant. Considering the observed heterogeneity in labour market
outcomes before and during lockdown across the household income distribution and that
grants are relatively well-targeted; we conclude with a set of policy recommendations for
South Africa’s social protection system going forward.
Acknowledgements
This research has been published as a National Income Dynamics Study (NIDS) – Coronavirus
Rapid Mobile Survey (CRAM) policy paper (#6, 15 July 2020). For further information please
see www.cramsurvey.org.

Working Papers can be downloaded in PDF (Adobe Acrobat) format from www.dpru.uct.ac.za. A
limited number of printed copies are available from the Communications Manager: DPRU, University
of Cape Town, Private Bag X3, Rondebosch, Cape Town, 7700, South Africa. Tel: +27 (0)21 650 5701,
email: sarah.marriott@uct.ac.za.

Corresponding author

Tim Köhler (Junior Researcher and PhD candidate, Development Policy Research Unit, School of
Economics, Faculty of Commerce, University of Cape Town)
email: tim.kohler@uct.ac.za

Recommended citation

Köhler, T. and Bhorat, H. (2020). COVID-19, social protection, and the labour market in South Africa:
Are social grants being targeted at the most vulnerable?. Development Policy Research Unit Working
Paper 202008. DPRU, University of Cape Town.

Disclaimer

The Working Paper series is intended to catalyse policy debate. They express the views of their
respective authors and not necessarily those of the Development Policy Research Unit (DPRU).
DPRU WP 202008

Executive Summary

In response to the COVID-19 crisis and regulations which restrict social mobility and interaction, most
governments around the world have expanded their social protection systems as a means of providing
relief to vulnerable individuals and households. In this light, South Africa’s government expanded its
non-contributory social assistance system (unconditional cash transfers or social grants) on both the
intensive (an increase in the amounts of all existing transfers) and extensive (the introduction of a
special COVID-19 Social Relief of Distress grant) margins for six months from May to October 2020. This
paper aims to use newly available, nationally representative survey data – Wave 1 of the NIDS-CRAM –
to provide a quantitative, descriptive evaluation of whether social grants are being successfully targeted
at the most vulnerable in the context of South Africa’s national lockdown and the COVID-19 crisis. In
particular, we highlight heterogeneity in labour market outcomes before and during the national
lockdown to show that the expansion of social grants is an important source of income relief for
individuals in low-income households. Based on this data, we find that individuals in lower-income
households have been disproportionately affected by the adverse labour market effects of the
lockdown with respect to employment, working hours, earnings, and job security. Considering this and
that grants are relatively well-targeted, we emphasise their role as an important source of relief for
individuals in low-income households.

Grants are relatively well-targeted to lower-income households in South Africa, and the distribution of
household income during lockdown makes it clear why they serve as an important source of relief.
About R270 per month is available for the average individual who lives in the poorest half of households.
This is in stark contrast to those who live in the richest 10% of households who receive about 30 times
that amount, or R8 367 per person per month. Grant receipt substantially increases the incomes of
poor households in relative terms. CSG receipt increases per capita household income by about 63%
for those in the poorest 30% of households, in contrast to the less than 3% increase for those in the
richest 30% of households. Nearly half of all individuals who live in the poorest 50% of households
report grants as a source of household income, in sharp contrast to 6% of individuals in the richest 20%.
Overall, our estimates suggest that grants are relatively well-targeted to low-income households in
South Africa.

The adverse labour market effects of the pandemic and lockdown have been disproportionately borne
by individuals in lower-income households. Although we estimate that overall employment decreased
from February to April decreased by about 2.8 million, employment loss for individuals who live in the
poorest 20% of households accounts for more than a third (35%) of total employment loss (or over 970
000 less people employed). The percentage of individuals employed in the poorest 10% of households
was 55% lower in April relative to February – the largest relative change across the distribution. Just
17% of individuals report having a paid job to return to, however this is the case for just 7.6% for
individuals in the poorest 10% of households. Individuals in the richest 10% of households are nearly
seven times more likely to have a paid job to return to. Changes in working hours and earnings reflect
similar patterns. Overall, mean weekly working hours decreased by just over 7.6 hours (or about 20%),
but 31% for individuals in the poorest 20% of households. More than half (50.6%) of all individuals who
live in the poorest 20% of households experienced any reduction in weekly working hours, as opposed
to just a third (33.3%) who live in the richest 20% of households. These disproportionate changes in
outcomes emphasise the importance of the expansion of social grants as a source of relief for
individuals in lower-income households.

                                                    i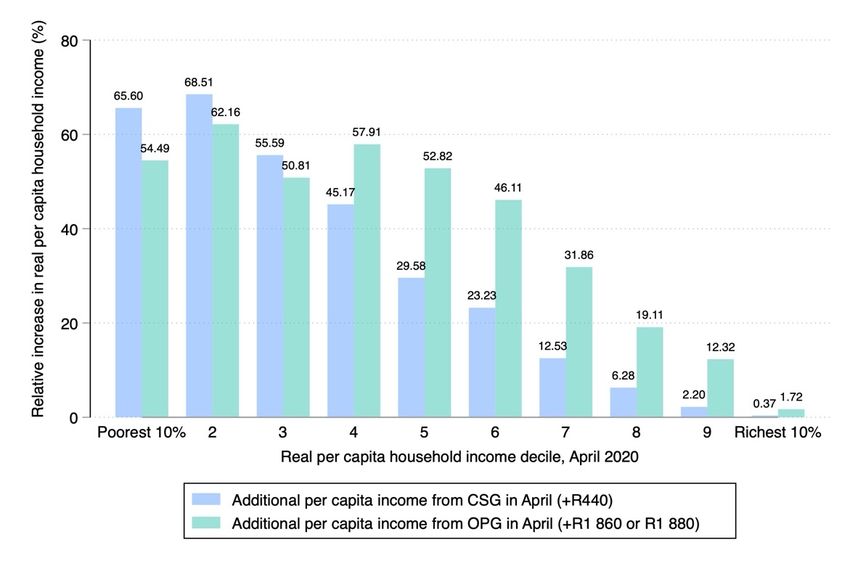
COVID-19, social protection, and the labour market in South Africa:
Are social grants being targeted at the most vulnerable?
The pandemic-induced additional government spending on grants have benefited the poor; however
additional spending on the CSG has been particularly pro-poor in the beginning of lockdown. Through
fiscal incidence analysis, we show that 64% of additional spending on the CSG accrued to the poorest
half of all households, as opposed to just 5.6% for the richest 20%. Three in every four individuals (76%)
who co-reside with a CSG recipient live in the poorest 70% of 2 | COVID-19, Social Protection, and the
Labour Market in South Africa: Are social grants being targeted at the most vulnerable? households.
The OPG is slightly less but still pro-poor, with 50% of additional spending accruing to the poorest half
of households and 13% to the richest 20%. This has important implications for the grant system in
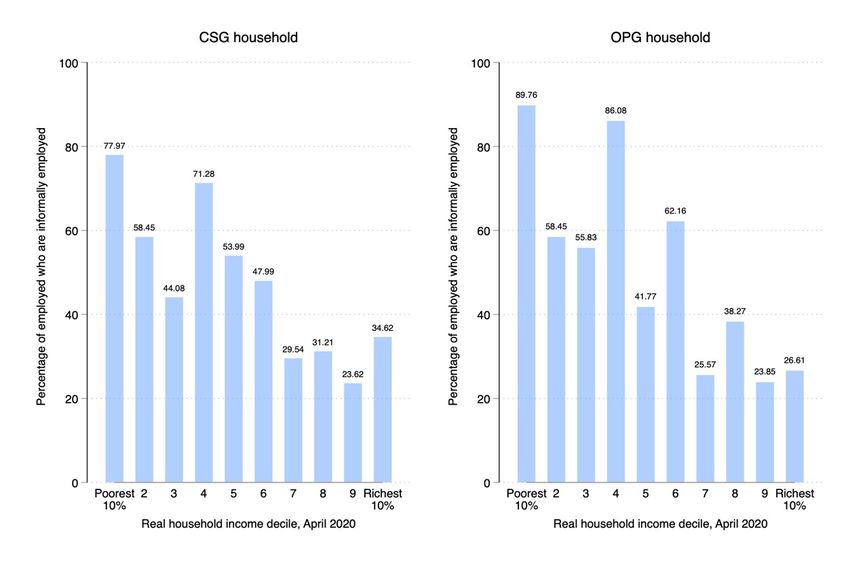
benefiting the informally employed. Nearly two thirds (63%) of employed individuals who live in the
poorest half of households are informally employed, and nearly four in every five (78%) of the employed
who live in the poorest 10% of households which receive the CSG are informally employed.
What policy instruments are available to help provide these individuals and households with
protection? First, the inefficiencies associated with the relatively slow-rollout of the COVID-19 SRD
grant, attributable to limited administrative capacity or possible confusion surrounding the correct
eligibility criteria, ought to be addressed and drastically improved. Regarding social insurance, the
efficiency of the UIF’s administrative system ought to be addressed to ensure that those eligible receive
timeous income protection. Next, to provide greater targeted relief, government ought to consider
amending the CSG top-up policy from June onwards from a “per caregiver” increase to a “per grant”
increase. Finally, if the adverse labour market effects observed in this paper persist, government ought
to consider extending the expansion of the grant system for at least the remainder of the year.
ii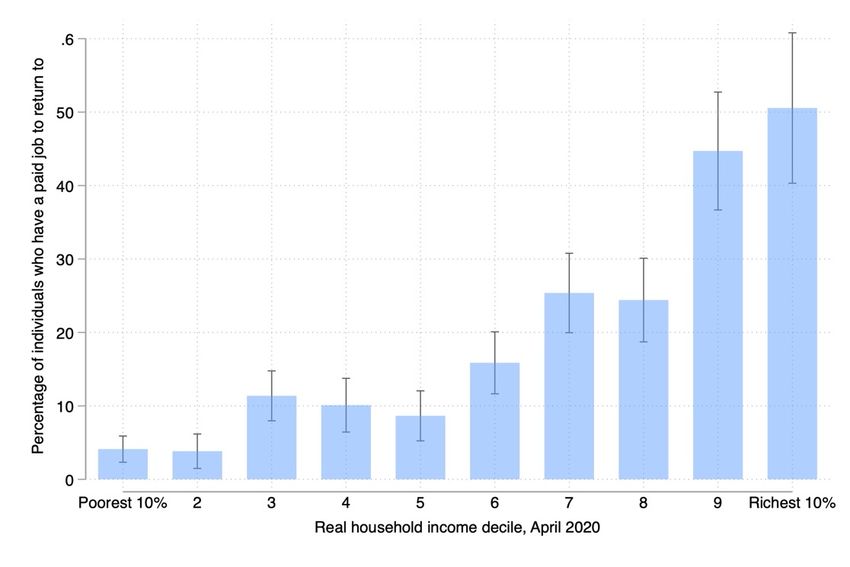
DPRU WP 202008

1. Introduction and Background
The COVID-19 pandemic has led many governments across the world to introduce and impose
restrictions on social mobility and interaction with the primary aim of curbing the spread of the virus.
Economic lockdowns (or ‘stay-at-home’ or ‘shelter-in-place’ orders) require individuals to remain home
for all but essential activities such as food and medicine procurement or travelling for employment
deemed essential. South Africa’s response in this regard was relatively rapid and stringent relative to
global and Sub-Saharan African average indices (Gustaffson, 2020). Following the declaration of a
National State of Disaster on 15 March 2020, South Africa’s number of confirmed COVID-19 cases
passed 100 just three days later and a complete national lockdown was imposed for five weeks from
27 March until 1 May 2020 when a risk-adjusted, phased re-opening of the economy was introduced.
Such a lockdown policy, however, is expected to lead to substantial losses in livelihoods with respect to
employment, working hours, and earnings. Using pre-crisis data, Francis et al. (2020) estimate that just
two in every five (40%) workers in South Africa are permitted to work under the government’s most
stringent lockdown regulations. 1

Such adverse economic effects are expected to be disproportionately greater in developing countries
owing to insufficient resources and capacity (Loayza, 2020). Sub-Saharan Africa is set to be the worst-
hit region. Valensisi (2020) estimates an increase in the 2020 poverty headcount ratio of 2.7
percentage points for the region, or an additional 31 million people living in extreme poverty 2 -
equivalent to the 2011 regional poverty level. Using 10 years of Demographic and Health Survey (DHS)
data for 54 countries, Brown et al. (2020) estimate that just 4% of households in sub-Saharan Africa are
equipped to fully comply with non-pharmaceutical recommendations for protection from the virus,
with virtually zero in the poorest 40% being able to fully comply. Furthermore, a large proportion of the
labour force in developing countries cannot feasibly work from home. In South Africa, Kerr and
Thornton (2020) estimate that only 13.8% of workers (just over 2 million people) could work from home
under a complete national lockdown, and the vast majority of workers (63% or 10.5 million people) are
neither essential nor could work from home. Furthermore, the authors show that this latter group of
workers are concentrated amongst the poorest earners in the South African labour market: only 28%
of workers in the poorest half of the income distribution are either essential or could work from home,
in contrast to 61% of workers in the top 10%.

Most governments around the world have used cash transfers as a means of resource distribution to
lower-income households in light of the COVID-19 pandemic. As of 22 May 2020, a total 190 countries
had planned, introduced, or adapted social protection measures in place, representing a more-than-
eightfold increase in measures from 103 measures in 43 countries in just two months (Gentilini et al.,
2020). 60% of these programs are non-contributory social assistance programs, and cash transfers
account for approximately half of these programs. Such an expansion of social assistance was included
in the South African government’s package of relief measures, a stimulus amounting to over ZAR500
billion (or approximately 10% of Gross Domestic Product) of which ZAR50 billion was allocated to social
assistance (National Treasury, 2020). However, this amount was later reduced to ZAR40 billion as per
the Minister of Finance’s special Supplementary Budget presented towards the end of June 2020. This
expansion of social assistance came in the form of (i) an increase in the amount of every existing
unconditional cash transfer (hereafter referred to as social grants) and (ii) the introduction of a special
COVID-19 Social Relief of Distress (SRD) grant, both for six months. These changes are expected to

1 Although a useful benchmark until more recent data becomes available, these estimates assume that the lockdown results
in no (temporary or permanent) job losses, and do not take account of workers who can work from home.
2 Measured as individuals living on less than $1.90 per day (2011 PPP).

                                                           1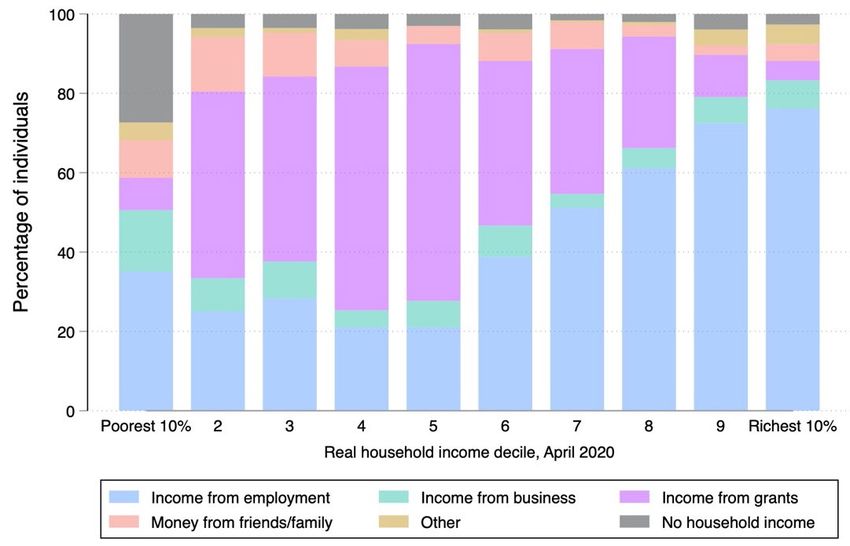
COVID-19, social protection, and the labour market in South Africa:
                                                     Are social grants being targeted at the most vulnerable?

benefit nearly 18 million existing grant recipients and a potential 12 million additional recipients (Bhorat
et al., 2020). As of 30 June 2020, 3.2 million individuals had been approved and 2.5 million paid. 3

This study is amongst the first to use newly available, nationally representative survey data – the
National Income Dynamics Study-Coronavirus Rapid Mobile Survey (NIDS-CRAM), described in more
detail in Section 3.1 – to provide a quantitative, descriptive evaluation of whether social grants are
being successfully targeted at the most vulnerable in South Africa in the context of the COVID-19 crisis.
With respect to vulnerability, we focus on heterogeneity in severe changes in labour market outcomes
across the household income distribution motivated by the relationship between adverse shocks,
employment, and poverty. Adverse shocks can easily generate poverty traps. In South Africa, Schotte
(2019) finds that nearly 70% of the non-poor who experience downward mobility fall into structural
(non-transitory) poverty, and employment transitions are among the main events associated with
poverty transitions. In this light, the COVID-19 pandemic may not only be a temporary shock but may
have long-lasting implications on welfare partially through its effects on the labour market. Considering
this, we specifically focus on the distribution of social grants across several labour market outcomes
such as employment, monthly earnings, and weekly hours worked and seek to highlight heterogeneity
across the household income distribution both before and during the national lockdown.

The remainder of this paper proceeds as follows. Section 2 provides a brief overview of the South
African social protection system. Section 3 describes the data and our methodology, while Section 4
presents several descriptive statistics. Finally, Section 5 concludes.

2. The South African Social Protection System
    2.1. Contemporary social protection in South Africa

In present-day South Africa, race no longer acts as an eligibility requirement or targeting device for
social protection as it did in the apartheid era. Rather, means testing, the fact that poorer households
have more children and the fact that the private health care system is used in preference to the public
system for those who can afford it means that social spending is now extremely well-targeted towards
the poor (Van der Berg, 2014). Since democratization, social assistance in particular has expanded
significantly with nearly 18 million recipients (or nearly one in every three South Africans) as of 2019/20
at a cost of 3.4% of GDP (South African Social Assistance Agency, 2020). However, little progress has
been made with respect to social insurance (Woolard, 2011). The basic structure of the current social
protection system is outlined in Figure 1. It is useful to distinguish between social assistance (which
protects the poor using cash or in-kind transfers) and social insurance (which protects individuals
against adverse events). Primarily, the system consists of tax-financed, unconditional, and means-
tested (except for the Foster Care Grant) cash transfers, which primarily empower vulnerable children,
the elderly, and the disabled (Moore and Seekings, 2019).

Despite South Africa’s relatively comprehensive social safety net, there are still large holes in the net
with little provision for the working-aged unemployed (Moore and Seekings, 2019). This is rooted in the
fact that, as in Latin America and elsewhere, the structure of South Africa’s social protection system
relies on the assumption that only ‘dependent’ categories (such as the elderly, disabled, and children)
are in need of support, and that prime-aged, able-bodied individuals are presumed to be able to
support themselves through the labour market and are therefore excluded from receiving social
assistance (Ferguson, 2015). However, such a view clearly neglects the widespread, structural
unemployment which plagues South Africa (Bassier et al., 2020). As of the first quarter of 2020, nearly

3See South African Social Security Agency’s (SASSA) Media Release dated 30 June 2020:
https://www.sassa.gov.za/newsroom/Documents/SASSA%20Sends%20Lifeline%20to%20Rejected%20COVID-
19%20Grant%20Applicants.pdf.

                                                     2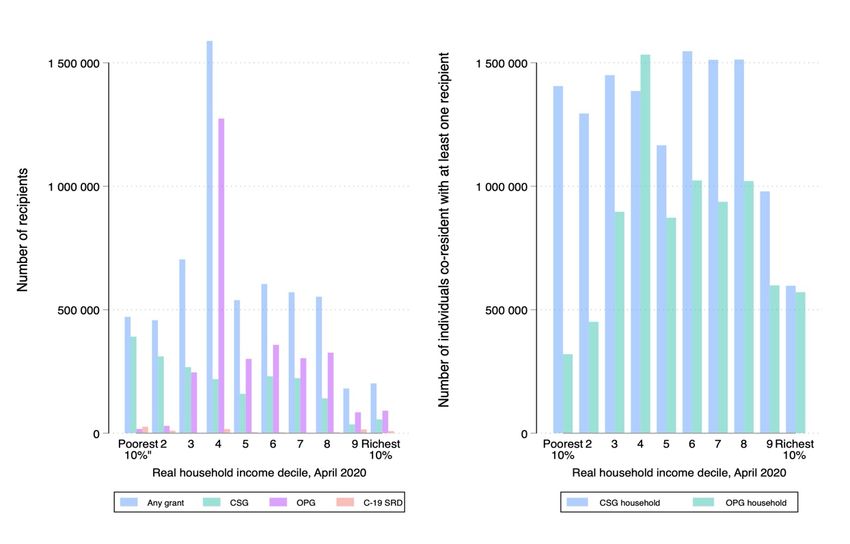
DPRU WP 202008

three in every four (71.7% or approximately 5 million people) of the work-seeking unemployed have
been so for more than one year. 4

Figure 1: The basic structure of the South African social protection system

          Social assistance                                        Social insurance

             Non-contributory, unconditional                          Statutory
             cash transfers                                           • Unemployment Insurance Fund (UIF)
             • Child Support Grant                                    • Road Accident Fund (RAF)
             • Older Persons Grant                                    • Compensation Fund
             • Disability Grant
             • War Veterens' Grant
             • Foster Care Grant
             • Care Dependency Grant                                  Voluntary, regulated by
             • Grant-in-aid                                           government
             • Social Relief of Distress Grant                        • Private medical schemes
                                                                      • Private retirement schemes
                                                                      • Government Employees Pension Fund

            Expanded Public Works Programme
Authors’ own arrangement. Source: National Treasury (2020).

The CSG constitutes the largest grant in the system in terms of number of beneficiaries, accounting for
71% (or nearly 13 million individuals) of total grant recipients in 2019/20 as per Table 1. The grant’s
large take-up is largely attributable to gradual increases in the age eligibility threshold and a less
stringent means test. The means test is set to 10 times the grant amount and from 2010, all (income-
eligible) children born after 1996 who are younger than 18 years are eligible. The Older Persons Grant
(formerly the Old Age Pension) and Disability Grant (the only grant intended for working-age adults)
are the second and third largest grants collectively accounting for more than one in every four
recipients. More than one in every two South Africans live in a household which receives income from
either the CSG or Older Persons Grant (Bassier et al., 2020). Both the Older Persons Grant and Disability
Grant are means tested and benefits are more than four times larger than the CSG. Social assistance
also consists of the Expanded Public Works Program (EPWP) which is in essence employment-based
basic income security for the working-age. Introduced in 2004, the EPWP is a government supply-side
programme which aims to create employment, aid skills development, and provide income relief for
the unemployed by providing temporary work. However, the programme’s scale is determined by the
government’s capacity of creating employment opportunities and therefore, it cannot provide jobs to
all of the work-seeking unemployed (Peres, 2019).

4   Own calculations using Statistics South Africa’s 2020 Quarter 1 Quarterly Labour Force Survey microdata.

                                                               3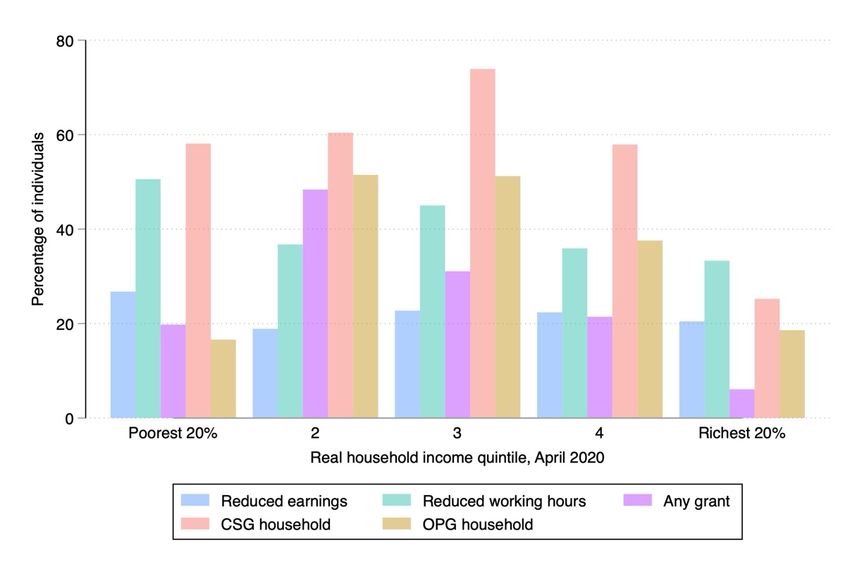
COVID-19, social protection, and the labour market in South Africa:
                                                             Are social grants being targeted at the most vulnerable?

Table 1: Number of grants distributed by grant type, 2009/10 versus 2019/20
                                              2009/10                                   2019/20                    Growth in
                               Monthly                                   Monthly                                   recipients
                                amount                                    amount                                   (2009/10 -
                                            Thousands      % of total                 Thousands      % of total     2019/20)
                               (nominal                                  (nominal
                                Rands)                                    Rands)                                      (%)

    Child Support Grant           240          9 381         68.08          440         12 777         71.00         36.20
    Older Persons Grant*         1 010         2 491         18.08         1 860         3 655         20.31         46.73
    Disability Grant             1 010         1 299          9.43         1 860         1 058          5.88         -18.55
    Foster Care Grant             680           489           3.55         1 040          350           1.94         -28.43
    Care Dependency Grant        1 010          119           0.86         1 860          155           0.86         30.25

    Total                                     13 779         100.00                     17 996         100.00        30.60
Authors’ own calculations. Source: National Treasury (2011, 2020).
Notes: [1] * Includes War Veterans' Grant recipients whose grant amounts to R1 880 in 2019/20 and R1 030 in 2009/2010, for
the 2019/20 financial year the monthly amount here refers to that for individuals between 60 and 75 years of age, and the
Older Persons Grant is R1 880 for individuals over 75 years of age. [2] Recipients per grant may not sum to total recipients due
to rounding. [3] Grant-in-Aid and Social Relief of Distress grant recipients are excluded here.

Social insurance in South Africa’s social protection system is primarily used to protect those in formal
sector employment, and therefore many remain outside this part of the system (Van der Berg, 1997;
Woolard, 2011). Seekings and Matisonn (2012) describe it as a semi-social insurance system owing to
the fact that only former contributors are eligible for benefits in the short-term and therefore few
chronically poor individuals are covered. There are three primary social insurance measures: the UIF,
the Road Accident Fund (RAF), and the Compensation Fund. With the amended Unemployment
Insurance Act of 2001, the latest version of the UIF came into effect in 2002 and seeks to provide short-
term protection against unemployment, illness, maternity, the adoption of a child, and death -
conditional on prior formal employment. The RAF was introduced in 1996 and seeks to provide
compensation for the loss of earnings, general damages, injuries, or death and funeral costs arising
from accidents involving motor vehicles on South African roads. Given its mandatory nature, the Fund
operates like a universal social insurance scheme (Moore and Seekings, 2019). Finally, the
Compensation Fund was introduced in 1993 with the promulgation of the Compensation for
Occupation Injuries and Diseases Act, replacing the former racially orientated WCA of 1941. South
Africa’s social insurance system also includes a regulated, voluntary component, consisting of private
medical and retirement schemes for those who can afford it, as well as the Government Employees
Pension Fund – a defined benefit pension fund established in 1996 and mandatory to all government
employees.

       2.2. COVID-19-induced changes to South African social assistance
In the early days of the onset of the COVID-19 crisis, initial economic relief measures by the South
African government primarily focused on tax-registered individuals and firms in the formal sector.
However, there were also several vocal calls for the expansion of social assistance to support low-
income households (Bhorat et al., 2020). Specifically, these calls largely advocated for supplementing
the CSG on the intensive margin (i.e. increasing the amount of an existing cash transfer). Analysis using
pre-crisis survey data showed that in the absence of such targeted interventions, the extreme poverty
rate amongst vulnerable households may almost triple. 5 To support these households, on 21 April 2020
President Ramaphosa announced an expansion of social assistance on both the intensive and extensive

5https://theconversation.com/south-africa-can-and-should-top-up-child-support-grants-to-avoid-a-humanitarian-crisis-
135222.

                                                               4
DPRU WP 202008
margins: all existing social grants will be increased for six months and a special COVID-19 Social Relief
of Distress (SRD) grant will be introduced for the same period for individuals who are unemployed and
neither receiving any income nor any other social grant or support from the UIF. Citizens, permanent
residents, and refugees are all eligible for this latter transfer which was later expanded to include
asylum-seekers and special permit holders. 6 As of 30 June 2020, 3.2 million individuals had been
approved and 2.5 million paid. 7
These adaptions to the grant system were, however, heterogenous by grant type. As indicated in Table
2, every existing grant with the exception of the CSG was increased on the intensive margin by R250
per month (equivalent to a relative increase of 13% - 24%) from May to October 2020. On the other
hand, the CSG was increased by R300 per grant for May (a nearly 70% increase attributable to a
relatively low pre-COVID-19 level of R440) but R500 per caregiver (regardless of their number of eligible
children) from June onwards. A simple analysis provided in Figure 2 shows that the benefit of this
chosen policy varies by a primary caregiver’s number of eligible children. Although caregivers with one
child will benefit relatively more from June relative to May, those with two or more children benefit
relatively more in May relative to June onwards. Compared to following initial calls to increase only the
CSG, this decision by the Department of Social Development was presumably taken partly because it
was accompanied by the introduction of the new COVID-19 SRD grant as well as increases to all other
existing grants. By simulation, Bhorat et al. (2020) find that although the chosen social assistance policy
appears to cost more and is slightly less progressive relative to only increasing the CSG by R500, it brings
many previously unreached households into the system partly through the introduction of the COVID-
19 SRD grant and ultimately leads to the largest reduction in poverty over six months. Bassier et al.
(2020) find that the expansion of the CSG is complimentary to the introduction of the COVID-19 SRD
grant, and that “this combined policy intervention performs best out of the options considered”.
Table 2: Changes to South Africa’s social grants, May to October 2020.
Pre-COVID- Absolute (Rands per grant per month, COVID-19 amount (Rands per
19 amount unless indicated otherwise) and relative (%) grant per month, unless
Grant (Rands per increase indicated otherwise)
grant per May June-October May June-October
month) 2020 2020 2020 2020
Older Persons Grant* 1 860 250 (13.44%) 250 (13.44%) 2 110 2 110
War Veterans' Grant 1 880 250 (13.30%) 250 (13.30%) 2 130 2 130
Disability Grant 1 860 250 (13.44%) 250 (13.44%) 2 110 2 110
Care Dependency Grant 1 860 250 (13.44%) 250 (13.44%) 2 110 2 110
Foster Child Grant 1 040 250 (24.04%) 250 (24.04%) 1 290 1 290
440 per grant + 500
Child Support Grant 440 300 (68.18%) 500 per caregiver 740
per caregiver
COVID-19 SRD Grant NA NA NA 350 350
Authors’ own compilation based on Government Gazette No. 43300 dated 9 May 2020.
Notes: [1] * The grant amount of R1 860 is for individuals aged 60 to 75 years, which increases to R1 880 for individuals
older than 75 years of age.
6 https://www.iol.co.za/sundayindependent/news/sassa-to-spend-r700m-providing-refugees-with-the-r350-covid-19-relief-
grant-49703342.
7 See South African Social Security Agency’s (SASSA) Media Release dated 30 June 2020:
https://www.sassa.gov.za/newsroom/Documents/SASSA%20Sends%20Lifeline%20to%20Rejected%20COVID-
19%20Grant%20Applicants.pdf.
5COVID-19, social protection, and the labour market in South Africa:
Are social grants being targeted at the most vulnerable?
Figure 2: Variation in total monthly amount of the Child Support Grant received by number of eligible
children, May to October 2020.
Authors’ own calculations based on Government Gazette No. 43300 dated 9 May 2020.
3. Data and methodology
3.1. The National Income Dynamics Study: Coronavirus Rapid Mobile Survey
The National Income Dynamics Study: Coronavirus Rapid Mobile Survey (NIDS-CRAM) is a nationally
representative individual-level panel survey of approximately 7 000 South African adults, intended to
be conducted telephonically through six monthly waves from May 2020 to October 2020. Conducted
as a collaborative research project by several South African universities, the aim of the survey is to
provide monthly, nationally representative data on key socioeconomic outcomes in South Africa during
the COVID-19 pandemic and national lockdown. The survey forms part of a broader study, which this
paper forms part of, which aims to inform policymaking using rapid, reliable research in the context of
the COVID-19 pandemic. The survey instrument includes a wide array of questions on income and
employment, household welfare, and COVID-19-related knowledge and behaviour. Each participant of
the NIDS-CRAM receives a ZAR20 airtime voucher per wave for participating. In order to be nationally
representative while simultaneously adhering to social distancing regulations, the mobile phone
numbers of existing sample participants needed to be obtained. In this light, the NIDS-CRAM sample
consists of a subsample of individuals from households captured in the fifth wave of the National
Income Dynamics Study (NIDS) conducted in 2017. The NIDS is a nationally representative, longitudinal,
face-to-face household survey conducted approximately every two years from 2008 to 2017 and has
followed the same 28 000 South African individuals over five waves.
This study utilises data from the first wave of the NIDS-CRAM which was conducted from 7 May to 27
June 2020 in the preferred South African official language of the respondent. 8 The sample frame of the
NIDS-CRAM consists of NIDS Wave 5 individuals resident in South Africa aged 18 years or older at the
8 With the exception of Ndebele, the questionnaire was translated into 10 of South Africa’s 11 official languages.
6DPRU WP 202008
time of fieldwork in April 2020. 9 The sample was drawn using a stratified sampling design, but with
“batch sampling” and was stratified by age, income decile, geographic area, race, and sex (totalling 99
strata). The “batch sampling” approach simply means that sampled individuals were sent to the
fieldwork team in batches, and was designed to allow for flexibility in adjusting the sampling rate for
each stratum as more information about stratum response rates was obtained as fieldwork progressed.
Interested readers are referred to Ingle et al. (2020) for more details regarding the survey’s sampling
design. Although NIDS-CRAM is a follow-up survey of NIDS respondents, there are several distinct
differences between the two surveys. NIDS-CRAM uses a much shorter questionnaire (and is thus less
detailed) which takes on average 20 minutes to administer, and is conducted via a computer assisted
telephonic interview (CATI) survey due to the infeasibility of face-to-face surveys under lockdown
regulations. NIDS is an individual-level, household-based survey whereas the NIDS-CRAM is an
individual-based survey, which presents complications for deriving household-level variables from
individual-level variables. In the sampling method, no restriction was made to selecting just one
individual per NIDS Wave 5 household. Furthermore, it is important to note that because the NIDS-
CRAM sample is drawn from a representative sample of individuals in NIDS Wave 5 (conducted in 2017),
the weighted estimates are not necessarily representative of the South African adult population in
2020. Rather, it is representative of the outcomes in 2020 of those aged 15 years and older in 2017
who were followed up 3 years later. Unless indicated otherwise, all estimates for all periods are
weighted using the relevant sampling design weights and account for the NIDS-CRAM complex survey
design to address non-response and ensure representivity.
3.2. Constructing variables for employment, household income, earnings,
and grant receipt
In the NIDS-CRAM Wave 1 questionnaire, several items are included to gauge a sampled individual’s
labour market status in both February and April 2020. In particular, for both reference months
individuals were asked (i) “Did you have any kind of job?”, (ii) “Did you work for any profit or pay, even
if just for an hour or a small amount?”, and (iii) “Did you do any kind of business such as selling things -
big or small - even if only for one hour?”. How researchers choose to use the responses to these items
to categorise individuals as either employed, strictly unemployed, discouraged, and economically
inactive may have implications for their findings. For instance, although most of the above items require
a response of either “Yes” or “No”, item (i) also provides the option “No, I’m retired” for February and
item (iii) the option of “No, I’m employed” for both February and April. The latter is of particular concern
as it may have at least three interpretations. First, these individuals may simply be regarded as
employed. Second, this group could be treated as employed but conditional on reporting non-
zero/missing working hours or earnings. Third, given that many individuals who responded with this
option also report zero weekly working hours, the response may be interpreted as measurement error
(i.e. people meant to say ‘no I am not employed’) and are therefore regarded as not employed. We
adopt the first approach to categorise an individual’s employment status for both February and April,
as described in Ingle et al. (2020). Our code for generating employment status is equivalent to that in
the NIDS-CRAM patch code (V1.0.1). In future work on the NIDS-CRAM data, researchers ought to be
explicit on their chosen approach given the differences in employment estimates that may arise. For
instance, researchers may choose to account for individuals who report being employed in a given
month but working zero hours and/or receiving zero earnings. In the context of the national lockdown,
this is an important group to consider.
9Sample members in the NIDS could be Continuing Sample Members (CSMs) or Temporary Sample Members (TSMs). CSMs
were interviewed in every wave of the NIDS, whereas TSMs were interviewed in a given wave only if they were a co-resident
of a CSM.
7COVID-19, social protection, and the labour market in South Africa:
Are social grants being targeted at the most vulnerable?
In this study, we also adjusted the raw, post-tax, monthly household income and earnings data to
account for bracket responses and correct for outliers. As in most survey datasets, such raw income
data ought not to be used in analysis for several reasons. First, several individuals only reported bracket
or category responses (for example, earning between R20 000 and R25 000 per month). Second, some
individuals reported earning zero income, while others did not report any income information at all.
Third, the earnings data is contaminated by outliers. Using such data before addressing these issues
will result in biased estimates, given that there may be selection into responding with bracket
information or refusing to provide any income information. We adopt several statistical techniques to
address these issues. First, individuals who responded with brackets are assigned the mean earnings
value reported within the bracket for those who gave a numerical answer. Second, outlier values for
household income and earnings are identified and coded as missing by using the “extreme studentised
regression residuals" approach as advised by Wittenberg (2017). 10 We further trim the lower and
upper-ends of the relevant distributions by coding values less than the first percentile and in excess of
the 99th percentile as missing. All figures are converted to a monthly frequency. These adjustments
resulted in 47 (74) values being coded as missing or 1.1% (1.1%) of the sample with non-missing April
household income (February earnings) values. Similarly, just 64 April earnings values (or 1.0%) were
coded as missing. If the April earnings exceeded household income or if household income values were
missing, we replaced April household income values with non-zero and non-missing April individual
earnings values. Furthermore, if an individual had missing or zero household income data but reported
individual or household grant receipt, we replaced household income with grant income in addition to
April earnings if any. 11 Given that we are adjusting household income in April, we use the pre-expansion
social grant amounts as in Table 2. Because of this, we do not include receipt of the COVID-19 SRD
Grant in this adjustment given that it was only distributed from May. 12 Individuals were only asked
about their household income in April and not February. All income and earnings data were deflated to
February 2020 Rands. Lastly, two things should be noted. First, the extent to which earnings estimates
between February and April are comparable is questionable given the differences in the way the
questions were asked. Second, there may be an endogeneity issue given that we only have household
income data for April. For instance, employment loss may lead to an individual being categorised in a
lower household income decile, rather than those in lower household income deciles are more likely
to experiences employment loss. Due to data unavailability, we are unable to address this issue but
emphasise the reader to keep this in mind throughout the paper.
Wave 1 of the NIDS-CRAM contains relatively detailed information regarding personal grant receipt
compared to household-level grant receipt. Regarding the former, respondents were asked “Do you
receive any kind of government grant?” and if they responded affirmatively, they indicated which
specific one(s). Using this item, we could easily identify personal grant receipt for any grant, the CSG,
the OPG, the COVID-19 SRD Grant, and several other grants as indicated in Figure 1. However,
conditional on reporting receipt, there is no item which allows one to quantify how many grants an
individual personally receives. This is of particular concern for the CSG where primary caregivers receive
one or several grants on behalf of their child(ren). This has important implications for any researcher
interested in estimating the total number of grants distributed in the country. On the other hand, at
the household-level respondents were asked “Does anyone in the household receive a child support
10 This is done by estimating a Mincerian-style regression of the logarithm of either household income or earnings on a vector
of observable covariates and identifying outliers as those observations with absolute residuals in excess of 4. We choose not
to impute values for existing missing household income and earnings values and leave this for future analysis.
11 Given that household-level grant receipt questions only related to the CSG and OPG, we could only adjust for these grants
on the household-level.
12 Unfortunately, although we can adjust household income for each type of grant receipt, we cannot tell if an individual
received more than grant of a given type (for instance, a caregiver may receive more than one CSG on behalf of eligible
children). After these adjustments, about 28% of the sample have missing household income data. Future research ought to
consider the implications of missing income and earnings data on their analysis. One alternative would be to impute missing
values based on a vector of observable characteristics.
8DPRU WP 202008
grant?” and “How many child support grants does this household receive?”, and similarly for the OPG.
Unfortunately, these questions were only asked with respect to the CSG and OPG presumably owing to
the time constraints of a telephonic survey. As such, in our analysis we focus on personal receipt of
either (i) any grant, (ii) the CSG, (iii) the OPG, and (iv) the COVID-19 SRD Grant, and household receipt
of (i) the CSG and (ii) the OPG. It should however be noted that grant receipt in the NIDS-CRAM Wave
1 data appears to be significantly underestimated relative to other information sources. For instance,
we estimate that there are about 2 million individuals (not individual grants or beneficiaries) who report
personally receiving the CSG in the data; however, administrative data from the South African Social
Security Agency (SASSA) suggests this number is closer to 7 million recipients who receive the grant on
behalf of more than 13 million beneficiaries. On the other hand, OPG receipt seems about correct at
an estimated 3 million recipients in the data. This should be noted throughout any analysis of the Wave
1 data.
3.3. A note on representativity
Despite the adjustments we make to address missing household income values and minimise any
possible selection bias, we believe that our estimates come with important caveats due to unavoidable
imprecision which render them still approximations. This implies that our results may either over- or
under-estimate the true realised impact of the pandemic and lockdown across the income distribution.
First, we reiterate that the weighted NIDS-CRAM estimates are not representative of the South African
adult population in 2020 because the sample was drawn from a representative sample of individuals in
NIDS Wave 5 conducted in 2017, who were themselves followed up since 2008. Although post-
stratification weights make the NIDS Wave 5 sample broadly representative of the South African
population in 2017, the weighted NIDS-CRAM estimates should be interpreted as being representative
of the 2020 outcomes of those aged 15 years and older in 2017 who were followed up 3 years later.
Moreover, it is not unusual to observe disparities between estimates of the NIDS and other household
surveys such as the QLFS. This is because NIDS was always designed to be a panel survey representative
of the population in 2008, and as such, factors such as selective migration from the sample over time
are not accounted for. Since the NIDS-CRAM sample is drawn from the NIDS Wave 5 sample, this
characteristic will continue into NIDS-CRAM. For instance, the much larger QLFS sample of more than
60 000 individuals is periodically re-drawn to ensure that it remains nationally representative and
therefore, it is probably a more reliable source of information for the South African labour market. As
such, researchers need to be cautious about generalizing findings from the NIDS-CRAM to the country
at large.
Regarding household income, NIDS-CRAM did not survey all individuals who are co-resident with the
original sample member as in previous waves of the NIDS, we have to rely on a one-shot household
income question as opposed to deriving household income from aggregating individual item responses.
Jain et al. (2020) show that in the NIDS Wave 5 data, the distribution of one-shot household income is
lower than the distribution of derived household income. Moreover, as discussed in Section 3.2,
household income in the NIDS-CRAM was only asked for April once lockdown had commenced, and not
February. Given that NID-CRAM is an individual-based survey, the household income question was also
asked of every NIDS-CRAM respondent as opposed to the eldest woman or household member most
knowledgeable about household affairs as in the NIDS. Finally, a significant proportion of respondents
do not report household income information (28% after our adjustments), which could lead to our
estimates being either upwardly or downwardly biased. We make adjustments to household income as
described in Section 3.2 to address some of these concerns; however, we emphasise that the reader
keeps these concerns in mind throughout the paper.
There remain, however, important advantages of the NIDS-CRAM data that make it incredibly valuable
for understanding the current context in South Africa. First, because the survey is designed as a panel,
9COVID-19, social protection, and the labour market in South Africa:
Are social grants being targeted at the most vulnerable?
it can provide a substantial amount of information about the dynamics of sampled individuals as the
pandemic and lockdown unfolds. At the time of writing there is no comparable existing dataset which
can be used to analyse these dynamics. Second, despite unavoidable comparability issues with the
NIDS-CRAM and other surveys, internal validity and comparisons over time for the sample are not issues
of concern. Many of the operational challenges experienced by the NIDS-CRAM survey will almost
certainly be experienced by other surveys being conducted during this period. Third, unlike many other
rapid mobile surveys conducted to analyse the impacts of COVID-19, the panel nature of the NIDS-
CRAM means that researchers can check under- or over-reporting of key variables by linking
respondents back to their records in earlier NIDS waves.
4. Descriptive statistics
As a starting point, it is useful to analyse variation in mean real per capita household income across the
income distribution. Figure 3 presents the relevant distribution for household per capita income in April
2020 – the only reference period for which household income is available in the NIDS-CRAM Wave 1
data. 13 The distribution makes it clear why social grants are needed as an important source of income
relief amongst low-income households. Assuming an equal distribution of household income amongst
household members, 14 just under R270 per person per month is available for the average individual
who lives in the poorest half of households, in stark contrast to those who live in the richest 10% of
households who receive about 30 times that amount, or R8 367 per person per month. It should be
noted that even individuals who live in high decile households exhibit relatively low per capita
household income levels in South Africa. For instance, household income is just over R1 300 per person
per month in households in decile 8 – well below the national minimum wage. The figure then
emphasises the importance of social grants as an income source for individuals in lower-income
households.
13 Relative to household income data from other sources prior to the pandemic-induced lockdown, the distribution here
appears relatively skewed to the bottom-end. This is possibly attributable to (1) under-sampling of individuals who live in
relatively rich households, (2) endogeneity of household income in April to the COVID-19 and national lockdown shock to
incomes, and/or (3) the fact that about 28% of individuals do not report household income values in the NIDS-CRAM Wave 1
data.
14 The data prohibits us from exploring intra-household distributions of household income, so an average is assumed.
10DPRU WP 202008
Figure 3: Distribution of real per capita household income by real household per capita income decile,
April 2020
Authors’ own calculations. Source: NIDS-CRAM Wave 1.
Notes: [1] All estimates weighted using relevant survey sampling weights. [2] Per capita household income calculated by dividing total
household income by the total number of household members. [3] Real household income is measured monthly after taking tax and deductions
into account and is deflated to February 2020 Rands.
The distribution in Figure 3, however, includes income attributable to social grants. It is worth
investigating to what extent social grants themselves increase household incomes and how this varies
for households in different parts of the household income distribution. Our analysis of such a simulation
is presented in Figure 4 which shows variation in how much household income per capita changes when
income from social grants are excluded and included from income in April. Due to data availability in
the NIDS-CRAM Wave 1 as discussed in Section 3.2, we are only able to conduct such a simulation at
the household-level for two grants: the CSG and the OPG. The figure shows that receipt of the CSG or
OPG is relatively pro-poor: relative increases in per capita household income are substantially higher
for lower-income households in comparison to higher-income households. Receiving R440 per CSG
increases household income per person by about 63% for those in the poorest 30% of households, in
contrast to the less than 3% increase for those in the richest 30% of households. OPG receipt appears
slightly less pro-poor than the CSG, however this is likely attributable to the fact that the amount
received per OPG is more than four times greater that of the CSG which pushes households up the
distribution: R1 860 or R1 880 depending on recipient age. Regardless, receipt still increases the
incomes of lower-income households substantially more than higher-income households in a relative
sense. The per capita household incomes of the poorest half of household increases by more than 55%,
whereas that of the richest 30% increases by just over 11%.
11COVID-19, social protection, and the labour market in South Africa:
Are social grants being targeted at the most vulnerable?
Figure 4: Relative increase in per capita household income attributable to Child Support Grant or
Older Persons Grant receipt, by real per capita household income decile
Authors’ own calculations. Source: NIDS-CRAM Wave 1.
Notes: [1] All estimates weighted using relevant survey sampling weights. [2] Per capita household income calculated by dividing total
household income by the total number of household members. [3] Real household income is measured monthly after taking tax and deductions
into account and is deflated to February 2020 Rands. [4] Relative increase in per capita household income calculated as the percentage
difference between real per capita household income with and without income from the total number of CSG’s or OPG’s received by the
household. [5] April grant amounts used, i.e. a CSG amount of R440 and an OPG amount of R1 860 or R1 880 depending on the reporting
individual’s age.
Figure 5 presents the distributions of grants received personally and on the household level (i.e.
individuals who co-reside with at least one grant recipient) across the household income distribution.
We estimate that about nearly 5.5 million individuals (or 93% of grant recipients in the sample) who
personally receive any grant live in the poorest 80% of households. Again, the CSG appears relatively
pro-poor with about two thirds (66.28%) of recipients living in the poorest half of all households. The
distribution of the OPG is also progressive but not as much as the CSG, with over three in every five
(61.63% or nearly 1.9 million individuals) OPG recipients living in the poorest half of households. The
highest absolute number of OPG recipients live in decile 4 households, but again this is likely not the
result of poor targeting but rather than the high value of the grant pushes individuals up the household
income distribution. Finally, we estimate that just over 91 000 individuals report personally receiving
the COVID-19 SRD Grant. However, we are cautious of this estimate given that it is estimated from a
sample of just 44 observations. The estimate also does not align with official statements from SASSA,
who report 2.5 million paid recipients as of 30 June 2020.
12DPRU WP 202008
Figure 5: Distribution of social grants by personal verses household receipt and grant type across the
household income distribution
Authors’ own calculations. Source: NIDS-CRAM Wave 1.
Notes: [1] All estimates weighted using relevant survey sampling weights. [2] Real household income is measured monthly after taking tax and
deductions into account and is deflated to February 2020 Rands.
On the other hand, our estimates for household-level receipt are substantially higher. About 20 million
individuals live in a household where at least one member receives the CSG or OPG (13 million and 8
million respectively). Three in every four individuals (75.92%) who co-reside with a CSG recipient live in
the poorest 70% of households, as opposed to just 5% of individuals in the richest 10% of households.
Household-level OPG receipt yields similar estimates, although the distribution is more centred. Nearly
65% (or more than 5 million) of individuals who co-reside with an OPG recipient live in households that
are between deciles 3 and 7.
The sources of these households’ incomes vary significantly across the distribution. Figure 6 presents a
stacked bar graph highlighting how the composition of household income varied across the household
income distribution prior to the commencement of South Africa’s national lockdown in February. In the
survey, individuals could report up to three different sources of household income. For brevity, the first
reported source is used here and is assumed the main source, although the distribution looks similar
when others are used. The figure broadly suggests that prior to lockdown, in line with the literature
discussed earlier, social grants were relatively well-targeted to poor households in South Africa.
Expectedly, labour market income (that from employment and business) as a percentage of total
household income generally increases with household income. Just 32% of individuals who live in the
poorest 50% of households report income from employment or business as a source of their
household’s total income. This is in contrast to 61% of individuals who live in decile 7 and 8 households,
and the majority (83%) of those who live in the richest 20% of households. On the other hand, social
grants contribute much more to total household income for poorer households relative to richer
households. Nearly half (47%) of individuals who live in the poorest 50% of households report social
grants as a source of household income, in sharp contrast to 6% of individuals in the richest 20% of
households. Collectively, income from social grants and the labour market account for the majority of
household income across the distribution with remaining income sourcing from money from friends or
family or alternative sources.
13COVID-19, social protection, and the labour market in South Africa:
Are social grants being targeted at the most vulnerable?
Figure 6: Pre-lockdown sources of household income across the real household income distribution
Authors’ own calculations. Source: NIDS-CRAM Wave 1.
Notes: [1] All estimates weighted using relevant survey sampling weights. [2] Based on survey question “If you think of the time in February,
which of these were sources of income for this household?”. [3] Individuals could report up to three different sources of income. The first
reported source is used here. [4] Real household income is measured monthly after taking tax and deductions into account and is deflated to
February 2020 Rands.
The composition of household income across the income distribution – particularly the contribution of
income from the labour market - certainly wasn’t expected to persist once South Africa’s national
lockdown commenced at the end of March 2020. More specifically, we observe significant variation in
the percentage of individuals who report reductions in income from labour market income and social
grants as sources of household income in April 2020 across the income distribution. Overall, nearly a
third (31.2%) of individuals reported experiencing a reduction in labour market income as a source of
their household’s income, whereas just 8.3% reported an equivalent reduction with respect to social
grants. Although this latter reduction is possibly attributable to inter-household migration prior to the
commencement of the national lockdown, these changes in household income were not homogenous
across the distribution. Figure 7 presents estimates of the percentage of individuals reporting
reductions in labour market and social grant income as sources of household income across the
household income distribution. Two in every five (39.8%) individuals in the richest 40% of households
reported a reduction in labour market income as a source of household income. Similarly, one in every
four (24.9%) individuals in the poorest half of households report such a reduction – a smaller albeit still
significant magnitude. Considering social grants, it is concerning that 15% of individuals in the middle
50% of households (deciles 3 to 7) report reductions in social grant income as a household income
source.
14You can also read