LESS INCOME FOR MORE HOURS OF WORK: BARRIERS TO WORK FOR INCOME ASSISTANCE RECIPIENTS IN B.C.
←
→
Page content transcription
If your browser does not render page correctly, please read the page content below
PUBLICATIONS
SPP Briefing Paper

Volume 13:16			                     July 2020

LESS INCOME FOR MORE HOURS OF
WORK: BARRIERS TO WORK FOR
INCOME ASSISTANCE RECIPIENTS IN B.C.

Gillian Petit, Craig Scott, Blake Gallacher, Jennifer Zwicker
and Lindsay Tedds

SUMMARY
Individuals accept additional paid work, in terms of salary increase or more
hours, with the expectation they will be financially better off than before.
Unfortunately, for recipients of Income Assistance in the province of British
Columbia, additional hours of employment or an increase in wages, such as an
increase in minimum wage, in some circumstances may actually take money
out of their pocket. This is due to the design of Income Assistance and its
unintended interactions with other income and social support programs and
the tax system. In this paper, we illustrate cases where B.C. residents receiving
Disability Assistance or Temporary Assistance (the two main programs that
comprise Income Assistance in B.C.) have less after-tax income after working
additional hours of employment.

In modelling after-tax income for recipients of Disability Assistance and
Temporary Assistance as they increase their hours of paid work, we detail
when and how additional income earned from paid work affects not only their
income assistance levels, but also their eligibility and receipt of some general
and health-related supplemental benefits. We show that, as Income Assistance
recipients allocate more hours to paid work, the reductions in total after-tax
income can be sizable. For example, if a single person receiving Disability
Assistance (earning a wage of approximately $15 per hour) increases his or her
paid work hours from 16 hours a week to 35 hours a week, it reduces his or her
total after-tax income by $1,500 a year. This loss is not just limited to a decline
in after-tax income. Access to some general and health-related supplemental
benefits provided to Income Assistance recipients may also be lost from

http://dx.doi.org/10.11575/sppp.v13i0.69731                  w w w. policyschool.ca
working these additional hours.1 By addressing these program-design elements of the
    current Income Assistance program, the B.C. government can improve the well-being
    of those receiving Income Assistance. Reforms may also decrease expenditures on
    Income Assistance in the long-run. Allowing recipients to increase their hours of work
    or earnings within the year, as their situation permits, without the risk of having their
    benefits reduced, may actually help more people transition from Income Assistance
    towards permanent employment, thus breaking the cycle of poverty and increasing
    social inclusion.

    Many recipients of Income Assistance already face numerous barriers to paid work, other
    than those analyzed here, as the result of disability-related employment constraints.
    After-tax income reductions like those described here create another barrier to
    employment for these populations that the B.C. government can and should address.
    Canada’s commitment to improving social inclusion for specific populations, such as
    persons with disabilities, heighten the importance of identifying inequalities and poverty
    traps within our income assistance system. Institutional barriers to inclusive activities
    such as employment must be removed to meet these commitments.

    1
        General and health supplemental benefits include both in-kind programs and cash transfers. For example,
        an available crisis supplement provides a cash transfer to income assistance recipients in the case of an
        unexpected emergency. A medical equipment supplement provides medically necessary equipment such as
        wheelchairs. Not all of these supplements are lost upon increased earned income, but some are. More details
        are provided below.

1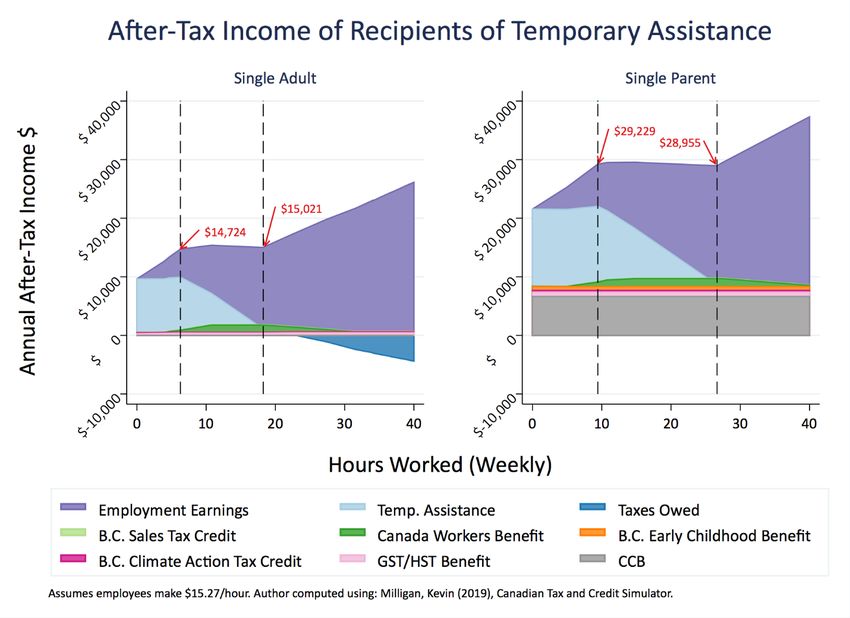
INTRODUCTION
    Canadians who are willing and able to enter the workforce (or who wish to accept an
    increase in their hours worked or wage rate) should be rewarded with an increase in
    after-tax income. 2 However, systematic problems in income-assistance program design,
    combined with a patchwork of other income and social support programs, may create
    an environment where this does not hold true for some income assistance recipients.
    This paper shows that income assistance and social support programs intended to
    provide support for some of the most vulnerable Canadians may unintentionally decrease
    after-tax income received by those who increase their earnings from paid employment
    through an increase in their hours worked. This effect occurs despite the intent of these
    programs to help support recipients’ transition to sustainable employment. 3 Program
    designs that create barriers to employment are problematic because individuals cannot
    unilaterally improve their financial circumstances, an important step towards building
    financial resiliency that will help them break the cycle of poverty. This issue increases the
    likelihood that income assistance recipients will not only remain in income poverty, but
    that they will also experience social exclusion.

    Social exclusion is defined as the process of discouraging participation in society,
    particularly for people who are disadvantaged, through the creation of barriers
    to opportunities, obstacles to resources, and a lack of voice and respect of rights
    (United Nations Department of Economic and Social Affairs 2016, 18). In May 2019,
    the government of Canada passed Bill C-81, the Accessible Canada Act, to improve
    communities, workplaces and services so all Canadians can equally participate in society
    (Government of Canada 2019a). Equal participation in society includes removing barriers
    to paid employment. Through this policy, federal and provincial governments are
    committed to safeguarding and promoting the realization of equal participation through
    the legislation, programs and services they provide. Promoting equal participation in paid
    work is part of this commitment.

    Some groups are at a higher risk of social exclusion. Persons with disabilities (PWDs) face
    barriers to participation in society, including a lack of paid employment opportunities.
    Employment barriers PWDs face include individual skills and training, employer
    receptivity, awareness and understanding of disability, and system-level program-design
    barriers (Dunn et al. 2018; Khayatzadeh-Mahani et al. 2019). These issues discourage
    recipients from seeking (or increasing) employment, which offers potentially valuable
    skills. While there is a clear commitment to enhancing social inclusion in Canada,
    institutions working to achieve this objective may unintentionally create financial
    barriers through systematic program-design problems. In particular, PWDs experience a
    higher likelihood of being on income assistance,4 yet most provincial income assistance

    2
        After-tax income includes both after-tax earned income (i.e., from paid work) plus cash transfers/benefits
        from government programs.
    3
        For instance, see the website for the B.C. income assistance program, which states “The BC Employment and
        Assistance program assists British Columbians by helping people move from income assistance to sustainable
        employment” (Government of BC 2019a).
    4
        For example, in 2019 in B.C. people with some form of disability make up just under 71 per cent of the income
        assistance caseloads.

2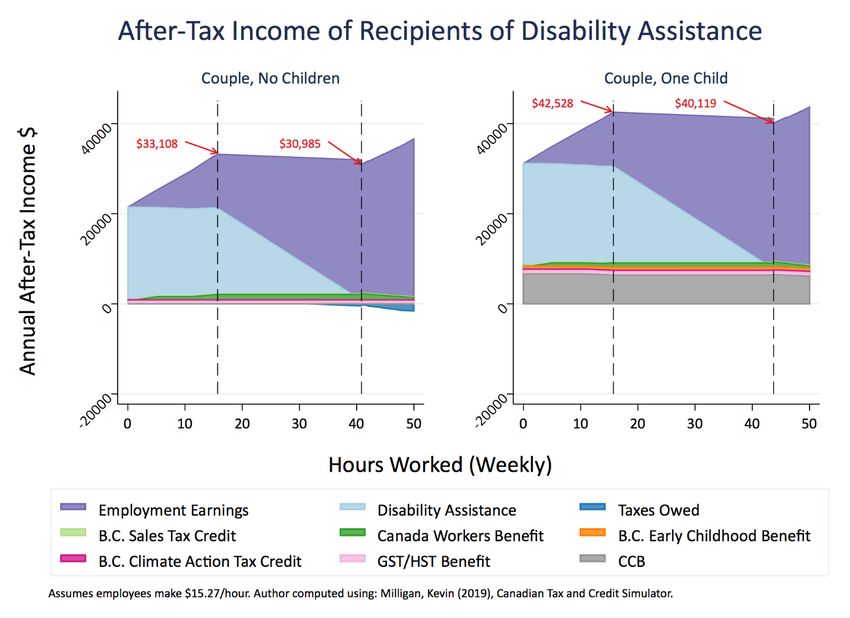
programs are designed such that income assistance is reduced at a very fast rate with
    increases in paid work. As a result, considering how income assistance for PWDs interacts
    with paid work and social inclusion is an important policy issue. This brief focuses on such
    program-design issues and how they can erect additional barriers to social inclusion.

    As we will show, the case for reforming income assistance goes beyond just removing
    financial barriers for recipients. There is also a compelling economic case to reform social
    assistance along with other programs. The World Economic Forum has described PWD
    as a largely “untapped workforce” and argued that employing a more diverse workforce,
    including PWD, can have a positive impact on the bottom line of employers (Jerdee 2019;
    Sonne 2019). Furthermore, social inclusion for PWDs through employment promotes
    recovery and rehabilitation, leads to better health outcomes (e.g., fewer hospital visits,
    improved mental health), and promotes full participation in society and independence
    (Waddell and Burton 2006; Canadian Association for Community Living 2011).

    Income assistance programs vary across Canada. This variability is mainly from
    differences in provinces, which are responsible for designing and providing provincial-
    level income assistance programs; however, federal and municipal programs introduce
    additional complexity. In this paper, we focus on the Income Assistance program in B.C.
    to demonstrate how program design and policy interactions with income assistance
    programs create barriers to work. We recognize that this issue is not unique to B.C., but
    we chose to study this province because its current income assistance programs are
    currently under review. 5

    BACKGROUND
    Provincial income assistance programs are last-resort income support programs; they
    are intended for those who have exhausted all other means of financial support. As part
    of B.C.’s Employment and Assistance program, the province operates Income Assistance
    (IA). IA “assists British Columbians by helping people move from Income Assistance to
    sustainable employment, and by providing income assistance to those who are unable
    to fully participate in the workplace” (Government of British Columbia 2019a). These
    programs are an important component of the Canadian social safety net.

    IA consists of two programs: Temporary Assistance (TA) and Disability Assistance (DA).
    The eligibility requirements for DA and TA are different. Most TA recipients are expected
    to return to work and, as such, are required to actively search for paid work and report
    on their progress in a monthly report. Some TA recipients are exempted from the work
    requirements. These include TA recipients who are temporarily excused from work (e.g.,
    single parents with a child under three years old or a child who has special needs, or
    older adults 65 years of age or older), persons with persistent multiple barriers (PPMB) to
    work, persons who are expected to work but who have a medical conditions, and persons
    with disabilities who are waiting to have their designation as a person with disabilities
    approved so they can be moved to the DA program. Therefore, some recipients of TA
    are also people with some form of disabilities. To be eligible for DA, clients must, along

    5
        See https://engage.gov.bc.ca/bcpovertyreduction/basic-income/ for a description of the current review.

3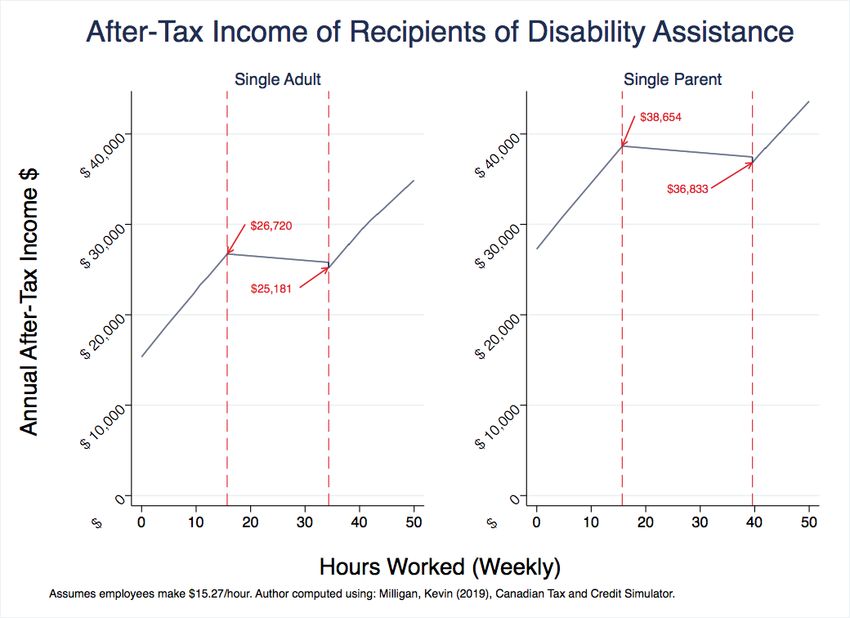
with meeting the financial requirements (whose thresholds are higher than for TA), be
    designated as a PWD. Recipients of DA face different work requirements. Recipients
    of DA are not expected to secure paid work; however, employment endeavors are
    supported (Government of British Columbia 2019a). The majority of IA recipients are in
    the DA program. In June 2019, there were 153,286 IA cases, of which 71 per cent were
    receiving DA and 29 per cent were receiving TA (Government of British Columbia 2019b).
    The number of cases that include a PWD is likely higher as it is possible that some of the
    TA cases are persons with disabilities waiting to be deemed eligible for DA or people with
    persistent multiple barriers.

    To support IA recipients’ transition into paid employment, both the TA and DA programs
    have an earnings exemption based on net earned income.6 As of April 2019, the earnings
    exemption for a single adult DA recipient is $12,000 annually (which resets each calendar
    year) and the earnings exemption for a single adult TA recipient is $400 per month.7 For
    net earned income above the earnings exemption, TA and DA benefits are phased out
    on a dollar-for-dollar or one-for-one basis. That is, as net earned income increases by
    one dollar over the earnings exemption, TA and DA benefits decrease by one dollar. This
    reduction has an important consequence. It means that there is a 100-per-cent marginal
    effective tax on income earned over the earnings exemption. 8 As we will show, when
    combined with the phase-out rates of other tax and transfer programs, this marginal
    effective tax rate can rise to over 100 per cent, resulting in a decline of after-tax income.

    METHODOLOGY
    To understand how the design of IA creates work disincentives, our research question
    for this study was “how does after-tax income change for recipients of B.C. disability
    assistance and temporary assistance in response to increased employment hours?” We
    focus on how cash-transfer income support programs available to IA recipients and the
    tax system work together to influence a person’s after-tax income. Particularly, using the
    tax year 2019, benefits offered by various cash-transfer programs and IA benefits are
    combined with the B.C. and federal personal income tax rates in order to understand
    the full effect of the design of IA on work disincentives. Specifically, the cash-transfer
    programs included are: the Canada Workers Benefit, the Canada Child Benefit, the GST/
    HST credit, the B.C. Climate Action Tax Credit, the B.C. Sales Tax Credit, and the B.C.
    Early Childhood Tax Benefit (additional information for these programs is provided in the

    6
        Net earned income includes earned income less income tax, EI premiums, CPP premiums, medical insurance,
        superannuation, company pensions and union dues. This earnings exemption is the amount of earned
        employment income a recipient can receive before reductions in TA or DA benefits begin.
    7
        When the DA earnings exemption resets at the start of the calendar year, a client is not impacted by the
        earnings-exemption limit until he or she earns $12,000 in net income. This may be late in the year. These
        earnings exemptions were just announced to increase in 2020. This increase is discussed in more detail later
        in the paper.
    8
        In this case, the 100-per-cent effective tax rate occurs when every additional dollar earned through
        employment results in social assistance being reduced by the same amount. This means, for every additional
        hour worked, a recipient of social assistance does not receive any additional after-tax income or transfers,
        negating the incentive to work more. This situation is also part of what is known as the welfare wall.

4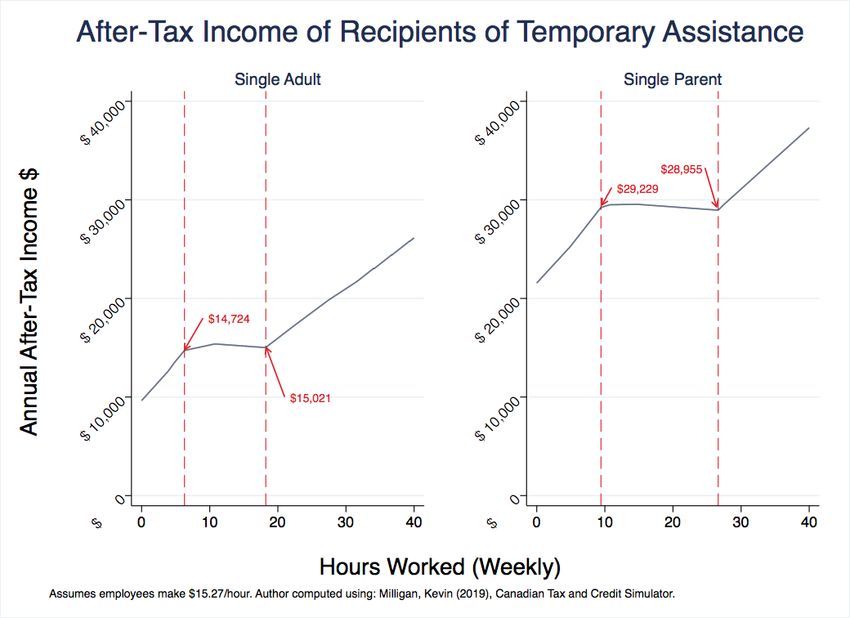
appendix).9 Also included is the transportation supplement, which is provided to all DA
    recipients and can be converted into a cash transfer of $624.10

    For simplicity of this analysis, we assume recipients of these benefit programs receive
    the full benefit amounts. This assumption overstates the actual amount of benefits
    received because there are a number of barriers to accessing the full suite of available
    supports. First, there are administrative burdens associated with applying to most benefit
    programs, with some programs estimated to have roughly 30-per-cent take-up rates
    (Dunn and Zwicker 2018). Second, failure to comply with an administrative requirement,
    such as monthly reporting, decreases the amount of benefit received. Third, benefit-
    level calculations consider expenditures, and some people do not incur the maximum
    expenses required to achieve the full benefit amount. For instance, in our analysis we
    assume that an IA recipient receives the full shelter-support component of IA. However, if
    a recipient of TA or DA has no housing or does not spend enough on housing, he or she
    does not receive the full shelter support. Finally, we also assume that IA recipients are
    not disqualified from IA if they find employment and their earned income is less than the
    point at which IA benefits are phased out to zero.

    We also make a number of other simplifying assumptions for modelling purposes. First,
    we assume no recipients are students, veterans or members of the Canadian Armed
    Forces. Second, we assume single parents (and couples with children, which are included
    in the appendix) have one child under the age of six.11 Third, we assume that recipients
    do not receive other boutique tax credits, such as the medical tax credit. Fourth, we
    only examine single parents and single adults in the main text of this paper. Analyses
    for couples with and without children are included in the appendix and demonstrate the
    same overall trends as reported for single parents and single adults. Last, we assume
    recipients that are employed earn $15.27 an hour. This number represents the average
    hourly wage rate of a part-time employee in accommodation and food services in B.C. in
    September 2019 (Statistics Canada 2019).12

    RESULTS
    We provide a graphical analysis of barriers to work created by the program design of IA
    in B.C. Figure 1 shows how after-tax income for a TA recipient changes as hours worked

    9
         These cash-transfer programs are included because they are “universal” in the sense that they depend on
         income and family size and are distributed through the tax system. We exclude social insurance programs,
         such as employment insurance and the Canada Pension Plan, which are more situation-specific. We also
         exclude income and social support programs that provide in-kind benefits, e.g., health care, pharmacare,
         education and other services, as these depend on the recipients’ more specific situation, which is not easily
         observable, and these are not easily convertible into cash amounts.
    10
         All other supplements are excluded because they are not frequent, are situation-specific, are generally not
         reported on tax forms, and are often provided as in-kind benefits, which are difficult to convert into cash
         values.
    11
         For families with children over the age of six or for families with more than one child, the same patterns hold
         as the pattern for one child under six.
    12
         Assuming a different wage rate changes the number of hours of work needed to hit the beginning or end of
         the “plateau” region, where after-tax income is relatively flat.

5
increase (at a constant wage rate of $15.27 an hour). Likewise, Figure 2 shows how after-
tax income changes for a DA recipient as hours worked increase (at a constant wage rate
of $15.27 an hour). In both figures 1 and 2, the first red dotted line indicates where the
net-income earnings exemption is reached. The second red dotted line indicates where
TA or DA benefits are completely phased out. Tables 3 and 4 in the appendix provide
in-depth numerical details for figures 1 and 2.
For hours worked by TA (Figure 1) and DA (Figure 2) recipients prior to the earnings
exemption (the first red dotted line in figures 1 and 2), after-tax income increases as
expected when hours of work increase. Single adult recipients of TA who increase their
work from zero to six hours a week (immediately before their earning exemption for IA
is exhausted) increase their after-tax income by $5,073 a year. This increase in after-
tax income is closely mirrored by the increase in (before-tax) earned income, which
increases by $4,790 a year (Figure 1; see Table 1 for more details). Likewise, if single
parents who are recipients of TA increase their work from zero hours to nine hours a
week (immediately before their earnings exemption is exhausted), they earn an additional
$7,654 a year in after-tax earnings and transfers. This is similar to the increase in (before-
tax) earned income, which increases by $7,190 a year.
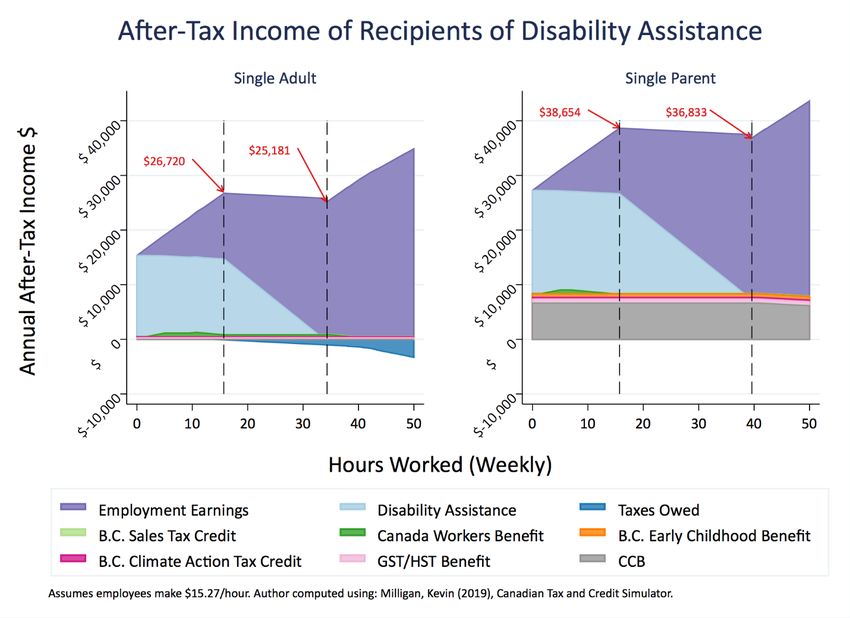
This pattern is similar for DA recipients. A single adult receiving DA who increases his
or her hours worked from zero to 16 hours a week (immediately before the earnings
exemption is exhausted), increases after-tax income by $11,366 a year (see Figure 2 and
Table 2 for more details). This is largely driven by an increase in (before-tax) earned
income, which increases by $11,980 a year. Likewise, a single parent who receives DA who
increases his or her hours worked from zero to 16 hours a week (immediately before the
earnings exemption is exhausted) increases his or her after-tax income by $11,375 a year,
which is largely driven by an increase in (before-tax) earned income of $11,980 a year.
As the number of hours worked continues to increase beyond the earnings exemption
(the first red dotted line), there is a “plateau effect” (figures 1 and 2). That is, until TA or
DA benefits are completely phased out, after-tax income is relatively flat.
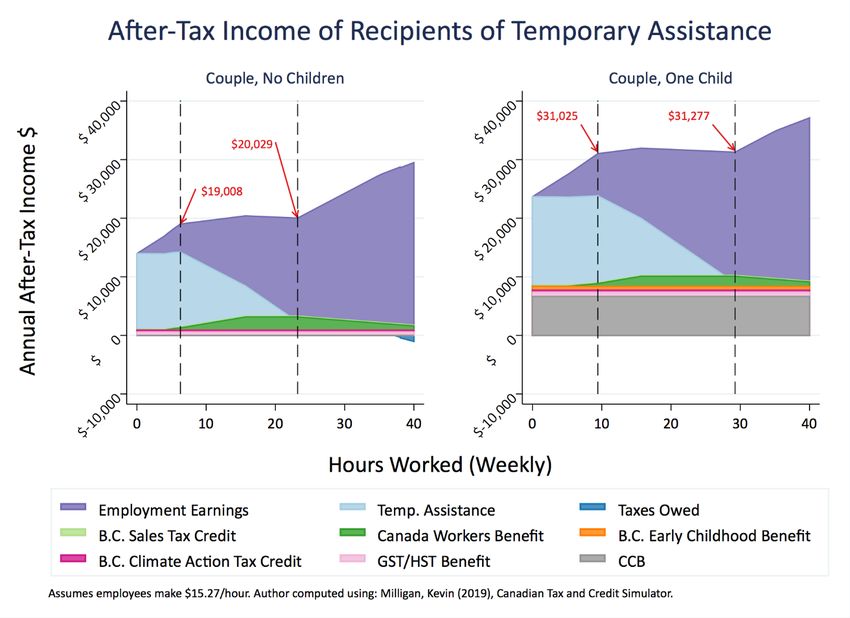
In Figure 1, a single adult receiving TA and working six hours per week for a year receives
$14,724 a year in after-tax income. If that same person were to accept an increase in
working hours to18 hours of work per week at the same wage rate, his or her after-tax
income after a year increases to $15,021 a year. Thus, for an increase in hours worked of
12 hours per week (or 600 hours a year), a TA recipient’s after-tax income increases by a
mere additional $298 a year (see Table 1 for more details).
If a single parent receiving TA working at the beginning of his or her plateau region
increases hours worked to the end of the plateau region, he or she is financially worse off.
From Figure 1, a single parent working nine hours per week for a year (at the beginning
of the plateau region) receives $29,229 in after-tax income. If that same person increased
hours worked to 27 hours per week at the same wage rate (at the end of the plateau
region), he or she will receive $28,955 a year in after-tax income—a decline of $274 a year
in after-tax income, even though the person increased the hours worked by 18 hours per
week (or 900 hours a year)! (See Table 2 for more details).
6This effect is magnified for a PWD receiving DA. A single adult receiving DA who
increases his or her hours worked from 16 hours per week (the beginning of the plateau
region) to 34 hours per week (the end of the plateau region) sees a decline in after-tax
income of $1,549 a year. Single parents receiving DA who increase their hours worked
from 16 hours a week (the beginning of the plateau region) to 40 hours a week (the end
of the plateau region) see a decrease in after-tax income of $1,821 a year (see table 2 for
more details).
As individuals increase their hours worked per week beyond the plateau effect, after-
tax earnings and transfers begins to rise in tandem with an increase in hours worked,
as we generally expect and as observed for hours of employment below the earnings
exemption. The upper boundaries of the plateau for adults and parents receiving TA are
18 and 27 hours worked per week. For adult and parent recipients of DA, these upper
boundaries are 34 and 40 hours per week.
FIGURE 1: AFTER-TAX INCOME OF RECIPIENTS OF TEMPORARY ASSISTANCE
7FIGURE 2: AFTER-TAX INCOME OF RECIPIENTS OF DISABILITY ASSISTANCE
As discussed above, a major reason for this “plateau effect” is the current design of IA,
which claws back 100 per cent of income assistance benefits with every dollar earned
after the earned-income exemption. However, this claw back is not the only reason for
the plateau effect. There are also interactions with other programs in the tax and transfer
system that exacerbate the problems with the design of IA. Figures 3 and 4 provide a
more detailed look at how the design of IA, coupled with the tax and transfer system,
contribute to this plateau effect. Figure 3 shows how each separate tax and transfer
program contributes to the total after-tax income received by a TA recipient. Figure 4
shows the same for a DA recipient. Figures 3 and 4 are stacked-area graphs: they show
the total combination of taxes, transfers and earnings. It is possible that an IA recipient
may owe money in taxes. In this case, the dark blue areas representing “taxes owed” is a
negative number and is deducted from total after-tax earnings and transfers.
In both figures 3 and 4, TA and DA benefits (the light-blue area) begin to decline after the
earnings exemption (the first dotted line), coinciding with where the plateau begins. For
earned income above the earnings exemption, TA and DA benefits are reduced by one
dollar for every additional dollar earned until TA and DA benefits are completely phased
out. The plateau ends where TA and DA benefits are completely phased out.
Figures 3 and 4 include the Canada workers benefit that TA and DA recipients are
potentially eligible for. The Canada Workers Benefit (CWB) is a federal refundable tax-
credit program, intended to supplement the earnings of low-income workers and improve
work incentives for low-income Canadians (Government of Canada 2019b). The CWB
is phased in at a rate of 26 per cent, starting at an earned income of $3,000, reaches a
maximum of $1,355 for single persons and $2,335 for families, and then is phased out at
812 per cent over adjusted net income for adjusted net income above the threshold. An
additional CWB disability supplement increases the maximum CWB (up to $700) and
phases in and out over thresholds that are more generous.
The CWB does very little to alleviate the disincentive to work created by IA. For TA
recipients, the CWB phase-in begins about where TA begins to phase out, so there
is some potential positive effect. However, the CWB does not have a large impact on
reducing the disincentive to work created by TA. This effect is more pronounced for
recipients of DA: recipients of DA receive almost no CWB because of the way it is
calculated. When earnings plus DA are combined, DA recipients have too high a total
income to be eligible for CWB. Thus, the CWB does not meet its intended goal of
supplementing earnings and improving work incentives for those receiving DA.
FIGURE 3: AFTER-TAX INCOME OF RECIPIENTS OF TEMPORARY ASSISTANCE
9FIGURE 4: AFTER-TAX INCOME OF RECIPIENTS OF DISABILITY ASSISTANCE
DISCUSSION
These results show that the program design of IA in B.C. does appear to support a
recipient’s decision to work, so long as the decision is whether or not to work at all. The
program design of IA, however, dramatically affects the decision of whether or not to
work more hours if a person is already working. If a TA or DA recipient is employed below
or close to the beginning of the plateau range, and is offered employment closer to the
end of the plateau range, he or she faces a trade-off. If the TA or DA recipient accepts the
offer, his or her after-tax income could fall from the increased employment and his or her
time spending doing other things would decrease. This forgone time is time that could
be used for family commitments, education, self-care, or improving the symptoms of a
disability. On the other hand, if the TA or DA recipient does not accept the offer, he or
she may miss the opportunity to acquire additional skills and experience (which may be
important for career advancement) and more satisfaction from increased employment.
The program design of IA is the direct cause of this trade-off.
In addition to these financial barriers, there may be other barriers to work created by the
design of IA. Particularly, the loss of some or all general and health supplemental benefits
otherwise available to IA recipients. General and health supplemental benefits are offered
to recipients of TA and DA provided they meet the eligibility criteria for the specific
supplement (e.g., medical need). Health supplements include the provision of necessary
medical equipment such as wheelchairs, inhalers, hearing aids, and apnea monitors,
as well as coverage (up to a maximum amount) of health services, such as dental and
10optical. General supplements include cash transfers, such as the crisis supplement that
provides extra money in the event of a crisis, and money to cover school fees. In addition,
persons receiving DA receive a transportation supplement valued at $52 a month.
If an IA recipient accepts employment that is above the plateau range (that is, at a level
of earned income for which they would no longer receive TA or DA), the recipient is
no longer eligible for some (or all) of the general and health supplements. A person
receiving DA who accepts employment where the earnings make him or her ineligible
for DA (i.e., above the second dotted line in figures 2 and 4), that person would continue
to receive the transportation and health supplements for the remainder of the year, but
not the general supplements.13 If a family with children receiving TA accepts employment
where their earnings make them ineligible for TA, they also would lose access to the
general supplements but would remain eligible for the health supplements for 12 months
through the Transitional Health Services program. Finally, if a person receiving TA with no
children loses access to TA benefits, he or she would no longer be eligible for either the
general supplements or the health supplements.14
Loss of these supplements could have a significant impact on the decision of whether
or not to increase employment to a point after the plateau range (i.e., where they are
no longer eligible for TA or DA). Single adults who transition off TA due to increased
employment income and lose all their supplements may not receive sufficient workplace
coverage for services such as optical or dental. Likewise, while persons who transition
off DA do not lose their health supplements, they may fear the loss of their general
supplements. This reduces IA’s ability to break the cycle of poverty: these supplements
provide a cushion in the case of large unexpected expenses. If a recipient of IA is trying to
transition into stable employment, and shortly after beginning employment experiences
an unexpected crisis, for example an infected tooth nerve that requires a root canal or a
broken window in their house that requires immediate replacement, he or she may not
yet have sufficient assets to cover these costs. The recipient may turn to costly payday
lenders or quit their employment to receive the IA supplements again. An IA recipient
might not take employment in the first place for fear of this situation occurring.
These barriers to work created by the program design of IA are especially problems for
PWD who are DA recipients and are ready, willing and able to work. For these persons,
barriers to work created by policy design should be minimized as they already face many
other structural barriers to work. Canada, in signing the UN Convention on the Rights
of Persons with Disabilities and Optional Protocol, has committed to recognizing the
rights of persons with disabilities to work on an equal basis with others (Employment
and Social Development Canada 2019). Through this commitment, federal and provincial
governments are committed to safeguarding and promoting the realization of the right to
work through the legislation, programs and services they provide. This includes policies
13
At the end of the year, the DA earnings exemption resets, potentially qualifying the individual for DA again
(provided he or she still meets the eligibility requirements) until he or she reaches the earnings exemption
limit again.
14
Note that there is an exception to this. Those who are receiving TA and designated as persons with persistent
and multiple barriers to work (PPMB) would remain eligible for the health supplements upon loss of TA
benefits.
11aimed at prohibiting discrimination, promotion of just and favourable work conditions,
equitable employment opportunities and remuneration, access to vocational and
technical training, promotion of self-employment and entrepreneurship and provision
of appropriate accommodations in the workplace. Fortunately, programs like the
Opportunities Fund for Persons with Disabilities will afford some DA recipients greater
access to flexible employment (Government of Canada 2019c).15
This issue of barriers to work due to poor policy design seen within IA in B.C. speaks to
a larger conversation about social inclusion. Social inclusion is the process of improving
participation in society, particularly for people who are disadvantaged, through
enhancing opportunities, access to resources, voice and respect of rights (United Nations
Department of Economic and Social Affairs 2016, 17). There is no universal definition of
social exclusion, although lack of participation in society (economic, social, political and
cultural life) is at the heart of nearly all definitions; it has different meanings dependent
on context, and individuals experience it differently (United Nations Department of
Economic and Social Affairs 2016, 18). Participation in society is limited when people
lack access to material resources, including income and employment, or to services
such as health care (United Nations Department of Economic and Social Affairs 2016,
18). Employment is a foundation of social inclusion and well-being particularly when
it provides sufficient earnings to maintain adequate living standards, and comes with
decent working conditions and prospects for career advancement (United Nations
Department of Economic and Social Affairs 2016, 42). Finally, sustainable employment
can contribute to ending the cycle of poverty, thereby increasing social inclusion
(International Labour Organization 2016).
The process through which program design, such as the design of IA, can drive social
inclusion and exclusion is important to understand if we want to improve the lives
and well-being of those experiencing social exclusion (United Nations Department of
Economic and Social Affairs 2016, 22). With respect to the above analysis of IA in B.C.,
the program design of IA enhances social exclusion. Specifically, the one-for-one phase-
out rate of IA benefits over employment earnings and the withdrawal of the general and
health supplements create a barrier to employment, a foundation of social inclusion.
However, IA can also be used to promote social inclusion for vulnerable populations.
First, IA can and does help vulnerable persons with access to material resources required
for participation in society through access to a source of funds. Second, IA can help a
vulnerable population secure meaningful employment. To do this, IA can and should be
reformed in order to remove barriers to employment.
15
The Opportunities Fund for Persons with Disabilities is a program aimed at assisting persons with disabilities
to secure, maintain and seek employment. These grants have two streams, national and regional, to provide
a wide range of supports such as “job search supports, pre-employability services, wage subsidies, work
placements and employer awareness initiatives to encourage employers to hire persons with disabilities”
(Government of Canada 2019d).
12REFORMS
One potential reform that would address the problem of the plateau range would be to
extend the phase-out rate while maintaining the current level of benefits and earnings
exemption. B.C. has one of the steepest phase-out rates in Canada. Table 1 shows the
phase-out rates for B.C., Alberta, Ontario and Saskatchewan. From Table 1 we observe
that B.C.’s IA and Saskatchewan’s Assured Income for Disability (SAID) programs both
have 100-per-cent phase-out rates. Alberta and Ontario have lower phase-out rates.
TABLE 1: PHASE-OUT RATES
British Columbia Alberta Ontario16 Saskatchewan
Temporary Assistance Alberta Works 17
Ontario Works SIS (Income Support)18
All family types 100% 75% 50% 75%
Disability Assistance AISH 19
ODSP SAID
All family types 100% 50% 50% 100%
Although extending IA’s phase-out rates would address the issue of the plateau range, it
may not be the best option for reform, depending on the objective of the government.
If the objective is to encourage those who are currently working to increase their work,
extending the phase-out rate could help meet this objective. 20 However, extending the
phase-out rate alone may not necessarily help with moving IA recipients who are not
working into paid work. Very few IA recipients are in paid work and even fewer make
enough income to place them in the plateau range. In December 2019, only seven per
cent of all TA recipients who were expected to work earned income and, of those that
did earn income, only seven per cent earned more than the earnings exemption, putting
them into the phase-out range of TA. 21 Furthermore, extending the phase-out range may
not have the intended positive effect on employment if recipients do not understand
how it affects them personally and when there is a lot of misinformation, a common
problem with income assistance programs and with large, complicated income and social
assistance systems.
16
Source: Government of Ontario 2019.
17
Source: Alberta Works Policy Manual current to October 2019 (Government of Alberta 2019a).
18
Source: Government of Saskatchewan 2019a.
19
Source: AISH Policy Manual current to January 2020 (Government of Alberta 2020).
20
The actual (theoretical) effect depends on by how much the income and substitution effects are altered by
the extension of the phase-out region. With a 100-per-cent phase-out, TA recipients can work less, have the
same income and have more leisure time—both the income and substitution effect suggest TA recipients will
work less if they are in the phase-out range. By extending the phase-out range, the income and substitution
effect would theoretically still lead a TA recipient to work less, however the effects are not as strong, so
although they may work less than they otherwise would, it should not be as much less as if the phase-out rate
were 100 per cent.
21
Ministry provided data. Please contact authors for more information.
13TABLE 2: EARNINGS EXEMPTIONS FOR PROVINCIAL INCOME ASSISTANCE PROGRAMS
British Columbia Alberta Ontario Saskatchewan
Current Earnings Earnings Current Earnings Current Earnings
Exemption Exemption as Exemption Exemption
(Jan. 2020) of Jan. 2021 (Jan. 2020) (Jan. 2020)
SIS (Income
Temporary Assistance22 Alberta Works23 Ontario Works24
Support)
Single adult $400/month $500/month $230/month $200/month $325/month
Single parent $600/month $750/month $230/month $200/month $500/month
Couple, no child $400/month $500/month $115/month $200/month $425/month
Couple with child $600/month $750/month $115/month $200/month $500/month
PPMB $700/month $900/month -- -- --
Disability Assistance25 AISH26 ODSP27 SAID28
Single adult $12,000/year $15,000/year $1,072/month $200/month $6,000/year
Single parent $12,000/year $15,000/year $2,612/month $200/month $8,500/year
Couple, no child or $14,400/year $18,000/year $2,612/month $200/month/adult $7,200/year
children, one PWD
designation
Couple, no child or $24,000/year $30,000/year $2,612/month $200/month/adult $8,500/year
children, two PWD
designations
We note that B.C. has one of the highest earnings exemption rates in Canada and B.C.’s
latest budget (released in February 2020) has announced that the earnings exemption
will be increased in January 2021. Table 2 shows the earnings exemption rates across
the provinces. Both B.C.’s current earnings exemption rate and the earnings exemption
rate announced in the 2020 B.C. budget are far more generous than in Alberta, Ontario
or Saskatchewan. A higher earnings exemption can induce more IA recipients to enter
into work in the first place and it can provide better help with movement out of poverty
traps. 29 The higher the earnings exemption, the more work an IA recipient can accept
without seeing a reduction in benefits, and the more financially stable he or she becomes
as he or she is given time to pay off debts and amass savings.
22
Source: B.C. Budget 2020 (Government of British Columbia 2020).
23
Source: Alberta Works Policy Manual current to October 2019 (Government of Alberta 2019a)
24
Source: Government of Ontario 2019.
25
Source: B.C. Budget 2020 (Government of British Columbia 2020)
26
Source: AISH Policy Manual current to January 2020 (Government of Alberta 2020).
27
Source: ODSP policy current to May 2018 (Government of Ontario 2018).
28
Source: SAID policy manual current to November 2019 (Government of Saskatchewan 2019).
29
See Saez (2002), which explains that when participation elasticity is high (which is what we would expect for
low-income persons, but which has not been measured for B.C.), an income assistance program that exempts
the first $5,000 to $7,000 (annually) and then taxes or phases out the benefit is the optimal program.
However, this is largely dependent on the participation elasticity.
14With respect to financial stability, the B.C. 2020 budget could have done more to enhance
social inclusion for IA recipients. A second reform option that would both encourage
entrance into work and overcome the plateau range would be to allow an IA recipient
more time to become financially stable. This could be done by freezing an IA recipient’s
benefit level for 12 months after accepting employment or entering into paid training, and
providing the recipient with continued access to all the general and health supplements, a
transit supplement, and coverage of child-care costs for these same 12 months. Likewise,
the earnings exemption and phase-out would not apply for these 12 months.
This reform could be rolled out in phases, beginning with either single parents and/or
single persons on TA who are expected to work. 30 Such a roll-out would address cost
issues and focusing on these groups would support the purpose of earnings exemption for
TA clients, which is to provide support to transition them into work. 31 At the same time, or
alternatively, depending on the governments priorities and constraints, this reform could
initially be rolled out to recipients of DA. Such a reform would better acknowledge the
episodic nature of employment for some persons with chronic conditions or disabilities,
making transitions on and off DA easier and enhancing social inclusion.
Arguably, extending the drop-off in IA benefits would simply push back the timing of
the drop-off, resulting in similar issues 12 months down the road. However, those first 12
months would allow IA recipients to create a more stable financial foundation (i.e., build
assets) so they are better able to weather a decline in IA benefits and the general and
health supplements. This will help those transitioning off of IA break the cycle of poverty
by, for example, not having to rely on costly payday lenders or having to fall back onto IA
when an unexpected event occurs. 32 Furthermore, it may reduce the overall costs of the
IA program by reducing the number of clients who have to return to IA.
Other benefits to such a reform include simplicity: extending the drop-off of benefits
for 12 months would be simpler for recipients to operate within. Knowing that they can
work flexibly over the course of a 12-month period and not have to worry about hours
or earnings is a straightforward system that allows recipients to work without any fear
of losing benefits, an oft-stated reason for not working or working illicitly (Hertz et al.
2020). Further, the simplicity of the system may minimize misinformation that is shared
among recipients, something that also currently happens that prevents work (Hertz et al.
2020). Secondly, such a reform would enhance respect and social inclusion for recipients.
It allows them to accept work without assuming that work is necessarily permanent and
sufficient to support them, and it allows them to leave a job or workplace for any reason,
30
Single persons have the highest rate of poverty in B.C., followed by single parents (Petit and Tedds,
forthcoming).
31
The objective of the earnings exemption for DA clients is to support them in paid work so they can maximize
their earnings to the best of their ability and enhance social inclusion and well-being.
32
See Carter and Barrett (2006) who show that when an unexpected large cost arises (e.g., divorce, vehicle
repair, etc.) that requires a household to draw on its savings, if their savings remain above an asset threshold,
they are expected to recover, versus a household whose savings drop below the asset threshold, who are
less likely to recover and may fall into a poverty trap. To reduce the probability of this occurring, savings or a
stable financial base is needed.
15including jobs that are of low quality and workplaces that are abusive, without having to
worry about having to reapply for IA or substantiating the reasons for leaving their job.
Lastly, another reform that could address both the plateau range and help move more
low-income persons into work would be to reconfigure the CWB parameters (which a
province is permitted to do, within constraints, even though it is a federal program) or
introduce a new earnings supplement program in addition to the CWB. How either of
these should be designed is largely dependent on the objective of the program and cost
issues. 33 For example, if the objective is to focus on the plateau range for TA recipients
and turn it into a range with a more positive slope, the CWB or an earnings supplement
could be phased in where the earnings exemption begins (i.e., at a working income
of $4,800 for single adults) up until the level of net income where TA is zero (i.e., at a
net income of $12,321). The CWB/earnings-supplement benefit level could then remain
constant or begin to immediately phase out, depending on cost considerations. Similar
considerations would then determine the maximum benefit level. Additionally, whether
these parameters (e.g., phase-in, phase-out, etc.) should differ by family type (e.g.,
single adult, single parents, persons with disabilities, etc.) or be the same for everyone is
dependent on whether the objective is to reduce the plateau area for all IA recipients or
for one targeted group.
Likewise, if the objective of a CWB reconfiguration or a new provincial earnings subsidy
is to address the plateau range while also creating incentives to enter into paid work,
other parameter values may meet this objective better. For instance, beginning the
phase-in of the CWB or a new provincial earnings supplement at a working income of
$1 while ensuring the CWB or earnings supplement does not phase out over the same
range that IA phases out would address these issues better, but it would likely be costly.
Given that there are competing objectives and a multitude of parameters for the CWB
or a provincial earnings subsidy that could be chosen, we do not explore this issue in any
more detail here.
This last reform option—reconfiguring the CWB or a new provincial earnings supplement—
may not be the best reform choice. It suffers from the same issues as extending the
phase-out range would. For this reform to have the desired effect on behaviour, eligible
persons would have to understand how the program affects them personally and how it
interacts with all the other income and social-benefit programs. This is complicated and
time-consuming. A simplification of the system as we proposed in our second reform
option, as opposed to layering on more programs or tweaking parameter values, will likely
have a more positive effect on IA recipients labour-force choices.
CONCLUSION
In summary, the design of Income Assistance in B.C. creates barriers to work. We show
that for recipients of Income Assistance, those who work more hours receive less after-
tax earnings and transfers than those who work fewer hours at the same wage level. For
33
Any CWB re-configuration must be cost-neutral to the federal government. And any new provincial earnings
supplement must have a provincial source of revenue to draw from to fund it.
16recipients of Disability Assistance, they may earn up to $1,800 per year less in after-tax
income than those who work part-time at the same wage rate. This becomes an even
larger problem when the loss of important general supplements and health supplements
are considered.
A large driver of these results is that, under the current design of Income Assistance in
B.C., Income Assistance is phased out by one dollar for every additional dollar earned
over the earnings exemption. This design discourages Income Assistance recipients from
increasing their hours worked or earnings as they would be financially worse off relative
than if they had worked fewer hours or earned less. Other transfer programs, such as the
Canada Workers Benefit, which is intended to create work incentives, do little to alleviate
this barrier to work. Disincentives for recipients to work more hours forces recipients into
a trade-off between gaining potentially valuable skills and experience but accepting they
will have less income by working more.
Producing a system that encourages social inclusion and contributes to breaking the
cycle of poverty by building financial stability includes considering how current program
design creates barriers to employment, and how these programs interact with other
income support programs. While there is no single solution to encouraging employment
and thus enhanced social inclusion, steps need to be taken to ensure a more socially
integrated, inclusive and cohesive society. As Tedds et al. (2020) suggest, as B.C. works
towards the goals set out in the B.C. Poverty Reduction Strategy (2018), the solution
should include reforms that simplify current income assistance programs and enhance
respect for clients. Reforms that simplify programs, as opposed to tweaking program
parameters, are more easily understood by income assistance recipients, and are more
likely to encourage and support paid work, enhancing social inclusion and reducing
poverty. This paper provides one such way in which that may be achieved.
17BIBLIOGRAPHY
Canadian Association for Community Living (2011). Achieving Social and Economic
Inclusion: From Segregation to ‘Employment First.’ Law Reform and Public Policy,
Ser. Web.
Carter, Michael and Christopher Barrett (2006). “The economics of poverty traps and
persistent poverty: An asset based approach.” Journal of Development Studies 42
(2), 178-199.
Dunn, Stephanie and Jennifer Zwicker (2018). Policy Brief. “Why is uptake of the disability
tax credit low in Canada? Exploring possible barriers to access.” SPP Briefing Paper
11 (2).
Employment and Social Development Canada (2019). Accessible Canada Act: Summary
of the bill. Retrieved from https://www.canada.ca/en/employment-social-
development/programs/accessible-people-disabilities/act-summary.html#section
on Oct. 29, 2019.
Government of Alberta (2019a). “Non-Exempt and Partially Exempt Income” in Income
and Employment Support Policy Manual. Accessed at: http://www.humanservices.
alberta.ca/AWOnline/IS/5065.html.
Government of Alberta (2020). “Income” in AISH Policy Manual. Accessed at:
http://www.humanservices.alberta.ca/AWOnline/AISH/7221.html.
Government of British Columbia (2018). Basic Income. B.C. Poverty Reduction Strategy.
Retrieved from https://engage.gov.bc.ca/bcpovertyreduction/basic-income/.
Government of British Columbia (2019a). “Overview of BCEA Program.” Accessed at:
https://www2.gov.bc.ca/gov/content/governments/policies-for-government/bcea-
policy-and-procedure-manual/ministry-overview/overview-of-bcea-program on
Nov. 18, 2019.
Government of British Columbia (2019b). “Metadata for BC Employment and Assistance.”
Published by the Ministry of Social Development and Poverty Reduction, Research
Branch. Accessed at: https://catalogue.data.gov.bc.ca/dataset/metadata-for-bc-
employment-and-assistance on Nov. 18, 2019.
Government of British Columbia (2020). BC Budget 2020: A Better BC for Everyone.
Retrieved from https://www.bcbudget.gov.bc.ca/2020/default.htm.
Government of Canada (2019a). https://www.canada.ca/en/employment-social-
development/programs/accessible-people-disabilities.html.
Government of Canada (2019b). https://www.canada.ca/en/revenue-agency/programs/
about-canada-revenue-agency-cra/federal-government-budgets/budget-2018-
equality-growth-strong-middle-class/canada-workers-benefit.html.
Government of Canada (2019c). https://www.canada.ca/en/financial-consumer-agency/
services/living-disability/working-living-with-disability.html.
18Government of Canada (2019d). https://www.canada.ca/en/employment-social-
development/programs/opportunity-fund-disability.html.
Government of Ontario (2018). Ontario Disability Support Program: Income Support.
Retrieved from https://www.mcss.gov.on.ca/en/mcss/programs/social/directives/
odsp/is/5_3_ODSP_ISDirectives.aspx.
Government of Ontario (2019). Ontario Works Directives. Retrieved from https://www.
mcss.gov.on.ca/en/mcss/programs/social/directives/ow/5_3_OW_Directives.aspx.
Government of Saskatchewan (2019a). The Saskatchewan Assistance Regulations 2014.
Accessed at: https://www.canlii.org/en/sk/laws/regu/rrs-c-s-8-reg-12/latest/rrs-c-s-
8-reg-12.html.
Government of Saskatchewan (2019b). Saskatchewan Assured Income for Disability:
Policy Manual. Retrieved from https://publications.saskatchewan.ca/#/
products/28896.
Hertz, Sarah, Robin Grey and Myles Leslie (2020). “User experience of the system:
A qualitative analysis of the access issues encountered by the clients of British
Columbia social assistance system.”
International Labour Organization (2016). World Employment Social Outlook 2016:
Transforming jobs to end poverty. Accessed at: https://sustainabledevelopment.
un.org/content/documents/2525wcms_481534.pdf.
Jerdee, Chad. https://www.weforum.org/agenda/2019/04/what-companies-gain-
including-persons-disabilities-inclusion/.
Khayatzadeh-Mahani, A., Krystle Wittevrongel, David B. Nicholas and Jennifer D.
Zwicker. (2019). “Prioritizing barriers and solutions to improve employment
for persons with developmental disabilities.” Disability and Rehabilitation, doi:
10.1080/09638288.2019.1570356.
Petit, Gillian and Lindsay M. Tedds (forthcoming). “Poverty in British Columbia: Income
thresholds, trends, and depth of poverty.”
Saez, Emmanuel (2002). “Optimal Income Transfer Programs: Intensive versus extensive
labour supply responses.” The Quarterly Journal of Economics, Vol. 117(3): 1039-1073.
Sonne, Thorkil. https://www.weforum.org/agenda/2019/01/disabilities-autism-in-
employment-thorkil-sonne/.
Statistics Canada (2019). “Employee wages by industry, monthly, unadjusted for
seasonality.” Table 14-10-0063-01. Accessed at: https://www150.statcan.gc.ca/t1/tb
l1/en/tv.action?pid=1410006301&pickMembers%5B0%5D=1.11&pickMembers%5B1%
5D=2.2&pickMembers%5B2%5D=3.3&pickMembers%5B3%5D=5.1&pickMembers%5
B4%5D=6.1 on Nov. 18, 2019.
Tedds, Lindsay M., Daria Crisan and Gillian Petit (2020). “Basic Income in Canada:
Principles, Design Features, and Canadian Political Commitments.” The School of
Public Policy, University of Calgary
19United Nations Department of Economic and Social Affairs (2016). https://www.
un.org/esa/socdev/rwss/2016/full-report.pdf and https://www.un.org/esa/socdev/
rwss/2016/chapter1.pdf.
Waddell, Gordon and A. Kim Burton (2006). Is Work Good for Your Health and Well-
Being? TSO: The Stationary Office, Norwich, U.K.
20APPENDIX
List of supports included in the analysis:
Canada Child Benefit (For single parents, we considered one child under the age of six)
GST/HST credit
Canada Workers Benefit (including Canada Workers Benefit disability supplement for PWD)
B.C. Sales Tax Credit
B.C. Early Childhood Tax Benefit
B.C. Climate Action Tax Credit
Income Assistance (maximum shelter and support rates based on disability assistance recipients with PWD designation or temporary
assistance recipient with expected-to-work designation)
TABLE 3: CHANGES IN HOURS AND INCOME FOR TA RECIPIENTS
Single Adult Single Parent
Hours After-Tax After-Tax
Earned Hours Earned
Worked Income and Income and
Income Worked Income
per Week Transfers Transfers
From zero Beginning 0 $0 $9,639.5 0 $0 $21,562.96
to threshold 1 point hours/week hours/week
6.27 $4,790 $14,712.8 9.42 $7,190 $29,217
End point
hours/week hours/week
+6.27 +$4,790 +$5,073.3 +9.42 +$7,190 +$7,654
Difference
hours/week hours/week
From Beginning 6.29 $4,800 $14,723.75 9.43 $7,200 $29,228.6
threshold 1 point hours/week hours/week
to threshold 2
– the “plateau” 18.24 $13,930 $15,021.27 26.64 $20,340 $28,954.87
End point
hours/week hours/week
+11.95 +$9,129 +$297.52 +17.21 +$13,140 -$273.73
Difference
hours/week hours/week
From Beginning 18.26 $13,940 $$15,029.62 26.65 $20,350 $28,957.25
threshold point hours/week hours/week
2 to 40
hours/week 40 $30,540 $26,144.88 40 $30,540 $37,316.24
End point
hours/week hours/week
+21.74 +$16,600 +$11,115.26 +13.35 +$10,190 +$8,358.99
Difference
hours/week hours/week
Notes: “threshold” refers to the dotted red lines on figures 1 and 3 for TA recipients. Threshold 1 is
where the “plateau” area begins (i.e., where the TA earnings exemption is hit) and threshold 2 is where
the “plateau” area ends (i.e., where TA is completely phased out). All numbers assume a wage rate of
$15.27/hour.
21TABLE 4: CHANGES IN HOURS AND INCOME FOR DA RECIPIENTS
Single Adult Single Parent
After-Tax
Hours Earned After-Tax
Income and Hours Earned
Worked Income Income and
Transfers Worked Income
per Week (annual) Transfers
(annual)
From zero Beginning 0 $0 $15,344.54 0 $0 $27,269.96
to threshold 1 point hours/week hours/week
15.69 $11,980 $26,710.70 15.70 $11,990 $38,644.47
End point
hours/week hours/week
+15.69 +$11,980 +$11,366.16 +15.70 +$11,990 +11,374.51
Difference
hours/week hours/week
From Beginning 15.72 $12,000 $26,729.39 15.72 $12,000 $38,653.81
threshold 1 to point hours/week hours/week
threshold 2 –
the “plateau” 34.33 $26,210 $25,180.75 39.59 $30,230 $36,833.14
End point
hours/week hours/week
+18.63 +$14,220 -$1,548.64 +23.87 $18,230 -$1,820.67
Difference
hours/week hours/week
From Beginning 34.34 $26,220 $25,190.10
threshold point hours/week
2 to 40
hours/week 40 $30,540 $29,160.12
End point
hours/week
+5,66 +$4,320 +$3,970.02
Difference
hours/week
Notes: “threshold” refers to the dotted red lines on figures 2 and 4 for DA recipients. Threshold 1 is
where the “plateau” area begins (i.e., where the DA earnings exemption is hit) and threshold 2 is where
the “plateau” area ends (i.e., where DA is completely phased out). All numbers assume a wage rate of
$15.27/hour.
FIGURE 5: AFTER-TAX INCOME OF RECIPIENTS OF TEMPORARY ASSISTANCE
22You can also read