4.SUSTAINABILITY - Treasury.gov.au
←
→
Page content transcription
If your browser does not render page correctly, please read the page content below
4.SUSTAINABILITY
Outline of this chapter
This chapter considers the sustainability of the retirement income system. The costs of the system
analysed include: Age Pension expenditure, superannuation tax concessions, the superannuation
fees paid by members and social transfers in kind.
This chapter is organised in five parts:
     1.   Historical system costs.
     2.   Projected future system costs.
     3.   The cost-effectiveness of the retirement income system, including how Government
          support is allocated to promote adequate retirement outcomes.
     4.   The potential effects of alternative trends, including lower returns, lower wage growth and
          lower superannuation account fees.
     5.   Public confidence, including the effects of economic and integrity shocks on confidence, as
          well as policy changes and how to achieve reform without undermining confidence.
The immediate (and likely ongoing) detrimental impact on financial and labour markets of the
COVID-19 Pandemic is not reflected in baseline projections. However, Box 4A-4 contains analysis
using Treasury’s MARIA (Model of Australian Retirement Incomes and Assets) model of a large, but
short-term, shock to superannuation and how it impacts the retirement income system in the long
term.

                                                                                                  373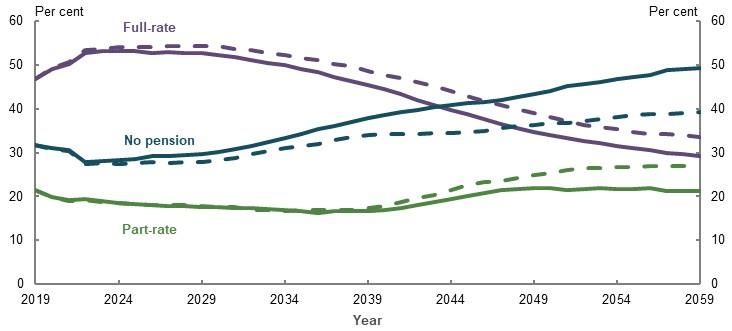
Sustainability

Section 4A. Sustainability
Box 4A-1          Chapter summary
•   Under current policy settings, the total projected cost of Age Pension expenditure and superannuation
    tax concessions together is estimated to grow from 4.6 per cent of GDP today to 5 per cent by 2060.
    The overall increase is projected to be due to the growing future cost of earnings tax concessions.
•   Age Pension spending has been stable over the past 20 years and is projected to fall moderately as a
    percentage of GDP over the next 40 years. This is despite growth in the maximum payment rate and the
    number of retirees. Higher superannuation balances driven by a maturing system, combined with means
    testing, will continue to constrain Government spending on the Age Pension.
•   The cost of superannuation tax concessions — although difficult to measure — is projected to increase
    as a percentage of GDP as the superannuation system matures. This is projected to be due to growing
    earnings tax concessions. Recent tightening of caps on contributions should help contain superannuation
    contributions tax concessions into the future. Earnings tax concessions increase as the system grows and
    are not subject to direct caps.
•   Social transfers in kind are substantial and increasing. This is mostly due to increasing Medicare and
    aged care expenditure.
•   Superannuation tax concessions boost retirement incomes across the income distribution. They
    increase retirement incomes most for households at the higher end of the income distribution.
    Superannuation tax concessions cost more than the Age Pension savings they produce across the income
    distribution.
•   The retirement income system is robust to changes to trends such as reductions in earnings and wages
    growth. Lower earnings and lower wages would reduce incomes in retirement from superannuation, but
    Age Pension income would cushion this impact for people. Lower fees would reduce the cost of the
    system and improve outcomes for people in retirement.
•   Public confidence can be undermined by poorly executed policy changes, economic shocks, concerns
    over system integrity or a general mismatch between expectations and outcomes. Broadly, the
    Australian system appears to enjoy reasonable levels of public confidence.

Box 4A-2          Stakeholder views on sustainability
Some stakeholders suggested taking a whole-of-system perspective when analysing sustainability,
incorporating public funding and private savings, alongside assessing intergenerational equity (addressed in
3H. Intergenerational equity).

              ‘… the sustainability of the Retirement Income System as a whole depends on the
           overall cost of the Age Pension, superannuation concessions and tax treatment of other
                                    assets and income.’ (COTA, 2020, p. 37)

Some stakeholders recommended assessing whether the system was ‘good value’ to taxpayers.

                  ‘The key measure is whether taxpayers and members receive good value.’
                                         (Rice Warner, 2020, p. 24)

Stakeholders considered means testing of the Age Pension and the compulsory nature of the Superannuation
Guarantee (SG) play key roles in influencing the sustainability of the system. Tax concessions on
superannuation and the concessional treatment of owner-occupied housing in the Age Pension means test
were identified as policies that decreased system sustainability. Many stakeholders were concerned about the
sustainability of the cost of social transfers in kind, such as health and aged care benefits. One submission
argued that while the retirement income system was sustainable, the same could not be said for aged care:

                                                                                                             375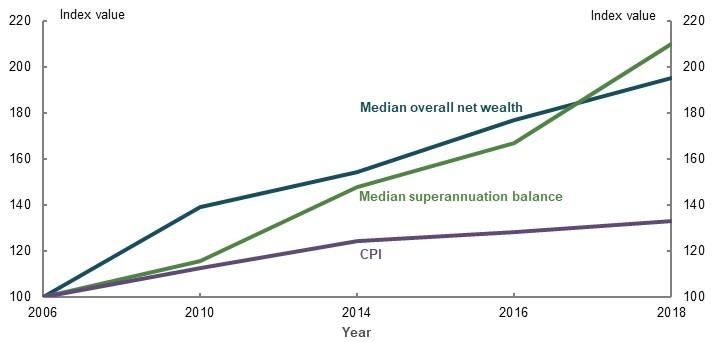
Retirement Income Review Final Report

               ‘Government support for retirement incomes is affordable now and in the future. In
              contrast, the Commonwealth government faces significant long-term fiscal challenges
                   from escalating future health and aged care expenses.’ (ASFA, 2020a, p. 22)

 More stakeholders raised concerns about the benefits of tax concessions being inequitably distributed, than
 about the sustainability of those concessions, although the two are linked. The large benefits going to
 higher-income earners were often framed as inequitable and unsustainable.
 Stakeholders noted that public confidence was essential to the sustainability of the system. Concerns raised
 centred on:
 •    Whether complexity makes it difficult for people to understand and have confidence in the system
 •    The frequency of policy changes
 •    Misconduct and failings exposed by the Royal Commission into Misconduct in the Banking, Superannuation
      and Financial Services Industry, and the Productivity Commission report Superannuation: Assessing
      Efficiency and Competition
 •    A lack of trust in financial advice

                 ‘National Seniors believes confidence in the retirement income system is impacted
                        largely by perceptions about complexity, instability and unfairness.’
                                       (National Seniors Australia, 2020, p. 63)

 Some stakeholders suggested the review should consider the impact of shocks or alternative trends, such as
 lower investment returns.

Historical costs
The total cost of Age Pension expenditure and superannuation tax concessions, both contributions
and earnings concessions, have risen from 3.55 per cent of GDP in June 2001 to 4.52 per cent of
GDP in June 2019 (Chart 4A-1). All components increased as a percentage of GDP over the period,
although tax concessions have grown by more than Age Pension expenditure (0.8 percentage points
compared with 0.2 percentage points).
                                            Chart 4A-1      Total system cost

Note Age Pension expenditure includes supplementary allowances. The tax concessions time series is presented to illustrate
the general trend. The cost of tax concessions is estimated independently each year (i.e. there is no dynamic impact of the
removal of concessions over time), and year-to-year estimates may be subject to changes in policy benchmarks, data,
assumptions and methodology. Source: Analysis of Annual Report 2000-2001 to 2018-19 (Department of Social Services,
2019); Tax Expenditures Statement 2004 to 2017 (The Treasury, 2018b); Tax Benchmarks and Variations Statement 2018 to
2019 (The Treasury, 2020); (ABS, 2019d).

376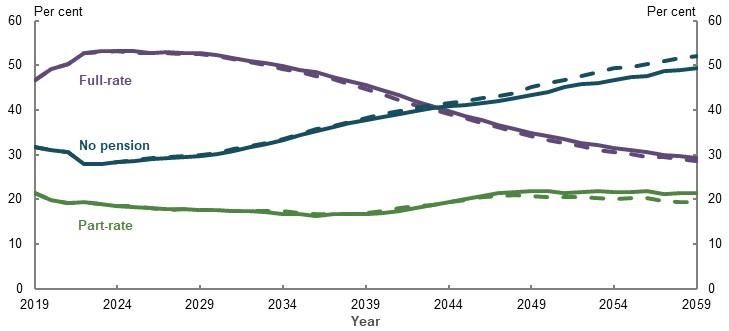
Sustainability

Age Pension
Since 2000-01, the cost of the Age Pension (including supplementary allowances) has grown by
92 per cent in real237 terms, from $24 billion to $46 billion (Chart 4A-2).
Age Pension spending has been reasonably stable as a percentage of GDP, increasing by
0.2 percentage points to 2.4 per cent between June 2001 and June 2019 (Chart 4A-2). As a share of
the Commonwealth Budget, Age Pension spending has increased by 0.9 percentage points over the
same period. As a share of average wages, Age Pension spending per working-age person has been
relatively stable over several decades (see 3H. Intergenerational equity).

                               Chart 4A-2         Total Age Pension expenditure
                         Dollars                                                Percentage terms

 Note: Values are in 2018-19 dollars, inflated by CPI.       Note: Age Pension expenditure includes supplementary
 Age Pension    expenditure      includes    supplementary   allowances. Source: Analysis of Annual Report 2000-2001 to
 allowances. Source: Annual Reports 2000-2001 to 2018-19     2018-19 (Department of Social Services, 2019); (ABS,
 (Department of Social Services, 2019) and (ABS, 2020e).     2019d); and data provided to the review by The Treasury.

Age Pension costs are affected by the size of the population of Age Pension eligibility age, the rate
of payment and the impact of means testing (see 1B. Design of Australia’s retirement income
system).
From June 2002 to June 2019, the size of the population over Age Pension eligibility age grew
46 per cent to 3.9 million people. Reflecting Australia’s ageing population, this exceeded the overall
population growth of 32 per cent.238 Increases to the Age Pension eligibility age have partially
moderated this growth.239
From June 2001 to June 2019, the maximum rate of payment (including supplementary allowances)
grew 28 per cent in real terms for couples and 37 per cent for singles (Chart 4A-3). The rate of the

237
    Throughout this chapter, unless stated otherwise, ‘real’ refers to inflation-adjusted figures.
238
    Annual Reports 2000-2001 to 2018-19 (Department of Social Services, 2019); (ABS, 2019b).
239
    From 1 July 1995, the Age Pension eligibility age for women was gradually increased from 60 to match the
male age of 65, reaching parity from 1 July 2013. From 1 July 2017, a process of six-month increases in the
Age Pension eligibility age (for all people) every two years began. From 1 July 2023, the Age Pension eligibility
age will be 67.

                                                                                                                    377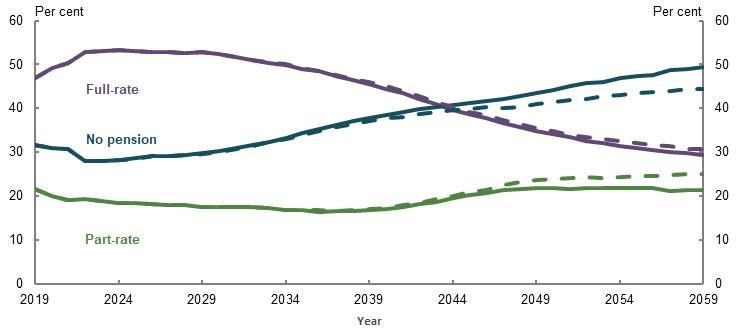
Retirement Income Review Final Report

Age Pension is benchmarked to male total average weekly earnings,240 which means the value of the
Age Pension generally increases in real terms over time.
From June 2001 to June 2019, male total average weekly earnings grew 19 per cent in real terms.241
The rate of growth in the maximum rate of the Age Pension is also influenced by:
• The changes following the Harmer review in 2009 (see 2A. Achieving a minimum standard of living
  in retirement)
• Recent real decreases in male total average weekly earnings (resulting in the Age Pension being
  increased the CPI or the Pensioners and Beneficiaries Living Cost Index, whichever is higher)
      Chart 4A-3    Maximum Age Pension rates and male total average weekly earnings (MTAWE)
                      Dollar terms                                            Indexed to 2000-01

 Note: Values are in 2018-19 dollars. Source: Analysis of   Note: Values indexed relative to 2000-01. Source: Analysis
 Annual Reports 2000-2001 to 2018-19 (Department of         of Annual Reports 2000-2001 to 2018-19 (Department of
 Social Services, 2019); A guide to Australian Government   Social Services, 2019); A guide to Australian Government
 payments 2015 to 2019 (Services Australia, 2019); (ABS,    payments 2015 to 2019 (Services Australia, 2019); (ABS,
 2020e); (ABS, 2019d).                                      2020e); (ABS, 2019d).

The composition of Age Pension recipients was broadly stable from June 2001 to June 2019 (Chart
4A-4). The share of part-rate age pensioners was increasing up until the Global Financial Crisis (GFC),
which reduced retirees’ net worth and increased the share of retirees receiving a full-rate
Age Pension. In 2017, when the assets test taper rate steepened (from $1.50 per $1,000 of assets to
$3), some part-rate age pensioners moved off the Age Pension.

240
    Some stakeholders submitted that there may be benchmarks more suitable than male total average weekly
earnings. The review has not sought to assess this.
241
    Analysis of (ABS, 2020d; ABS, 2020e).

378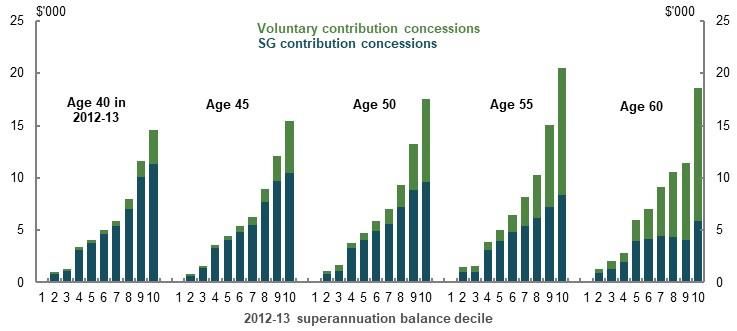
Sustainability

                         Chart 4A-4         The Age Pension eligibility age population

Source: Annual Reports 2000-2001 to 2018-19 (Department of Social Services, 2019).

The composition of the Age Pension population has not changed as much as superannuation
balances and net worth for those over age 65. Superannuation balances (and overall net worth) for
people aged over 65 have increased substantially in real terms since 2006 (Chart 4A-5). However, this
growth has been from a relatively low base. The median age pensioner still has limited assets outside
owner-occupied housing (see 3C. Home ownership status). The design of the means test results in
people moving from full-rate Age Pensions to part-rate Age Pensions more quickly than people move
off the Age Pension altogether.
       Chart 4A-5         Change in assets of people aged 65 and over compared with CPI growth

Note: Values indexed relative to 2005-06. Source: Analysis of Household Income and Wealth, 2005-06 to 2017-18 (ABS,
2019k); (ABS, 2020e).

Superannuation tax concessions
The cost of superannuation tax concessions represents forgone tax revenue for the Government, as
opposed to a direct expenditure cost.242 The cost of tax concessions is not observed but estimated by

242
   The cost of tax concessions is referred to as tax expenditure or tax benchmark variation. See Palisi (2017) for
a historical summary of the concept and surrounding debate.

                                                                                                               379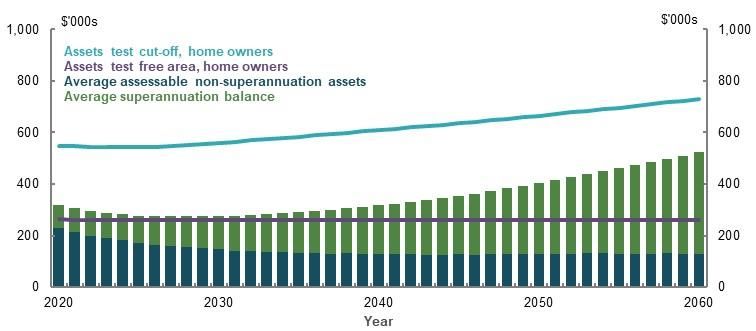
Retirement Income Review Final Report

comparing actual revenue received with what might have been collected in the absence of
concessions. Constructing this counterfactual is not straightforward. Opinions differ around the
appropriate tax benchmark and the potential effect of behavioural change.
This review uses a comprehensive income tax benchmark to measure the cost of superannuation tax
concessions. This means tax revenue actually collected is compared with the estimated amount that
would have been collected if contributions and earnings were all taxed at full marginal rates.
An alternative benchmark is an expenditure tax benchmark, which taxes contributions at full
marginal rates but treats earnings as tax-free. Annex — estimating superannuation tax concessions
provides more detail on the tax benchmark used in this review.
Both contributions and earnings tax concessions have increased in real terms over the past
20 years (Chart 4A-6). In general, earnings tax concessions are more volatile than contributions tax
concessions because earnings are closely linked to financial markets. Contributions tax concessions
are linked to wage growth and employment levels. Some variation in the value of both tax
concessions can be attributed to changes in the personal income tax rates and thresholds, which are
the benchmark tax treatment.
                         Chart 4A-6          The cost of superannuation tax concessions

Note: Values are in 2018-19 dollars, inflated by CPI. This time series is presented to illustrate the general trend. The cost of
tax concessions is estimated independently each year (i.e. there is no dynamic impact of the removal of concessions over
time), and year-to-year estimates may be subject to changes in policy benchmarks, data, assumptions and methodology.
Personal contributions tax concessions stem from people making contributions from post-tax income, but claiming a
deduction on their tax return. Source: Tax Expenditures Statement 2004 to 2017 (The Treasury, 2018b); Tax Benchmarks and
Variations Statement 2018 to 2019 (The Treasury, 2020).

Total contributions have grown faster (75 per cent from June 2004 to June 2019) in real terms than
salary and wages (55 per cent),243 partly due to the 0.5 percentage point increase in the SG rate over
2013-15. The cost of contributions tax concessions has grown more slowly (62 per cent) than
contributions, reflecting the tightening of policy settings, such as lower contributions caps and a
reduced Division 293 tax threshold. Introducing the transfer balance cap, which restricts the amount
that can be taken into the retirement phase where earnings are tax-free, has partly restrained
growth in earnings tax concessions.

243
      Analysis of (ABS, 2019d; Australian Prudential Regulation Authority, 2020a; ABS, 2020e).

380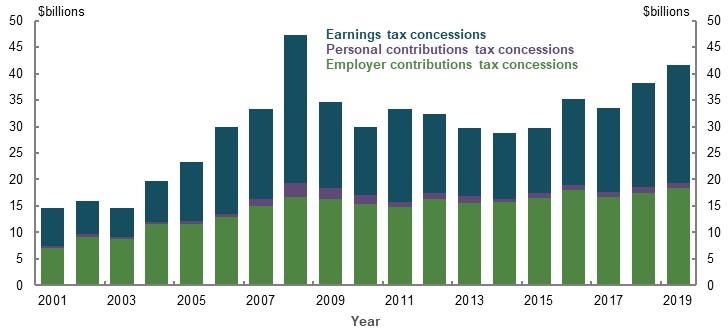
Sustainability

Contributions and earnings tax concessions together were estimated to cost a total of $41.55 billion
in revenue forgone terms in 2018-19 (Chart 4A-6).244 Of this, $18.3 billion was employer contributions
tax concessions (both compulsory and salary sacrifice) and $22.1 billion was earnings tax
concessions. Only $1.1 billion was personal contributions tax concessions, reflecting that less than
10 per cent of personal contributions are concessional.

The cost of tax concessions peaked in 2007-08 at $46.6 billion, before declining substantially to
$29.7 billion in 2009-10.245 They were then relatively stable in real terms until around 2015. Since
then, they have grown by almost 40 per cent. The same pattern is observed as both a percentage of
GDP and the Commonwealth Budget (Chart 4A-7).
Since 2000-01, the cost of superannuation tax concessions has grown faster than the Age Pension as
a percentage of GDP. By 2018-19, the cost of superannuation tax concessions was only
0.25 percentage points less than the cost of the Age Pension as a percentage of GDP.
                      Chart 4A-7        The cost of superannuation tax concessions

Source: Analysis of Tax Expenditures Statement 2004 to 2017 (The Treasury, 2018b), Tax Benchmarks and Variations
Statement 2018 to 2019 (The Treasury, 2020), (ABS, 2019d), and data provided by The Treasury for the review.

Superannuation fees
Superannuation fees have been analysed extensively in recent years (Productivity Commission,
2018a; Minifie, et al., 2014; 2015). These studies found fees across the system have trended down as
a percentage of assets in recent years but there is scope for further reductions that would improve
net returns, particularly among retail funds. The Productivity Commission (2018a) noted that just
0.5 percentage points extra in fees across a working life can reduce retirement balances by
12 per cent. The projected impact of lower fees on future retirement incomes is analysed below.

244
    Tax concessions are separately estimated and are not strictly additive. A minor overestimation is produced
by adding contributions and earnings tax concessions together. This is because no earnings (and subsequently
no earnings tax concessions) can be realised on contributions that are not invested in response to a higher
contributions tax. However, this is expected to have a minor impact. The entire stock of assets at any one time
are invested. The review estimates that trimming the extra tax off the flow of contributions into that stock
would see earnings tax concessions fall by only around 0.5 per cent for any given year.
245
    The 2007-08 peak was driven by the 2007 Simpler Super package, which, among other things, eliminated tax
on most withdrawals in the retirement phase and allowed a one-off $1 million post-tax voluntary contribution.

                                                                                                            381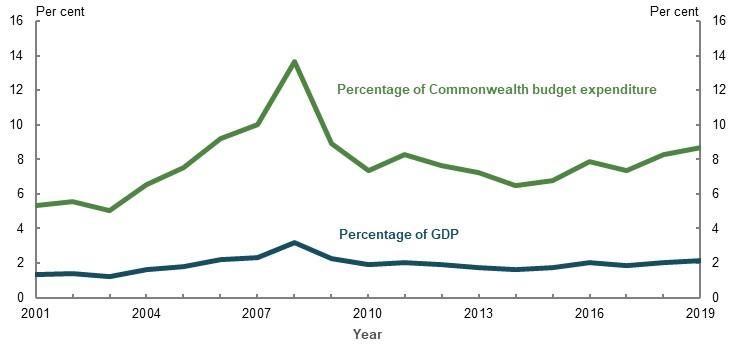
Retirement Income Review Final Report

Other costs of the retirement income system
A range of other costs are incurred in supporting retirement outcomes. Some of these are not large
by themselves (compared to the Age Pension and superannuation tax concessions), but they are
numerous and can add up to a substantial cost.
• Government superannuation co-contributions have fallen substantially in real terms, from
  $819 million in 2010-11 to $121 million in 2018-19.246 This is mostly the result of changes in 2011
  that: reduced the income threshold; halved the maximum co-contribution a person could receive
  to $500 a year; and reduced the co-contribution rate from 100 per cent to 50 per cent of the
  personal contributions made (The Treasury, 2011).
• The system has several tax concessions targeted at lower-income earners, including the low
  income superannuation tax offset, the low income spouse contribution offset and the tax-free
  status of Government co-contributions. The estimated cost of these concessions is aggregated but
  the low income superannuation tax offset is by far the largest. The aggregate cost of all these tax
  concessions has been relatively stable in real terms at around $200 million a year since 2011-12.247
• The seniors and pensioners tax offset reduces the tax paid for eligible seniors and pensioners.
  Since 2012-13, the cost of this tax concession has been relatively steady in real terms at around
  $800 million a year.248 Seniors and pensioners tax offset recipients also benefit from a higher
  Medicare Levy threshold, although the cost of this is not separately reported. The distribution of
  these benefits is covered in 3A. Income and wealth distribution.
• Since 2005, people aged over 65 have received a more generous private health insurance rebate
  than others. The Grattan Institute estimated the cost of this at $250 million in 2015-16 (Daley, et
  al., 2016, p. 34).

Social transfers in kind
Government provision of social transfers in kind improves retirement outcomes by decreasing
retirees’ effective living costs (see 2A. Achieving a minimum standard of living in retirement). This
may not be well understood in the community (see 5A. Cohesion). Social transfers in kind reduce or
fully cover the costs people would be required to pay to access a range of essential services, such as
health and aged care. Some social transfers in kind are universal and some are targeted to people
and cohorts based on eligibility criteria (often based on a means assessment). Social transfers in kind
are provided by all levels of government in Australia.
The most comprehensive valuation of in-kind support currently available is social transfers in kind
compiled by the ABS. Social transfers in kind includes non-monetary transfers in the form of
education, health, social security and welfare, housing and electricity (ABS, 2018c).249 The measure
attributes the value of these transfers on a per household basis.
The value of social transfers in kind attributed to all households has increased in real terms, as has
the share attributed to households where the reference person was aged 65 and older (Chart 4A-8).
In 2003-04, almost $27 billion of social transfer in kind expenditure was attributable to households
aged 65 and over compared with $55 billion in 2015-16, representing growth in real terms of

246
    Note: Values are in 2018-19 dollars, inflated by CPI. Source: Analysis of (ATO, 2020a).
247
    Note: Values are in 2018-19 dollars, inflated by CPI. Source: Tax Expenditures Statement 2004 to 2017 (The
Treasury, 2018b); Tax Benchmarks and Variations Statement 2018 to 2019 (The Treasury, 2020).
248
    Note: Values are in 2018-19 dollars, inflated by CPI. Source: Tax Expenditures Statement 2004 to 2017 (The
Treasury, 2018b); Tax Benchmarks and Variations Statement 2018 to 2019 (The Treasury, 2020).
249
    Education includes school and tertiary, and other education benefits. Health includes acute care institutions,
community health services, pharmaceuticals, private health insurance rebate and other health benefits. Social
security and welfare includes childcare assistance and other social security benefits. Excludes all cash transfers.

382
Sustainability
106 per cent. Social transfers in kind attributed to households aged 65 and over as a percentage of
GDP has increased from 2.3 per cent in 2003-04 to 3.3 per cent in 2015-16. This is higher than the
cost of the Age Pension as a percentage of GDP.
Chart 4A-8 Social transfers in kind
Note: Values are in 2015-16 dollars, inflated by CPI. Source: Analysis of Government Benefits, Taxes and Household Income
2003-04 to 2015-16 (ABS, 2018c).
Health and aged care comprise the largest social transfers in kind attributed to people aged 65 and
over by the Commonwealth Government.
Health transfers
At the Commonwealth level, most health transfers are Medicare, the Pharmaceutical Benefits
Scheme and public hospitals (Parliamentary Budget Office, 2019a). Demand for and therefore
expenditure on these three health services increase as people age (Chart 4A-9).
Chart 4A-9 Commonwealth health care costs per person
Note: 2017-18 Source: (Parliamentary Budget Office, 2019a).
Government expenditure on the Pharmaceutical Benefits Scheme for older Australians has remained
relatively stable as a percentage of GDP (Chart 4A-10). People aged 65 and over account for around
383Retirement Income Review Final Report
50 per cent of Pharmaceutical Benefits Scheme spending,250 receiving more prescriptions and a
greater subsidy per script (Department of Health, 2013, p. 43). Growth in the Pharmaceutical
Benefits Scheme has been fairly muted over the past two decades as a result of successive reforms
that reduced the price to Government of Pharmaceutical Benefits Scheme medicines (Department of
Health and Ageing, 2010).
Chart 4A-10 Commonwealth health expenditure
Pharmaceutical Benefits Scheme Medicare
Note: The increase in total Pharmaceutical Benefits Scheme expenditure in 2015-16 and 2016-17 is due to the listing of
treatments for hepatitis C on the Pharmaceutical Benefits Scheme from 1 March 2016. Source: Analysis of (Department of
Health, 2019b); data provided by the Department of Health; and data provided by The Treasury for the review.
Government expenditure on Medicare has increased for Australians aged 65 and over. The share of
expenditure attributed to people aged 65 and over grew from 28 per cent in 2002-03 to 37 per cent
in 2018-19 (Department of Health, 2019b). Growth in Medicare spending has been suppressed since
2013, when the indexation of various listings to the Medicare Benefits Schedule was paused.
Indexation recommenced in 2019.
Research suggests health costs are primarily driven by technological improvements, such as
developing new treatments, rather than the ageing population (Parliamentary Budget Office, 2019a).
Higher national incomes are also associated with increased health spending (Parliamentary Budget
Office, 2019a). Wealthier countries show a preference for more or higher-quality health care. The
extent to which these factors drive Commonwealth health spending partially depends on
Government policy, such as decisions to add new listings to the Pharmaceutical Benefits Scheme or
Medicare.
Aged care
Aged care is the largest social transfer in kind attributed to older Australians, at a cost of
$20.1 billion in 2018-19, and a projected cost of $25.4 billion by 2022-23 (Productivity Commission,
2020b, p. 14.3; Aged Care Financing Authority, 2019). Government expenditure has increased by an
average of 4.7 per cent a year since 2012-13 (Chart 4A-11). Aged care expenditure has increased as a
percentage of GDP from 0.8 per cent in 2009-10 to 1.1 per cent in 2018-19.
250
Analysis of data provided by the Department of Health for the review, 2002-03 to 2018-19.
384Sustainability
Chart 4A-11 Government expenditure on aged care services
Note: Values are in 2018-19 dollars, inflated by CPI. Source: Analysis of (Productivity Commission, 2020b) and data provided
by The Treasury for the review.
Most of the cost associated with aged care comes from residential care, which accounted for
around 65 per cent of total expenditure in 2018-19 (Department of Health, 2019a). Most home care
consumers and a large proportion of residential aged care consumers are full-rate Age Pension
recipients (Tune, 2017), which reduces the amount they are required to contribute to the cost of
their care (Box 4A-3), (see Box 5A-6 in 5A. Cohesion for more information about aged care means
testing).
Box 4A-3 Aged care and the retirement income system
The aged care system is not part of the retirement income system, but the two systems interact. Aged care
basic daily fees are determined by the rate of Age Pension (set at 17.5 per cent of the single rate of the
Age Pension for home care and 85 per cent for residential care).
Many people find it challenging to estimate and plan for the cost of their aged care (Aged Care Financing
Authority, 2018). The actual costs can vary significantly depending on the type of and length of time spent in
care. People also find it difficult to estimate their likelihood of requiring care or how means testing may apply
to them.
As outlined in Appendix 6A. Detailed modelling methods and assumptions, health and aged care costs do not
significantly increase during retirement. Consumer costs of aged care are relatively low overall under current
funding arrangements. Fees for home care and residential care are means tested. The majority of people pay
only a small fraction of the total cost of the care they receive (see Box 5A-6 in 5A. Cohesion for full details of
aged care means testing).
For people who pay the basic daily fee for home care (83 per cent in 2018-19), the average fee is $73 per week
or $3,813 per year. Fewer than half of home care providers charge the maximum allowable daily fee. Only
11 per cent of home care consumers pay income-tested care fees, averaging an additional $70 per week or
$3,675 per year. The Government contributes between 72 per cent and 93 per cent of the cost of a home care
package, depending on the level of care the person needs. In total, the Government covers more than
90 per cent of the cost of all home care provided.251
At age 65, the lifetime risk of admission to residential care is 39 per cent for men and 53 per cent for women.
Lifetime risk is generally increasing because more people are surviving to an age (beyond 80) where they may
need high-level care. Since peaking around 2011-13 (at 40 per cent for men and 55 per cent for women),
251
Analysis of data provided by the Department of Health for the review.
385Retirement Income Review Final Report
lifetime risk has declined slightly.252 This is likely due to the increased preference for and availability of home
care, rather than a reduction in overall care needs.
More than one-third of people exit residential care within 12 months, but the average length of stay is around
three years (Aged Care Financing Authority, 2019).
All residential aged care consumers pay the basic daily fee set at 85 per cent of the single rate of Age Pension
($19,071.25 per year at 1 May 2020). Around half of residents pay some or all of their accommodation costs
(Aged Care Financing Authority, 2019). One-third of residents also pay means-tested care fees. In 2018-19, the
average weekly means-tested fee was $173 (around $9,000 per year). Overall, the Government covers up to
81 per cent of the costs of care in a residential setting, depending on the level of care needed. 253
Residential aged care subsidies and supplements
Category or area of assistance
Level of assistance Activities of daily living Behaviour ($) Complex health care ($)
needed ($)
Nil Nil Nil Nil
Low 13,753.20 3,142.65 6,099.15
Medium 29,948.25 6,515.25 17,377.65
High 41,489.55 13,581.65 25,090.10
Note: Daily Aged Care Funding Instrument subsidy rates as at 1 May 2020. These figures have been annualised and do not
include temporary additional daily amounts. Consumer assistance needs are assessed against each category, with the total
Government contribution calculated accordingly. For example, the Government contribution for a consumer needing
high-level assistance with activities of daily living and behaviour, but without complex health care needs, would be
$55,071.20 ($41,489.55 + $13,581.65 + $0). Source: (Department of Health, 2020b).
Concession cards
Concession cards provide the basis for other forms of social transfers in kind governments provide.
Concession cards are not directly linked to the retirement income system but serve a broader
purpose of subsidising the living costs of lower-income earners.
Most Australians of Age Pension eligibility age (81 per cent)254 are eligible for a concession card,
either as supplementary assistance to the Age Pension or by meeting an income test.255 The three
types of card (Pensioner Concession Card, Commonwealth Seniors Health Card and Health Care Card)
all provide similar benefits at the federal level. State and territory and local governments provide
most concessions to Pensioner Concession Card and Health Care Card holders. This is because the
cards are directly linked to social security payments and holders have to meet more stringent means
test requirements.
Estimating the value of social transfers in kind from concession cards at a state and territory level is
challenging as each government independently determines the types of concessions offered, who
can access them and how benefits are reported. As a result, the concessions vary by state and
territory. For example, Victoria offers a 50 per cent reduction on council rates while Tasmania offers
30 per cent (Victorian Government, 2020; Tasmanian Government, 2017). Given these differences,
historical and future costs of social transfers in kind to concession-card holders have not been
estimated or projected.
252
Analysis of data provided by the Department of Health for the review.
253
Analysis of data provided by the Department of Health for the review.
254
As at June 2019, using ABS population projections for people over Age Pension eligibility age. Includes
Department of Veterans’ Affairs.
255
People over Age Pension eligibility age who are not eligible for the Age Pension but do meet an income test
may be eligible for a Commonwealth Seniors Health Card.
386Sustainability
Projected future costs
The total projected cost of Age Pension expenditure and superannuation tax concessions together
is estimated to grow from 4.6 per cent of GDP today to 5 per cent by 2060. With Age Pension
expenditure falling and contributions tax expenditure stable as a percentage of GDP, the overall
increase is projected to be due to growth in earnings tax concessions (Chart 4A-12). By 2047, the cost
of superannuation tax concessions is projected to be greater than the cost of the Age Pension as a
percentage of GDP.
Chart 4A-12 Total projected system cost
Note: Includes service pensioners. The tax concessions time series is presented to illustrate the general trend. The cost of tax
concessions is estimated independently each year (i.e. there is no dynamic impact of the removal of concessions over time).
Earnings tax concessions includes the concessional taxation of superannuation earnings and capital gains tax discount for
superannuation funds (broadly C1 and C4 in the Tax Benchmarks and Variations Statement). Contributions tax concessions
includes the concessional taxation of employer and personal contributions (broadly C2 and C3 in the Tax Benchmarks and
Variations Statement). Projections in MARIA broadly follow the methodology of the Tax Benchmarks and Variations
Statement but have been calculated on an additive basis. The value of superannuation tax concessions is estimated by adding
contributions and earnings to taxable income in two stages and applying the progressive income tax rates at each stage. The
value of the earnings tax concession is the difference between the total value of concessions and value of contributions tax
concessions. Personal income tax thresholds are also indexed for movements in wages beyond the medium-term period.
Source: Treasury estimates for the review using MARIA.
The projections in this chapter are long term and do not take into account the potential short-term
effects of the COVID-19 Pandemic. Box 4A-4 offers an illustration of how a large, but short-term,
shock to superannuation might impact the retirement income system in the long term using
Treasury’s MARIA.
Box 4A-4 The long-run impact of a large short-term shock to the retirement
income system
The models used in this review to understand long-term trends in the retirement income system are based on
historical data and the economic outlook for Australia at the time of the 2019-20 Mid-Year Economic and Fiscal
Outlook.
The review examined the impact of a large short-term shock to superannuation assets. The shock is not
projecting the impact of the COVID-19 Pandemic, which remains uncertain, but provides a stylised path of a
short-run shock on the system over the long term. The shock includes a:
• 20 per cent reduction in superannuation balances in 2020
• 50 per cent reduction in superannuation fund earnings in 2020 and 2021
387Retirement Income Review Final Report
• 90 per cent reduction in voluntary pre- and post-tax contributions to superannuation in 2020
Broadly, the scenario sees superannuation funds under management fall sharply, eventually leading to higher
Age Pension expenditure as a percentage of GDP than the baseline (Chart 4A-13). By 2036, the gap in projected
Age Pension expenditure is highest, at under 0.2 per cent of GDP. As superannuation assets converge back to
the baseline path, the gap in Age Pension expenditure falls.
Chart 4A-13 Shock analysis projections
Superannuation assets under management Age Pension expenditure
Source: Treasury estimates for the review using MARIA.
Age Pension
Age Pension expenditure as a percentage of GDP is expected to fall moderately over the next
40 years, from 2.5 per cent today to 2.3 per cent in 2060 (Chart 4A-14).256 This is despite the
population over Age Pension eligibility age being expected to grow faster than the working-age
population, leading to fewer working-age people for each person of Age Pension eligibility age.
256
Analysis of Age Pension expenditure in this section includes service pensioners.
388Sustainability
Chart 4A-14 Age Pension projections
Age Pension expenditure Working-age persons to persons of
Age Pension eligibility age
Note: Includes service pensioners. The volatility in the early years of the projection is mostly due to the legislated future
increases to the Age Pension eligibility age. ‘Working-age’ refers to all persons aged 15 and over but under the Age Pension
eligibility age. Source: Treasury estimates for the review using MARIA; population projections provided by the Centre for
Population, The Treasury as at December 2019.
The fall in the cost of the Age Pension as a percentage of GDP is primarily driven by the maturing of
the superannuation system and the effect of means testing. The share of the Age Pension age
population receiving a pension (Age Pension, service, carer and disability pensions) is projected to
fall from 73.5 per cent in 2020 to 62 per cent in 2060 (Chart 4A-15).257 Within this, the combination
of the maturing superannuation system and the design of the means tests leads to a projected shift
towards part-rate age pensioners: from an estimated 37.6 per cent of age pensioners today, to
62.5 per cent of age pensioners in 2060.
Chart 4A-15 Projected Age Pension eligibility age population
Note: Includes service, carer and disability pensioners. Source: Treasury estimates for the review using MARIA.
257
The estimate of 74 per cent has not been re-benchmarked to either recent actuals or the 2019-20 MYEFO
forward estimates.
389Retirement Income Review Final Report
In future, increasing numbers of part-rate age pensioners are projected to have their payment
determined by the assets test rather than the income test. In 2020, an estimated 37.3 per cent of
part-rate age pensioners were asset tested. By 2060, this is projected to rise to 66.7 per cent.
These changes will be supported by growth in superannuation balances. Over the next 40 years, the
average superannuation balance for a single person is projected to grow at a compound annual
average real rate of 3.8 per cent a year. This outstrips projected growth in the singles means-test free
areas (which increase in line with the CPI) and cut-offs (that increase faster than CPI because of
growth in the maximum rate of the Age Pension258) (Chart 4A-16).
Chart 4A-16 Projected assets and Age Pension means test thresholds, single retirees
Note: Values are in 2019-20 dollars, deflated by the CPI. The single, home owner assets test parameters are chosen for
illustrative purposes. Similar trends would be evident using other configurations (e.g. couple, non-home owner income test).
‘Assessable’ non-superannuation assets refers to non-superannuation assets that are assessable in the Age Pension assets
test. Source: Treasury estimates for the review using MARIA.
Means testing and higher superannuation balances play an important role in reducing reliance on,
and therefore the cost of, the Age Pension. If the composition of Age Pension recipients in 2060
remained the same as in 2020 (46 per cent full-rate age pensioners and 28 per cent part-rate age
pensioners), Age Pension spending would be projected to be 3.6 per cent of GDP in 2060, instead of
2.3 per cent.259
Superannuation tax concessions
As the superannuation system grows, the cost of contributions tax concessions as a percentage of
GDP is projected to remain stable, while earnings tax concessions as a percentage of GDP are
projected to grow (Chart 4A-17).
Broadly, the future cost of contributions tax concessions is a function of wage growth, contributions
rates and population growth. Concessional contributions caps and the additional contributions tax
258
As the maximum rate goes up, there is more payment to ‘taper through’ before the cut-off is reached. To
illustrate, the single home owner assets test cut off is projected to grow at an average annual real rate of
0.7 per cent, compared to the free area, which is indexed to CPI and therefore does not grow in real terms. This
means the tapered area widens over time, helping to explain why the share of part-rate pensioners is projected
to increase.
259
This estimate implicitly assumes no changes in home ownership and couples status rates for the
Age Pension eligibility age population.
390Sustainability
paid by the top 1.8 per cent of people in employment (in the form of Division 293 tax), help to
contain contributions tax concessions.
The cost of earnings tax concessions is a function of the growth in the size of the superannuation
system and the projected rate of return. Both of these inputs exceed projected GDP growth.
Therefore, earnings tax concessions are projected to grow as a percentage of GDP. In particular, the
cost of the earnings tax exemption in the retirement phase is likely to grow as the superannuation
system matures.
Chart 4A-17 Projected cost of superannuation tax concessions
Note: The tax concessions time series is presented to illustrate the general trend. The cost of tax concessions is estimated
independently each year (i.e. there is no dynamic impact of the removal of concessions over time). Earnings tax concessions
includes the concessional taxation of superannuation earnings and capital gains tax discount for superannuation funds
(broadly C1 and C4 in the Tax Benchmarks and Variations Statement). Contributions tax concessions includes the concessional
taxation of employer and personal contributions (broadly C2 and C3 in the Tax Benchmarks and Variations Statement).
Projections in MARIA broadly follow the methodology of the Tax Benchmarks and Variations Statement but have been
calculated on an additive basis. The value of superannuation tax concessions is estimated by adding contributions and
earnings to taxable income in two stages and applying the progressive income tax rates at each stage. The value of the
earnings tax concession is the difference between the total value of concessions and value of contributions tax concessions.
Personal income tax thresholds are also indexed for movements in wages beyond the medium-term period. Source: Treasury
estimates for the review using MARIA.
Superannuation fees
Accurately projecting trends in superannuation fees is challenging. On balance, future decreases in
fees as a per cent of assets are likely as the industry consolidates and the regulatory environment
shifts. Anticipating this outcome, industry projections from Rice Warner suggest fees could fall by as
much as 0.3 per cent of assets over the coming decade (Chart 4A-18). Such a fall would represent an
acceleration relative to historical trends. The Productivity Commission (2018a) found that, over the
decade to 2017, fees as a share of assets fell by only around 0.2 per cent of assets.
The Productivity Commission (2018a) also noted that current fee levels are unnecessarily high and
that there is scope for further reductions without compromising members’ outcomes. If fee levels do
not fall, total fee revenue as a percentage of GDP is projected to double to be around 2 per cent by
2060.260
260
Treasury estimates for the review using MARIA.
391Retirement Income Review Final Report
Chart 4A-18 Projected superannuation fees
Note: Values are in 2019-20 dollars, deflated using CPI. Source: Treasury estimates for the review using MARIA; Analysis of
Rice Warner estimates for the review.
Social transfers in kind
Projections of social transfers in kind have not been undertaken. However, medium-term projections
of health and aged care costs under current policy settings are regularly prepared by the
Parliamentary Budget Office (PBO). The latest PBO expenditure projections from 2018-19 to 2029-30
indicate that: Pharmaceutical Benefits Scheme expenditure will decline by 0.2 per cent as a
proportion of GDP; and Medicare and aged care spending will increase by 0.1 per cent and
0.2 per cent of GDP, respectively.
Aged care expenditure is particularly at risk of increasing faster than GDP as it is more sensitive to
the impact of ageing than health care. Over the decade to June 2029, population ageing is projected
to increase annual average growth in aged care spending by around 1.8 percentage points, compared
with 0.5 percentage points for health (Chart 4A-19).
The effect of ageing on aged care expenditure is projected to peak as the baby boomer generation
reach their 80s, from 2030 (Parliamentary Budget Office, 2019a, p. 15).
Chart 4A-19 Projected average annual real growth in aged care spending
Note: Medium-term projections for the period June 2019 to June 2029. Source: (Parliamentary Budget Office, 2019a).
392Sustainability
Stakeholders expressed concerns about the sustainability of the aged care system. This concern is
raised directly in the recent Legislated Review of Aged Care 2017 (the Tune Review) stating:
‘Currently, the government provides around three-quarters of all aged care
funding, with consumers meeting less than a quarter of the cost. This is likely to be
unsustainable into the future and there is a strong case to increase the proportion
of the costs that are met by consumers.’ (Tune, 2017, p. 8)
The Aged Care Funding Authority (ACFA) (2019) has also identified some challenges with the
sustainability of the aged care system from a funding perspective, including the need for equitable
contributions to costs by consumers.
The shift in consumer preferences from residential care to home care, which costs the Government
less than residential care, is expected to help improve the affordability of the aged care system for
taxpayers (Parliamentary Budget Office, 2019a, p. 16; Aged Care Financing Authority, 2019). The
Royal Commission into Aged Care Quality and Safety is currently considering aged care costs. The
final report of the Royal Commission is due to be released on 12 November 2020.
Cost-effectiveness
The cost-effectiveness of the retirement income system is best assessed by the efficiency with which
Government support produces adequate retirement outcomes. The Age Pension and superannuation
tax concessions make up most of the monetary support in the retirement income system.
Age Pension support is based on a person’s means in retirement. Superannuation tax concessions
increase with income, contributions during working life and investment earnings.
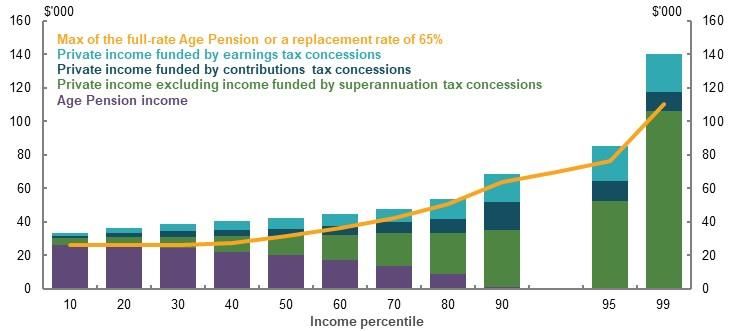
The Age Pension delivers or supports adequate retirement incomes for the bottom two-thirds to
three-quarters of income distribution (see 2C. Maintaining standards of living in retirement).
Superannuation tax concessions contribute to adequate replacement rates for the top 50 per cent
of households in terms of the income distribution (Chart 4A-20). However, superannuation tax
concessions have the most significant impact on the retirement incomes of the top 10 per cent of the
income distribution, as earnings tax concessions grow strongly. As noted in Appendix 6A. Detailed
modelling methods and assumptions, stakeholders agree that higher-income earners can maintain
their standard of living with lower replacement rates.
Chart 4A-20 Projected composition of average annual retirement incomes
Note: Incomes are deflated in line with the review’s mixed deflator. See Appendix 6A. Detailed modelling methods and
assumptions. Private income includes superannuation and non-superannuation savings. The ‘private income funded by tax
concessions’ components are estimated by projecting retirement incomes with contributions and earnings taxed at marginal
rates separately. Source: Cameo modelling undertaken for the review.
393Retirement Income Review Final Report
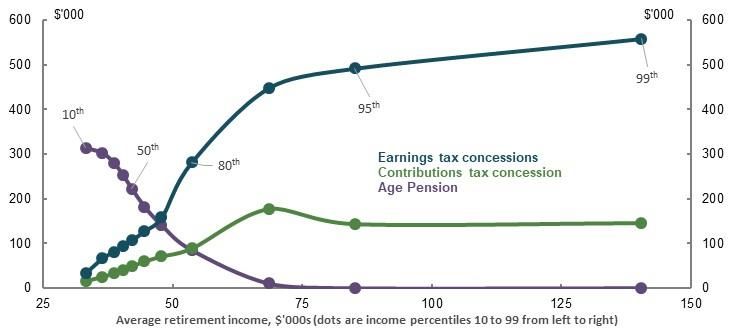
People with higher retirement incomes receive the most tax concessions over a lifetime (Chart 4A-
21). Controls on contributions tax concessions result in lifetime support flattening as retirement
incomes increase. Earnings tax concessions continue to increase as average retirement incomes
increase, particularly from the 70th to 95th percentiles. These projections do not include post-tax
voluntary contributions. If included, they would further increase the lifetime earnings tax
concessions support provided to the upper percentiles, as they are most likely to make post-tax
voluntary contributions (see 3A. Income and wealth distribution).
Chart 4A-21 Projected average annual retirement incomes and lifetime Government support
Note: Y-axis values (lifetime Government support) are deflated to 2019-20 dollars using with the review’s GDP deflator. X-axis
values (average retirement incomes) are deflated using the review’s mixed deflator. See Appendix 6A. Detailed modelling
methods and assumptions. Source: Cameo modelling undertaken for the review.
Aside from providing adequate retirement incomes, three other rationales for tax concessions have
been proposed:
1. As an incentive for additional savings. As outlined in 5A. Cohesion, the evidence suggests
tax concessions are of limited effectiveness in increasing people’s overall savings. Instead,
they appear to encourage people to reallocate existing savings, or savings they would have
made in any case, into superannuation.
2. As compensation for preservation. Tax concessions are poorly targeted as compensation
for preservation. Contributions tax concessions are received disproportionately by people
with higher balances, who are either close to or above the preservation age, rather than
those furthest away (Chart 4A-22). These people typically make large voluntary
contributions. Total superannuation contributions increase with income and age up until
retirement, with the size of increases jumping most noticeably after age 50 (see 3A.
Income and wealth distribution).
The result is that contributions tax concessions are accessed most by older people with
higher balances as they approach retirement. From 2012-13 to 2016-17, a typical
55-year-old (59 in 2016-17) with a balance in the top decile, received more than $20,000 in
contribution concessions in real terms (with more than half coming from voluntary
contributions). By 2016-17, this individual’s balance was around $1.1 million.
3. To reduce Age Pension spending. The cost of tax concession support over a lifetime is
projected to outweigh the associated Age Pension savings (Chart 4A-23). This is true for
either of the contributions and earnings tax concessions alone, and both together. This
result does not alter even assuming salary sacrifice contributions are redirected to
consumption in the absence of tax concessions.
394Sustainability
Chart 4A-22 Cumulative superannuation contribution concessions over five years, averages by
age and superannuation balance decile
Note: Values are the average cumulative concessions for the period 2012-13 to 2016-17 and are presented in 2016-17 dollars,
inflated by CPI. The review estimates concessions as the estimated increase in tax if contributions were all made from post-tax
income. Cumulative refers to the total concessions received across the five years under observation. Tax settings in both
scenarios are tailored to the year under observation. Data are from before the 2016-17 reforms; however, the highest average
annual concessional contribution for a cohort observed in the data is below the revised $25,000 cap. The changes to the
contributions caps are unlikely to have affected the trends in voluntary contributions. Source: Longitudinal data provided by
the ATO for the review.
Chart 4A-23 The interaction of tax concessions and Age Pension spending over a lifetime
Contributions Earnings Combined
concessions only concessions only
Note: Values are in 2019-20 dollars, deflated using the review’s GDP deflator. See Appendix 6A. Detailed modelling methods
and assumptions. Source: Cameo modelling undertaken for the review.
Potential effects of changing trends
The system’s sustainability is affected by changes in trends. Three scenarios were modelled against
the baseline to estimate the effect on Government expenditure, the Age Pension population and
individual retirement outcomes:
395Retirement Income Review Final Report
• Lower earnings. A 1 percentage point reduction in investment returns across all asset classes.261
• Lower wages. A 1 percentage point reduction in nominal wages growth.
• Lower fees. A faster (than that modelled above) reduction in annual superannuation fees
charged.
These scenarios are partial and do not account for flow-on effects that would likely occur in the
wider economy. For example, lower returns are likely to be accompanied by lower GDP growth.
Broader macroeconomic relationships have not been modelled. The results presented are designed
to provide insight into the first-order effects of alternative assumptions.262
More detail and results from these scenarios can be found in Annex — scenario analysis.
Lower earnings
The lower earnings scenario assumes superannuation earnings are one percentage point lower
across all asset classes than assumed in the baseline.
Lower earnings are projected to lead to lower superannuation balances and therefore higher
Age Pension expenditure. While higher Age Pension payments partially offset the impact of lower
superannuation balances for lower and median percentiles,263 average retirement incomes fall across
the population (Chart 4A-24).
Chart 4A-24 Projected effect of lower earnings
Age Pension spending Change in average retirement incomes
(selected percentiles)
Source: Analysis of Rice Warner estimates for the review.
261
For example, where Australian shares were previously assumed to return 7.9 per cent per year, they are
now assumed to return 6.9 per cent per year.
262
In particular, the partial nature of these scenarios makes them ill-suited to projecting the effects of
alternative trends on tax concessions. Tax concessions estimates are dependent on a correctly estimated tax
benchmark, which is linked to broader economic conditions.
263
Percentiles are calculated as a composite of income and wealth. See Appendix 6A. Detailed modelling
methods and assumptions.
396Sustainability
Lower wages growth
This scenario assesses the impact of wages growing at 2.5 per cent, instead of the baseline
assumption of 3.5 per cent.
As with lower earnings, lower wages are projected to lead to lower superannuation balances, higher
Age Pension expenditure and lower retirement incomes (Chart 4A-25). However, the impact of lower
wages is more gradual than that of lower earnings, as lower wages lead to lower contributions, which
take time to feed through to retirement outcomes.
Chart 4A-25 Projected effect of lower wages
Age Pension spending Change in average retirement incomes
(selected percentiles)
Source: Analysis of Rice Warner estimates for the review.
In this scenario, the growth in Age Pension expenditure is partially offset by the fact the lower wages
assumption also affects the Age Pension indexation. With lower wages growth, growth in the
maximum payment rate of Age Pension is also subdued.
More broadly, lower wages do not materially impact replacement rates, given lower wages decrease
living standards across both working life and retirement.
Lower fees
This scenario considers a situation where both fixed and percentage of asset-based fees are reduced
to the lowest fees of a particular sector (industry, retail and corporate), reflecting faster than
expected consolidation and stronger competition within each sector. In aggregate, this leads to fees
reducing to 0.53 per cent of system assets by 2059, rather than 0.64 per cent in the baseline.
Lower fees are projected to slightly reduce Age Pension expenditure as a percentage of GDP and
improve retirement incomes across the population (Chart 4A-26). The effect of lower fees on overall
retirement incomes is smaller than the effect on balances at retirement (the latter detailed by the
Productivity Commission (2018a)). This is because the latter does not account for the offsetting
impact of the Age Pension.
397Retirement Income Review Final Report
Chart 4A-26 Projected effect of lower fees
Age Pension spending Change in average retirement incomes
(selected percentiles)
Source: Analysis of Rice Warner estimates for the review.
Public confidence
The public has to have confidence in the retirement income system for it to be sustainable. Public
confidence is shaped by people’s beliefs about whether the system will both deliver an adequate
retirement income for them and generate adequate outcomes across society.
Public confidence can be undermined by poor system integrity or by people experiencing, expecting
or perceiving poor outcomes or uncertainty in policy settings. A lack of public confidence that policy
settings are delivering on expectations could lead to public demands for reform.
System integrity
Concerns about the integrity of the retirement income system can undermine public confidence.
Integrity and governance failures identified over the past decade include ‘fees for no service’,
misconduct by superannuation trustees and non-payment of superannuation by employers.
Concerns have led to numerous inquiries and investigations, including the Royal Commission into
Misconduct in the Banking, Superannuation and Financial Service Industries (Hayne Royal
Commission).
The Hayne Royal Commission report (2019) and the Productivity Commission report (2018a) also
questioned the effectiveness of regulators in protecting superannuation members from harm. The
Productivity Commission found a lack of transparency around fees and performance.
The period of the Hayne Royal Commission hearings was associated with large flows of funds from
retail superannuation funds to industry superannuation funds (Rice Warner, 2018). For example,
$10.9 billion was transferred from retail funds in 2018, up from $3.5 billion in 2017 (Australian
Prudential Regulation Authority, 2019b). This suggests the misconduct aired during the hearings
undermined confidence in at least part of the superannuation sector. That said, overall, most people
still trust superannuation. One survey found around 60 per cent of members trust their
superannuation fund to act in their best interests (Qantas Super, 2019). Another survey found most
398You can also read