Personal Consumption Percentages in Australia - Current Tables for 2018 - Michael J Lee CA, Julia Bossert CA and Corey Plover * 25 January 2018 ...
←
→
Page content transcription
If your browser does not render page correctly, please read the page content below
Personal Consumption
Percentages in Australia -
 Current Tables for 2018

   Michael J Lee CA, Julia Bossert CA and Corey Plover *
                     25 January 2018

     Introduction by Professor Emeritus Harold Luntz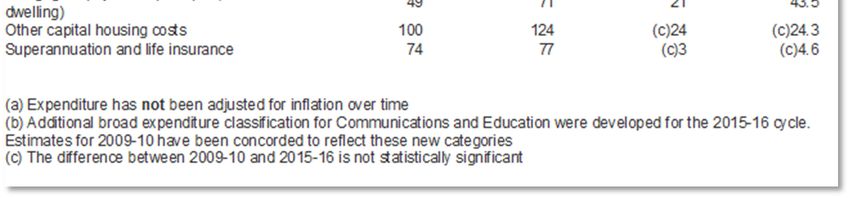
Introduction for Personal Consumption Percentages in Australia - Current
 Tables for 2018 by Michael J Lee CA, Julia Bossert CA and Corey Plover

                                                          Harold Luntz

Over 200 years ago, an English judge, Lord Ellenborough, said that in a civil court, the death of a human
being could not be complained of as an injury.1 Five years ago the High Court of Australia concluded
that this was still the common law position prevailing in Australia and that any further changes were a
matter for the legislature.2 Of course, there have been changes by legislatures all over the common law
world. They commenced in England with the Fatal Accidents Act 1846, which resulted from the efforts
of Lord Campbell, who, as a young barrister had reported the decision of Lord Ellenborough.3 The
Fatal Accidents Act 1846 was copied in all Australian jurisdictions and has been amended and re-
enacted many times. Only in Tasmania and Western Australia does it bear the name Fatal Accidents
Act; in New South Wales it is called the Compensation to Relatives Act; in Victoria, Part III of the
Wrongs Act; and in Queensland, the Civil Proceedings Act 2011 (Qld) Pt 10. But everywhere the
legislation is known as ‘Lord Campbell’s Act’.

Lord Campbell’s Act was in a sense an early form of class action, since in ordinary circumstances it
permitted the executor or administrator of the deceased’s estate to sue on behalf of certain close relatives
of the deceased. However, it gave no guidance as to how those people were to be compensated. It merely
permitted the court to ‘give such damages as the court may think proportioned to the injury resulting
from such death to the parties respectively for whom and for whose benefit such action shall be
brought’.

What is the nature of the ‘injury’ to which the damages must be ‘proportioned’? Grief, bereavement or
other mental suffering? Loss of companionship or society? After some difference of opinion, a court
presided over by Lord Campbell, by then the Chief Justice of the Queen’s Bench, ruled that damages
for non-pecuniary loss of this type were not to be awarded.4 As it was later put by a member of the
House of Lords, the assessment ‘is a hard matter of pounds, shillings and pence, subject to the element
of reasonable future probabilities’.5 What has to be ascertained is the reasonable expectation of benefit
which those for whose benefit the action is brought would have had if the death had not occurred.6
These people are often called ‘dependants’, but, as has been pointed out in the High Court,7 they need
not have been dependent on the deceased, as long as they had a reasonable expectation of benefiting
from the deceased in monetary terms, or from services that have a monetary value.8

1
  Baker v Bolton (1808) 1 Camp 493.
2
  Barclay v Penberthy [2012] HCA 40; (2012) 246 CLR 258.
3
  The history of the Act and the role of Lord Campbell is well told by P Handford, "Lord Campbell and the Fatal Accidents Act" (2013) 129
Law Quarterly Review 420.
4
  Blake v Midland Railway Co (1852) 18 QB 93; 118 ER 35. See De Sales v Ingrilli [2002] HCA 52; (2002) 212 CLR 338 at [55] per
Gaudron, Gummow and Hayne JJ.
5
  Davies v Powell Duffryn Associated Collieries Ltd [1942] AC 601 (HL) at AC 617 per Lord Wright.
6
  De Sales v Ingrilli [2002] HCA 52; (2002) 212 CLR 338 at [14] per Gleeson CJ, [57] per Gaudron, Gummow and Hayne JJ (citing with
approval Windeyer J in Parker v Commonwealth [1965] HCA 12; (1965) 112 CLR 295 at CLR 307-8), [91] per McHugh J, [183] per
Callinan J.
7
  De Sales v Ingrilli [2002] HCA 52; (2002) 212 CLR 338 at [12] per Gleeson CJ.
8
  Nguyen v Nguyen [1990] HCA 9; (1990) 169 CLR 245; De Sales v Ingrilli [2002] HCA 52; (2002) 212 CLR 338 at [13] per Gleeson CJ,
[93], [96] per McHugh J.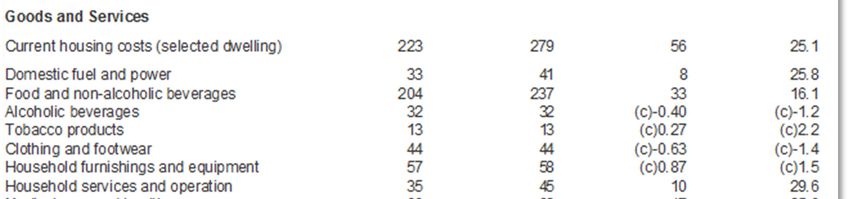
In early cases the court recognised also that the death of the deceased often brought with it financial
benefits to the surviving members of the family, such as from life insurance policies that the deceased
had taken out. These financial benefits had to be set off against the lost expectations.9 Perhaps reacting
against the harshness of the decision of the courts to allow damages for pecuniary loss only, legislatures
have more and more instructed the courts to ignore different sorts of benefit accruing on the death, so
that these days in most jurisdictions few benefits are taken into account on the debit side of the ledger.10

How are we to measure the reasonable expectation of benefit? The starting point is inevitably what the
deceased would have earned, which needs to be estimated subject to the contingencies or ‘vicissitudes
of life’.11 After the Ipp Report,12 some legislatures placed a cap on the deceased’s earnings, so that they
may be taken into account only up to a particular multiple (two or three) of average weekly earnings.
As with most of the legislation implementing – and extending – the Ipp Report, there is inconsistency
among the statutes in the definition of ‘average weekly earnings’. Some legislatures have placed the
cap on the claimant’s earnings, which I am sure is a drafting mistake, but which the High Court, by a
majority of 3:2 reversing the NSW Court of Appeal, has held means what it says: Taylor v Owners–
Strata Plan No 11564.13

The first issue in this case was whether the restrictions on damages in the Civil Liability Act 2002
(NSW) ‘relate to the death of … a person’. By the time it reached the High Court, it was no longer
contested that damages under Lord Campbell’s Act do fall within this description and the High Court
unanimously accepted that that was so. The question then arose whether in applying s 12 of the CLA in
an action under the 1897 Act, the phrase ‘the claimant’s gross weekly earnings’ (to which the cap of
three times average weekly earnings applies) in s 12 should be interpreted in a way that the cap applies
to the deceased’s gross weekly earnings. While a minority in the High Court favoured such an
interpretation,14 the majority rejected it. French CJ, Crennan and Bell JJ held that the language of the
Civil Liability Act 2002 (NSW) s 12(2), requiring the court to disregard the claimant’s earnings that
exceeded three times average weekly earnings (as there defined) had to be interpreted literally when
considering ‘loss of expectation of financial support’. Their Honours accepted the view that it would
operate in, what the trial judge described as a ‘rare’ case, where a high-earning spouse (or other entitled
relative) reasonably gave up work in order to replace the child care services previously provided by the
deceased. In such a case, their Honours said, the claimant’s earnings might be used to value the lost
services.15 However, one would expect that the duty of the claimant to mitigate the loss would require
that such an arrangement be allowed only for a relatively short time until lower-cost child care services
could be engaged.

The reference to the claimant’s earnings in the CLA raises no problem in personal injury cases, where
the injured person is the claimant. In actions under Lord Campbell’s Act legislation, however, the
claimant is not the deceased but the personal representative or a dependant of the deceased.

9
  Public Trustee v Zoanetti (1945) 70 CLR 266 at CLR 282 per Dixon J; Parker v Commonwealth [1965] HCA 12; (1965) 112 CLR 295 at
CLR 307-8, cited approvingly in De Sales v Ingrilli [2002] HCA 52; (2002) 212 CLR 338 at [57] per Gaudron, Gummow and Hayne JJ. See
also McHugh J in De Sales at [92].
10
   See H Luntz, Assessment of Damages for Personal Injury and Death, 4th ed, Butterworths, Sydney, 2002, Chap 9, Section 5.
11
   See De Sales v Ingrilli [2002] HCA 52; (2002) 212 CLR 338 at [14]-[15], [32] per Gleeson CJ, [66] per Gaudron, Gummow and Hayne
JJ, [96] per McHugh J, [186] per Callinan J (Gleeson CJ, McHugh and Callinan JJ all dissented on the principal issue in the case, viz
whether allowance is to be made for the prospect of the surviving partner gaining support in the future from a new partner).
12
   Commonwealth of Australia, Review of the Law of Negligence: Final Report, Canberra, 2002, .
13
   [2014] HCA 9; (2014) 253 CLR 531.
14
   Taylor v Owners - Strata Plan No 11564 [2014] HCA 9; (2014) 253 CLR 531 at [64]-[71] per Gageler and Keane JJ, interpreting the
phrase as the gross weekly earnings on which the claimant relies in the claim for damages.
15
   Taylor v Owners - Strata Plan No 11564 [2014] HCA 9; (2014) 253 CLR 531 at [44].
Nevertheless, the majority’s explanation of why the cap might have been imposed on the claimant’s
earnings rather than the deceased’s would presumably be applied to the requirement to disregard the
plaintiff’s gross earnings that exceeded twice average weekly earnings (as there defined) in the
Competition and Consumer Act 2010 (Cth) s 87U, which, under s 87E, applies to product liability
claims under the Australian Consumer Law Pt 3-5 (liability of manufacturers for goods with safety
defects) (in which exclusive jurisdiction is conferred on the Federal Court: Competition and Consumer
Act 2010 (Cth) ss 138, 138B(2)(b), 138C(3)(b)) and Div 2 of Pt 5-4 (action for damages against
manufacturers of goods). This is despite claims under Pt 3-5 being dealt with under the state or territory
version of Lord Campbell’s Act if the injured person dies: Australian Consumer Law s 138(3). Thus in
New South Wales CLA cases and in cases falling under the Commonwealth Act, there would then be
no cap on the earnings of the deceased, which in the paradigm case, as stated above, is the starting point
for calculating the loss to the dependants.16 The effect of this decision is that in an action under the 1897
Act the cap imposed by s 12 of the CLA applies to the earnings not of the deceased but of the person
bringing the action (usually the deceased’s executor or administrator).

Prior to Taylor, the same literal interpretation of ‘claimant’ had been taken in respect of a dependants’
claim for the loss of domestic services. Pt 2 of the CLA has two provisions dealing with gratuitous
domestic services: s 15, which deals with services provided to an injured person, and s 15B, which deals
with services provided by an injured person. The provision that is more apt to apply to a dependants’
claim for loss of services that the deceased had provided to them is s 15B, which in fact expressly covers
the case of services provided to dependants of an injured person. However, s 15B refers to the ‘loss of
the claimant’s capacity to provide gratuitous domestic services’. In a case involving a claim by
surviving young children for the loss of their mother’s services, a judge in the NSW Supreme Court
interpreted ‘claimant’ in s 15B literally and thus concluded that s 15B could not apply in an action under
Lord Campbell’s Act legislation since the claimant in such an action has not lost any capacity to provide
services.17 Instead, the judge applied s 15 and denied the children damages for the loss of services that
the deceased had provided to them, on the ground that s 15(2)(c) excludes damages in respect of
gratuitous attendant care services provided to the ‘claimant’ unless the services would not be provided
to the claimant but for the injury.18 This interpretation of s 15(2)(c), adopted by another judge in the
NSW Supreme Court after the High Court’s decision in Taylor (but without reference to it),19 is
consistent with, and indeed gains support from, the majority’s decision in Taylor. But this view leads
to an exclusion of damages for the loss of services in every wrongful-death case to which the CLA
applies, since it is the very basis of a claim by the dependants of a deceased for loss of services that the
services would have been provided but for the death. It is hoped that the literal interpretation of
‘claimant’ in Pt 2 of the CLA will be corrected by the New South Wales legislature and will not be
adopted in relation to the Wrongs Act 1958 (Vic) Pt VB, which also uses the term ‘claimant’.

The restriction on damages in s 12(2) of the Civil Liability Act 2002 (NSW), which was the subject of
interpretation in Taylor’s case, differs from that in the Motor Accidents Compensation Act 1999 (NSW)
s 125 (since 1 December 2017, Motor Accident Injuries Act 2017 (NSW) s 4.6) and the Workers
Compensation Act 1987 (NSW) s 151I clearly does apply to the deceased’s earnings in claims under
Lord Campbell’s Act. The Civil Liability Act 2002 (Tas) s 26, however, probably falls into the same
category as the Civil Liability Act of NSW, as interpreted by the High Court, since it states that where
‘a person is entitled to damages in respect of loss of earning capacity or where a claim for damages is
made pursuant to the Fatal Accidents Act 1934, a court must not award those damages on the basis the
person was, or may have been capable of, earning income at greater than 3 times the adult average
weekly earnings’ (emphasis added). However, there is more room for argument here that where the
claim is under the Fatal Accidents Act, ‘the person’ refers to the deceased, in which case the Tasmanian
legislation is to be interpreted in the same way as the law described in the next paragraph.

16
   Taylor v Owners - Strata Plan No 11564 [2014] HCA 9; (2014) 253 CLR 531 at [9], [41]-[44] per French CJ, Crennan and Bell JJ.
17
   Goddard v Central Coast Health Network [2013] NSWSC 1932 at [205].
18
   Goddard v Central Coast Health Network [2013] NSWSC 1932 at [199].
19
   Coote v Kelly [2012] NSWSC 219 at [174]-[179].
Earnings of the deceased in excess of the cap must clearly be disregarded in Western Australia and the
two territories.20 There is some room for argument in Western Australia and the Australian Capital
Territory that the cap may also be applied to the beneficiary’s earnings where those are relevant because
of the scenario postulated by the majority of the High Court in the principal case as a means of valuing
the services of the deceased when they are replaced by a high-earning partner giving up work.

In other instances, the cap is applied to the amount the court may award: Workers’ Compensation and
Rehabilitation Act 2003 (Qld) s 54 (for loss of earnings, thus arguably for loss of the earnings either of
the deceased or the beneficiary, whichever is relevant); Civil Liability Act 1936 (SA) s 54(3) (for
economic loss; therefore including loss of services); Wrongs Act 1958 (Vic) s 28F (similar to
Queensland (maximum for each week of loss of earnings), but the recent repeal of the reference to
‘claimant’ probably indicates that it is only the deceased’s earnings that are relevant).

In Taylor,21 as pointed out above, the court noted that the judge at first instance, having referred to the
typical or paradigm Lord Campbell’s Act claim as being ‘one arising out of the death of the principal
income earner … acknowledged that there may be cases in which the income of the claimant is relevant
to the assessment but he considered such cases to be “very rare indeed”’. One of those rare cases was
in the course of being tried when the principal case was decided by the High Court, which caused the
parties to adopt stances diametrically opposed to those from which they had started.22 In that case, the
plaintiff, a gynaecologist with an expanding practice, sought over $800,000 in damages in the Supreme
Court for the death of her husband through alleged negligence by the defendant in failing to provide
him with a liver transplant. Despite overcoming all the difficulties of proving negligence and causation
relating to the death, which were admitted soon after the trial began, she recovered only $21,757, was
denied her own costs, had to pay the defendant’s costs on one aspect of her claim and had to pay
indemnity costs to the defendant after a date in 2014 when the defendant offered to pay her $100,000
without admission of liability.23 Her appeal to the New South Wales Court of Appeal was dismissed
with costs, while the defendant was refused leave to cross-appeal.24 The Court of Appeal quoted
passages from the judgment of McHugh J in De Sales v Ingrilli25 and held that the evidence on which
the trial judge had relied had been based on the table of dependency ratios derived from household
expenditure surveys in the fourth edition of my book (referred to below) and there was no reliable
evidence before him that the deceased’s consumption would not have risen proportionately as the family
income increased, despite the intuitive appeal of such a proposition.The deceased’s earnings are
considered post-tax, on the assumption that no benefit could be conferred on the beneficiaries out of the
tax compulsorily paid.26

20
   Civil Liability Act 2002 (WA) s 11; Civil Law (Wrongs) Act 2002 (ACT) s 98; Personal Injuries (Liabilities and Damages) Act (NT) s 20
(where ‘the injured person’ obviously refers to the deceased in a Lord Campbell’s Act claim); compare Kaplantzi v Pascoe [2003] NSWCA
386; (2003) 40 MVR 146, applying the cap under the Motor Accidents Compensation Act 1999 (NSW) s 125 as at the date of the award.
21
   Taylor v Owners - Strata Plan No 11564 [2014] HCA 9; (2014) 253 CLR 531 at [15].
22
   Norris v Routley [2015] NSWSC 1875 at [37].
23
   Norris v Routley [2016] NSWSC 147.
24
   Norris v Routley; Routley v Norris [2016] NSWCA 367.
25
   De Sales v Ingrilli [2002] HCA 52; (2002) 212 CLR 338.
26
   Lincoln v Gravil (1954) 94 CLR 430 at 438, 442.
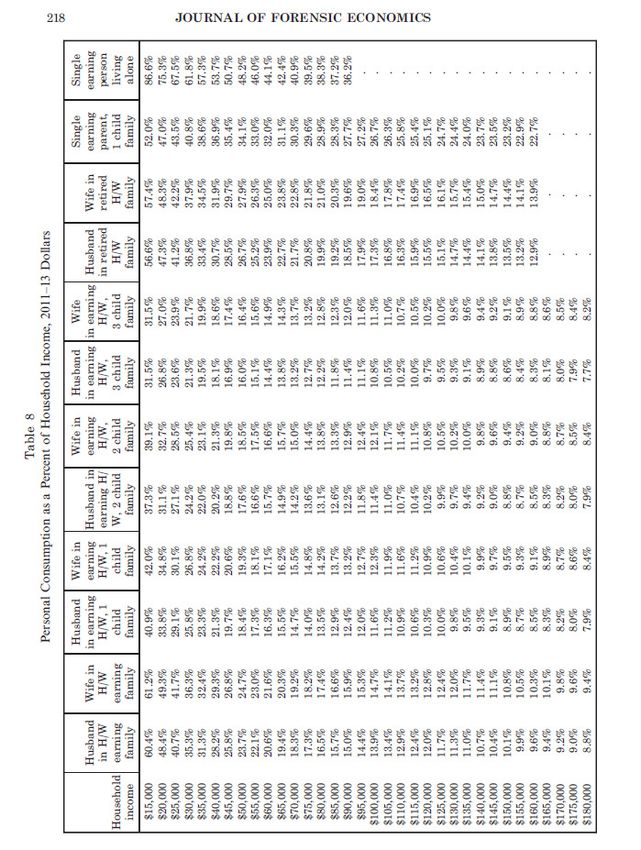
Theoretically, the court is then concerned to ascertain in each individual case how much of the
deceased’s net income would have been spent for the benefit of each beneficiary, of which past
expenditure may be the best evidence.27 Contributions that the family share, such as for housing, are not
apportioned, but are assumed to benefit all, even though the deceased would also have benefited. With
most families the assumption is made that they would have spent all their earnings or, if they had saved
— for instance, through compulsory superannuation — the savings would have accrued to the same
beneficiaries, though possibly in different proportions. ‘Unless the income of the deceased was very
high, the evidence showing the relatives' benefit at the time of death will probably be determined by
taking the deceased's income and deducting an amount to cover the cost of the deceased's food, clothing
and personal expenditure.’28 But evidence as to the precise expenditure of the deceased is seldom
reliable, particularly when the trial occurs years after the death, and whether any past expenditure
pattern would have continued in the future is even more doubtful.29 English courts have recognised the
unreliability of such evidence and the waste of court time that delving into the minutiae entails. They
have consequently devised rules of thumb under which they assume that for such periods as there are
no children in the family, the deceased would have spent one-third of the income exclusively for his or
her own benefit and two-thirds for the benefit of the partner, including shared benefits. During a period
when there are children, the deduction for the deceased’s own expenditure is reduced to 25%. When
both partners were earning, the net income of the two are added, the same percentage is applied to the
joint income and then the survivor’s income is deducted. It has been held that the court is obliged to
adopt this method30 in all but the most exceptional case.31 It was recently adopted in New South Wales
in a case where the parties agreed that English law (apparently including procedural matters of this
kind) applied.32

Although sometimes applying similar rules of thumb, Australian courts have been more receptive to the
acceptance, as evidence of what the deceased would have spent for the benefit of other members of the
family, statistical tables based on surveys of household expenditure conducted by the Australian Bureau
of Statistics.33 The history of some of the tables is recounted in the paper which follows and which seeks
to update them. Two points should be noted. The ABS now makes available information on expenditure
of families in each decile of family income and the expenditure does vary between deciles. As McHugh
J noted, averages may not be suitable for very high earners (though such cases would now mostly be
capped under the Civil Liability Acts). Secondly, the High Court has in a related area held that
projections by the ABS of future patterns (in that case of life expectancy) may be more accurate than
statistics based on the past and such accuracy should be encouraged.34

27
   De Sales v Ingrilli [2002] HCA 52; (2002) 212 CLR 338 at [17] per Gleeson CJ (citing Nance v British Columbia Electric Railway Co Ltd
[1951] AC 601 (PC) at 614-15), [67] per Gaudron, Gummow and Hayne JJ, [186] per Callinan J.
28
   De Sales v Ingrilli [2002] HCA 52; (2002) 212 CLR 338 at [96] per McHugh J.
29
   De Sales v Ingrilli [2002] HCA 52; (2002) 212 CLR 338 at [97] per McHugh J.
30
   Coward v Comex Houlder Diving Ltd (CA, Ralph Gibson, Butler-Sloss LJJ, Sir Edward Eveleigh, 18 July 1988, unreported); Knauer v
Ministry of Justice [2014] EWHC 2553 (QB).
31
   Cox v Hockenhull [1999] 3 All ER 577 (couple living on social welfare benefits, including rent).
32
   O'Reilly v Western Sussex NHS Trust (No 6) [2014] NSWSC 1824.
33
   See the cases cited in H Luntz, Assessment of Damages for Personal Injury and Death, 4th ed, Butterworths, Sydney, 2002499 n 142; and
also Axiak v Pezzano [2002] NSWCA 65; (2002) 35 MVR 424 at [53]-[59] (‘the table … has become a standard reference point’, and judge
not in error in choosing from within range shown, though it did not sit comfortably with other evidence in case); Alderson v Commonwealth
of Australia (NSW SC, Ireland J, 10 June 1993, unreported); Thornton v Lessbrook Pty Ltd [2010] QSC 308at [62] (dealing with
hypothetical situation of deceased having children in future). Compare De Sales v Ingrilli [2002] HCA 52; (2002) 212 CLR 338 at [96] per
McHugh J (‘more sophisticated evidence, based on Household Expenditure Surveys of the Australian Bureau of Statistics’).
34
   Golden Eagle International Trading Pty Ltd v Zhang [2007] HCA 15; (2007) 229 CLR 498.
An attempt to put before the NSW Court of Appeal in Norris v Routley,35 as ‘fresh evidence’, my
recognition of the different approach adopted by Michael Lee and Julia Bossert in the paper which
follows was rejected on the basis that the expert evidence on both sides had relied at the trial on the
table in the fourth edition of my book and had not attempted to give evidence of the different approach,
which was already known at the time from seminars such as this. It therefore failed the criterion for the
admission of new evidence on appeal that it could not be discovered with reasonable diligence at the
time of the trial. Although the table in the book had no special evidentiary status, the judge was entitled
in his discretion to use it, a decision with which the court on appeal could not interfere.

In the future, there will be no excuse for not putting before the court the alternative approach adopted
in the tables which follow and the court may have to choose between that approach and one based on
the old method but updated to take account of the latest household expenditure survey by the ABS.

35
     Norris v Routley; Routley v Norris [2016] NSWCA 367 .
EXECUTIVE SUMMARY
This paper utilises the most recent Household Expenditure Survey data collated by the ABS (2015 / 2016)
to prepare current personal consumption percentages, and also incorporates many of the suggestions
from our peers on the allocation of expenditure items.
The most recent data released by the ABS shows that compared to the previously published 2009 / 2010
data, household incomes have increased, and the most significant increases in expenditure
predominately relate to items which are non-divisible in nature (e.g. Mortgage Repayments, Education,
Household Services and Operations (e.g. Child Care), Other Capital Housing Costs (e.g. Rental
Properties)). In contrast, expenditure on many items of personal consumption (divisible items) such as
alcohol, tobacco and clothing have not materially increased or have declined. As a result, the personal
consumption percentages have decreased since the publication of our previous paper in February 2016.
Consistent with our previous papers on this topic, we have calculated personal consumption percentages
that are expressed as a percentage of after-tax household income, and therefore allows for the possibility
that a household may not spend every dollar that it earns (i.e. that it accumulates savings).
We highlight the following two (2) issues which should be given specific considerations based on the
individual circumstances of each matter to which the percentages are to be applied:
(i) Our personal consumption percentages have been prepared based on the assumption that the
only savings in motor vehicle costs as a result of the death of the deceased would be a proportion
of fuel costs, and repairs and maintenance. Should the information regarding the deceased’s
household indicate that an additional motor vehicle was exclusively used by the deceased prior to
their death and then disposed of as a result of the death of the deceased, we are of the opinion
that the percentages stated below should be increased by, on average, 4.3%; and
(ii) We are of the opinion that the personal circumstances of the deceased’s intended retirement
should be considered. Should it be the case that the household’s income level would likely result
in the deceased being a “self-funded” retiree, we are of the opinion that a deduction should be
made to the calculated loss of financial dependency to represent the savings arising from the
household no longer being required to fund the deceased’s retirement.The following tables set out our estimates of personal consumption based on differing levels of income
and household composition:
2 PARENT FAMILIES – PERSONAL CONSUMPTION EXPRESSED AS PERCENTAGE OF AFTER-
TAX HOUSEHOLD INCOME
Weekly Income (before tax) Number of Children
0 1 2 3
1st Decile $ 339 N/A N/A N/A N/A
2nd Decile $ 590 N/A N/A N/A N/A
3rd Decile $ 823 25.1% N/A N/A N/A
4th Decile $ 1,101 23.0% 18.9% 16.1% 14.2%
5th Decile $ 1,429 21.9% 18.0% 15.4% 13.5%
6th Decile $ 1,792 21.3% 17.5% 14.9% 13.1%
7th Decile $ 2,204 19.8% 16.2% 13.8% 12.1%
8th Decile $ 2,758 17.7% 14.5% 12.4% 10.8%
9th Decile $ 3,559 17.4% 14.2% 12.1% 10.7%
10th Decile $ 6,295 15.0% 12.3% 10.5% 9.2%
All Households $ 2,086 19.2% 15.8% 13.4% 11.8%
* Adjustment for additional motor vehicle (if exclusively used by the deceased): Add 4.3% to above percentages
Table 1
1 PARENT FAMILIES – PERSONAL CONSUMPTION EXPRESSED AS PERCENTAGE OF AFTER-
TAX HOUSEHOLD INCOME
Weekly Income (before tax) Number of Children
1 2 3
1st Decile $ 339 N/A N/A N/A
2nd Decile $ 590 N/A N/A N/A
3rd Decile $ 823 N/A N/A N/A
4th Decile $ 1,101 32.3% 25.4% 21.3%
5th Decile $ 1,429 30.7% 24.2% 20.3%
6th Decile $ 1,792 29.8% 23.4% 19.5%
7th Decile $ 2,204 27.7% 21.7% 18.1%
8th Decile $ 2,758 24.7% 19.4% 16.2%
9th Decile $ 3,559 24.3% 19.1% 15.9%
10th Decile $ 6,295 21.0% 16.4% 13.7%
All Households $ 2,086 26.9% 21.1% 17.6%
Table 2
N/A – we do not believe personal consumption percentages for these deciles / household compositions can reliably
be used and therefore have excluded them from our calculationsA CHRONOLOGY OF STUDIES
We note the following relevant chronology in relation to the recent studies / developments in relation to
dependency / personal consumption percentages in Australia:
Circa 2001 - Richard Cumpston and Hugh Sarjeant issue paper entitled “Dependency
percentages for two-parent families” utilising the 1998 / 1999 Summarised
Household Expenditure Survey (Cumpston and Sarjeant paper and
tables).
2002 - Professor Luntz’s 4th edition of “Assessment of Damages for Personal
Injury and Death” incorporating the Cumpston and Sarjeant tables is
published.
April 2009 - Hugh Sarjeant and Paul Thomson issue a paper entitled “Dependency
percentages for two-parent and one-parent families” utilising the 2003 /
2004 Summarised Household Expenditure Survey (Sarjeant and
Thomson paper and tables).
January 2012 - Michael J Lee and Julia Bossert issue a paper entitled “Dependency
Percentages in Australia Revisited – Estimating Personal Consumption
using Statistical Data” utilising the 2009 / 2010 Detailed Household
Expenditure Survey for income quartiles (Lee and Bossert 2012 paper
and tables).
January 2015 - Michael J Lee and Julia Bossert issue a paper entitled “Personal
Consumption Percentages in Australia – Current Tables for 2015” (“the
2015 paper”) utilising the 2009/2010 Detailed Household Expenditure
Survey for income deciles (Lee and Bossert 2015 paper and tables).
February 2016 - Michael J Lee, Julia Bossert and Corey Plover issue paper entitled
“Agreed statistical tables for loss of financial dependency in Australia”
(Agreed paper and tables) in which Cumpston Sarjeant abandon
previous tables they have produced and agree with the Lee and Bossert
2015 tables.
THE LATEST HOUSEHOLD EXPENDITURE DATA
The data used in our previous papers are based on the 2009 / 2010 Household Expenditure Surveys
whereas the Luntz tables are based on the 1998 / 1999 Household Expenditure Surveys. This data is
evidently outdated (the latter by around 17 years).
We have obtained household expenditure data from the ABS based on 2015 / 2016 Household
Expenditure Data which is categorised by income deciles (i.e. the data is divided into ten income groups).WHAT HAS CHANGED IN THE LAST SEVEN YEARS?
We make the following general observations about the changes in income and expenditure since the
2009 / 2010 survey (2010 HES) upon which we based the Lee and Bossert 2015 paper and tables.
Changes in Household Income
Since the 2010 HES income for the average household has increased by approximately 24%.
Changes in Household Expenditure Patterns
The changes in Household Expenditure are summarised by the ABS as follows:
Figure 1
Based the generalised categories, it would appear the major increases in expenditure predominantly
relate to items which are non-divisible in nature (e.g. Mortgage repayments, Education, Household
Services and Operations (e.g. Child Care), Other Capital Housing Costs (e.g. Rental properties)).
In contrast, expenditure on many items of personal consumption (divisible items) such as alcohol, tobacco
and clothing have not materially increased or have declined.THE UPDATED ABS DATA
Income Groups
In relation to the above, we note household expenditure is categorised based on the following income
deciles:
Description Weekly Income (Before-tax) Annual Income (Before-tax)
1st Decile $ 339 $ 17,696
2nd Decile $ 590 $ 30,798
3rd Decile $ 823 $ 42,961
4th Decile $ 1,101 $ 57,472
5th Decile $ 1,429 $ 74,594
6th Decile $ 1,792 $ 93,542
7th Decile $ 2,204 $ 115,049
8th Decile $ 2,758 $ 143,968
9th Decile $ 3,559 $ 185,780
10th Decile $ 6,295 $ 328,599
All Households $ 2,086 $ 108,889
Table 3
We acknowledge that the data relates to household expenditure in 2015 / 2016 and, whilst labelled
“detailed tables”, is in a summarised form and not the “micro data” upon which the statistics are produced.
We also note the following other issues in relation to the statistical data:
(i) The profile of persons within the 1st and 2nd deciles would appear to predominantly comprise of
single person households who are not employed and receive income primarily from government
pensions and allowances. The average age of persons in this group is 62 years of age. We would
place little value on the data in estimating personal consumption in loss of financial dependency
cases and accordingly have not produced percentages for these deciles;
(ii) The profile of persons within the 3rd decile would appear to predominantly comprise of households
with couples without dependent children. The average age of adults in this group is 57 years of
age and over half of households in this group receive income primarily from government pensions
and allowances. We are of the opinion that caution should be exercised in relying upon this data
to estimate personal consumption in loss of dependency cases where children are dependants;
(iii) The profile of persons within the 4th and 5th deciles would appear to predominantly comprise of
households with couples with and without dependent children who receive income primarily from
employment. The average age of adults in this group is 50 years of age;(iv) The profile of persons within the 6th to 8th deciles would appear to predominantly comprise of
households with couples with and without dependent children, with a higher proportion of
households with dependent children compared to lower deciles. Household income in these
groups is primarily received from employment with some government pensions and allowances
(presumably family tax benefits). The average age of adults in these groups is 45 years of age;
(v) The profile of persons in the 9th and 10th deciles would appear to predominantly comprise of
households with couples with and without dependent children. Household income in these groups
is primarily received from employment and income from government pensions and allowances is
minimal. The average age of adults in these groups is 47 years of age; and
(vi) The data does not outline the number of motor vehicles owned and operated in each income decile.
Any conclusions drawn from the available statistical data regarding dependency would appear to be most
reliable when applied to households of a similar composition.
FEEDBACK / CRITICISMS OF PREVIOUS PAPERS
Since the publication of our previous papers, we have received feedback from a number of our colleagues
and peers who work within the forensic accounting area. The majority of the feedback we have received
has been in support of the approach we have adopted and the resultant personal consumption
percentages. However, we acknowledge that the support has not been universal and address the areas
of criticism.
In the main the criticisms have fallen in three categories, namely:
(i) It is different from and / or more complicated than the previous approach contained within Professor
Luntz’s 4th edition of “Assessment of Damages for Personal Injury and Death” (Differing
Approach);
(ii) The allocations of what Household Expenditure constitutes personal consumption (Allocations);
and
(iii) The methodology that should be adopted in determining personal consumption (Preferred
Methodology).
We address each of these issues separately hereunder.
DIFFERING / MORE COMPLICATED APPROACH
It is suggested that because the approach adopted (namely consumption percentages based on income
levels) differs from a constant dependency percentage as set out in Professor Luntz’s 4th edition of
“Assessment of Damages for Personal Injury and Death” it is alleged to be more complicated and should
not be accepted. The alleged complication is that we use percentages depending on income as opposed
to one single percentage regardless of the level of household income.In our opinion, this argument (regardless of the validity or otherwise) is not a sufficient reason to disregard a position. The common law itself has developed over the years by challenging previously held positions, refining positions and in cases rectifying positions that were wrong. Further, we disagree that a methodology which results in a flawed outcome (as we assert the previous dependency percentages to be) should continue to be used solely on the basis that it is perceived to be “simpler”. We highlight that the consulting firm Cumpston Sarjeant Consulting Actuaries, who were the authors of the previously published tables, are of the opinion that all previous tables are outdated and that the Agreed Tables should be used as they more accurately measure personal consumption / loss of financial dependency. ALLOCATIONS Following feedback received and extensive discussions with our colleagues / peers regarding the household expenditure allocations, we agree with and have incorporated some of the suggestions provided to us in regard to the categorisation of personal expenditure items. As detailed in our methodology section, we have now introduced the categories of “Partly Divisible” and “Mostly Divisible” and have amended a number of our expense categorisations (refer Appendix 1). We acknowledge that we have not adopted all of the amendments which were suggested to us, most commonly in respect of the treatment of household items such as blankets and cutlery; nor do we agree with an alternative proposed method of dealing with child-care expenses whereby they are apportioned across all family members (including adults). Further, we continue to be of the opinion that motor vehicle expenses should be considered on a case by case basis and, as detailed below, additional personal consumption should only be added in the situation where a motor vehicle was exclusively used by the deceased. THE PREFERRED METHODOLOGY The fundamental criticism of our approach would appear to be whether personal consumption should be expressed as a percentage of household after-tax income (“the income approach”) or as a percentage of total expenditure (“the expenditure approach”). In our opinion, the expenditure approach should not be adopted for the following reasons: (i) It is contrary to accepted economic principles and data (Economic Principles and Data); (ii) It is contrary to amounts of the personal consumption in the HES (HES Data); and (iii) It is contrary to other studies in this area (Other Studies). We address each of the aforementioned reasons below: Economic Principles and Data General Economic Principles In our previous papers we expressed reservations regarding the underlying methodology of the expenditure approach (i.e. as adopted in the previously published tables), whereby the percentages are determined by dividing personal consumption by total household expenditure. Such an approach implicitly assumes that a household consumes all of its income and does not save. This is often referred to as a “constant” consumption approach.
We strongly disagree with the implicit assumption that in every instance, every additional dollar earned
by a household will be consumed. As Keynes stated in his 1935 book “The General Theory of
Employment, Interest and Money”:
                              “the fundamental psychological law, upon which we are entitled to depend with
                              great confidence both a priori from our knowledge of human nature and from the
                              detailed facts of experience, is that men are disposed, as a rule and on the average,
                              to increase their consumption as their income increases but not by as much as the
                              increase in the income”

The latest statistical data continues to support his proposition. We provide the following graphical
depiction of food as a percentage of household after-tax income:

                                  Food Consumption as a % of Household After-Tax Income
                                                    2015 / 2016 Data
                        35%
   Food Consumption %

                        30%
                        25%
                        20%
                        15%
                        10%
                        5%
                        0%
                                  1st      2nd      3rd      4th     5th      6th      7th      8th      9th     10th
                                                             Household Income Decile

                                                                                                                      Graph 1

The above graph demonstrates that as income increases, food consumption as a percentage of
household income decreases. That is, food consumption is not a constant percentage of household
income.
Whilst the above graph relates specifically to food consumption, the available statistical data would
indicate that this proposition applies to all categories of personal consumption. Accordingly, in our opinion
the adoption of a “constant” consumption percentage across all income levels is contrary to the available
empirical data and therefore an inappropriate basis for the calculation of personal consumption / loss of
dependency percentages.

Savings

As previously noted, one of the implicit assumptions of the expenditure approach is that households
consume all of their income and do not save.
In our opinion this is an inappropriate assumption and inconsistent with available empirical data.
In this regard we note that the authors of the Reserve Bank of Australia discussion paper entitled
“Household Savings in Australia” also took a similar approach using household expenditure data to
conclude that:
“As might be expected, households’ saving ratios tend to increase with income, while
saving is found to decrease with wealth and gearing.”
HES data
Common ground
It is common ground between the expenditure approach and the income approach that the first step to
estimate personal consumption is to analyse the HES data and allocate each item into the respective
categories (i.e. divisible, non-divisible, semi-divisible, etc).
Difference between approaches
The expenditure and income approaches differ when selecting the denominator for calculating the
applicable percentage.
In our opinion the appropriate denominator is after-tax household income. That is, the deceased’s
personal consumption percentage can be estimated as follows:
Statistical level of personal consumption
Household level of after-tax income
This is consistent with the calculations of financial dependency being undertaken on after-tax income.
In contrast, the previous expenditure based approach uses total expenditure (excluding items such as
life insurance, mortgage payments etc.) in place of household after-tax income (i.e. as the denominator).
We do not understand the rationale of excluding certain items of expenditure and note by excluding those
items the consumption percentages increases by approximately 8%.
We agree that such an approach would be appropriate if information were available regarding the total
expenditure of the household however in our experience this is rarely the case.
In our opinion, our preferred approach of calculating personal consumption as a percentage of household
after-tax income provides consistency between the bases on which the percentages are calculated and
to which they are applied (ie. personal consumption is calculated as a proportion of household after-tax
income, and the resultant percentages are applied to household after-tax income).
The discrepancy resulting from using the expenditure based approach
In our opinion, an expenditure based approach results in a material discrepancy in the estimate of loss
of financial dependency.
To illustrate the problem we set out the following example, using the Average Household with two-
parents. For ease, we have adopted our allocations in order to demonstrate the problem with the
approach.In this situation, the analysis of the household expenditure results in estimated personal consumption of
an adult as being the following dollar amounts:
Number of Children Amount
0 $ 319
1 $ 261
2 $ 223
3 $ 196
Table 4
By adopting the expenditure based approach the consumption percentages derived are as follows:
Number of Children Total Expenditure Personal Consumption %
(less Excluded Items) Consumption
0 $ 1,425 $ 319 22.4%
1 $ 1,425 $ 261 18.3%
2 $ 1,425 $ 223 15.7%
3 $ 1,425 $ 196 13.7%
Table 5
Those percentages are then applied to household after-tax income as follows to derive an amount of
personal consumption of an adult:
Number of Children After-tax Income Consumption % Personal Consumption
0 $ 1,690 22.4% $ 378
1 $ 1,690 18.3% $ 310
2 $ 1,690 15.7% $ 265
3 $ 1,690 13.7% $ 232
Table 6
Based on the tables above, it is apparent that:
(i) In the first instance, the HES data estimates personal consumption of an adult to be between
$196 and $319 per week; and
(ii) Using total expenditure (less excluded items) as the denominator (i.e. the expenditure based
approach) results in estimates of personal consumption between $232 and $378 (i.e.
approximately 20% higher than the empirical data).
In our opinion, the expenditure based approach scales the empirical data of the HES by a significant and
unjustifiable degree.
Our analysis suggests the expenditure based approach overestimates personal consumption by
approximately 45% in the 10th decile and underestimates personal consumption by approximately 43%
in the lowest decile.Other Studies
As noted in our previous papers, there have been numerous studies undertaken in Australia, the United
States and Canada36. Those studies appear to use very similar methodologies that are utilised in the
assessment of the loss of financial support suffered upon wrongful death. We have summarised the
findings at Appendix 2 of our paper.
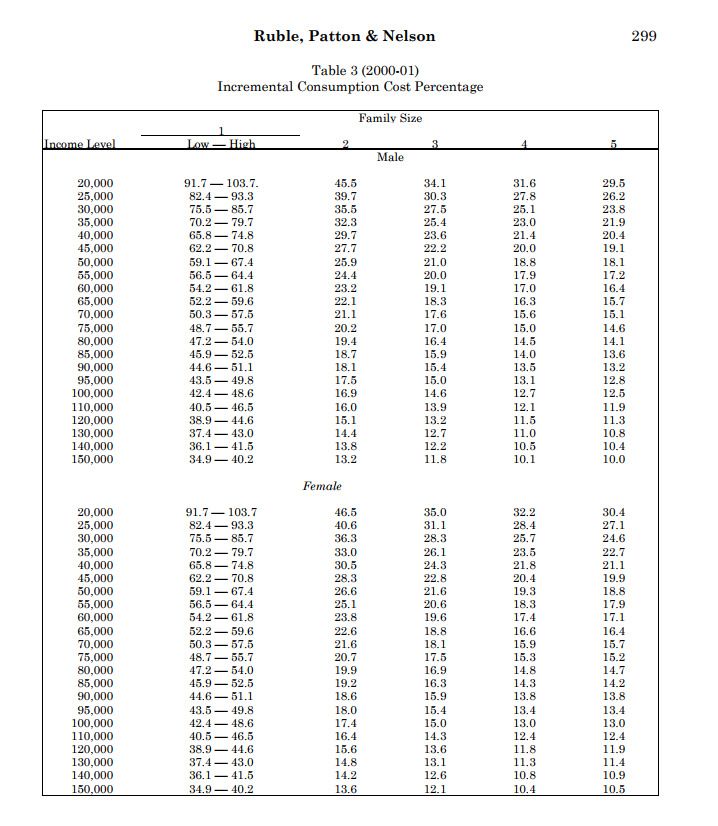
The following table sets out the range of levels of personal consumption percentages under each study:
Study Authors (Year) Number of Children and Percentage of Income
0 1 2 3
Brown (2012) 11.7% - 51.8% 10.4% - 39.2% 9.1% - 36.8% 8.6% - 25.0%
Krueger (2015) 8.8% - 61.2% 7.9% - 42.0% 7.9% - 39.1% 7.7% - 31.5%
Ruble, Patton & Nelson (2002) 13.2% - 46.5% 11.8% - 35.0% 10.1% - 32.2% 10.0% - 30.4%
Table 7
Whilst we do not suggest that the actual percentages in those papers should be adopted in Australia it is
apparent from the studies that personal consumption as a percentage of weekly income decreases as
household income increases.
We are therefore of the opinion that these studies support our assertion that the constant consumption
model is incorrect and should not be adopted.
CONCLUSION
In conclusion, we agree that some additional categories of expenditure would assist in allowing for
improved estimations of personal consumption. As detailed in our methodology section, we have
introduced the categories of “Partly Divisible” and “Mostly Divisible” to take account of this feedback.
We remain of the opinion that the expenditure based approach which assumes constant consumption
percentages is incorrect and should not be adopted for the following reasons:
(i) It is contrary to accepted economic principles and data;
(ii) It arbitrarily changes the level of personal consumption from the underlying information by using
an incompatible denominator; and
(iii) It is at odds with other studies on the topic.
36 See generally Ruble, Michael R, Patton, Robert T, and Nelson, David M, “Patton-Nelson Personal Consumption Tables
2000-2001: Updated and Revised”, Journal of Forensic Economics 15(3), 2002, pp. 295-301, Brown, C.L. (2012) “Personal
Consumption Rates for Canada: Update of 2000 PCRs Using 2007-08 Survey of Household Spending data” Journal of
Forensic Economics 23(2), 2012, pp. 135-157 and Krueger, Kurt V. “Personal Consumption by Family Type and
Household Income”, Journal of Forensic Economics 25(2), 2015, pp. 203-220.METHODOLOGY GENERAL METHODOLOGY ADOPTED / ALLOCATION RULES Consistent with our previous paper, on the basis that financial dependency is generally upon a parent / adult we have excluded expenditure which relates specifically to children (e.g. childcare fees). Subsequent to our 2015 paper we have consulted with other colleagues in relation to household expenditure categories and allocations. Whilst we do not agree with all suggestions provided, we have amended a number of our categorisations and introduced the additional categories of “Partly Divisible” and “Mostly Divisible” expenditure to enable improved estimations of personal consumption. Accordingly, in undertaking our calculations, we have assumed that household expenditure generally falls into the following categories: • Divisible Expenditure; • Mostly Divisible Expenditure (New Category); • Semi-Divisible Expenditure; • Partly Divisible (New Category); • Non-Divisible Expenditure; • Support for Others; and • Asset Accumulating Expenditure. We attach as Appendix 1 a table which outlines the detailed expenditure classifications under each heading and our assumptions and make the following general observations: Divisible Expenditure Divisible expenditure relates to expenses which are divisible amongst the household members. In relation to expenditure ordinarily incurred by adults only (e.g. tobacco, alcohol and gambling) we have assumed that expenses should be shared among the adult members of the household and do not relate to children. We acknowledge that it is likely there may be economies of scale in relation to food and consumables which we have classified as divisible expenditure but are unable to ascertain the extent. Mostly-Divisible Expenditure Mostly-divisible expenditure relates to items which have both fixed and variable components. In our opinion, such expenditure is for the general benefit of the household but also a component of the expenditure could represent consumption of the deceased. For the purposes of our calculations we have assumed that 25% of the expenditure is non-divisible and 75% is divisible (e.g. overseas holidays). Semi-Divisible Expenditure Semi-divisible expenditure relates to items which have both fixed and variable components. In our opinion, such expenditure is for the general benefit of the household but also a component of the expenditure could represent consumption of the deceased. For the purposes of our calculations we have assumed that half the expenditure is non-divisible and the other half is divisible (e.g. motor vehicle fuel).
Partly-Divisible Expenditure
Partly-divisible expenditure relates to items which have both fixed and variable components. In our
opinion, such expenditure is for the general benefit of the household but also a component of the
expenditure could represent consumption of the deceased. For the purposes of our calculations we have
assumed that 75% of the expenditure is non-divisible and 25% is divisible (e.g. electricity).
Non-Divisible Expenditure and Support for Others
Non-divisible expenditure relates to items that are fixed in nature and would not be saved as a result of
the death of a person. In the main, these are best represented by housing and occupancy costs but also
include purchase costs for assets such as motor vehicles and expenditure which is support for others
(e.g. gifts or donations).
Asset Accumulating Expenditure
In our opinion it is important to acknowledge that some items of expenditure may be saved as a result of
the death of an adult but in doing so the corresponding asset will cease to be accumulated (e.g. personal
superannuation contributions). In our opinion, it is appropriate to treat this expenditure as non-divisible.
Adult Expenditure
Consistent with our previous approach and other studies, we have assumed that consumption of an adult
would be twice that of a child.

CALCULATION OF REVISED PERSONAL CONSUMPTION PERCENTAGES
Based on the methodology and classifications outlined above, we determined the dollar value of the
expenditure which is directly attributable to, and would be saved in the absence of, one adult member of
the household.
We then divided this by the total household after-tax income in order to derive the personal consumption
of the deceased as a percentage of the after-tax household income.
We have again limited our tables to households with up to 3 children. For families with 4 or more children,
we suggest that it would not be unreasonable to adopt the percentages for 3 children households for the
purposes of calculating personal consumption.
Further, due to the reasons outlined above, we have not calculated percentages for deciles 1 and 2 and
have limited our calculations for the 3rd decile to 2 person households with no dependants.
2 PARENT FAMILIES – PERSONAL CONSUMPTION EXPRESSED AS PERCENTAGE OF AFTER-
TAX HOUSEHOLD INCOME

   Weekly Income (before tax)                                             Number of Children
                                                       0                    1                   2                       3
   1st Decile                  $ 339                   N/A                  N/A                 N/A                     N/A
   2nd Decile                  $ 590                   N/A                  N/A                 N/A                     N/A
   3rd Decile                  $ 823                25.1%                   N/A                 N/A                     N/A
   4th Decile                  $ 1,101              23.0%                18.9%               16.1%                  14.2%
   5th Decile                  $ 1,429              21.9%                18.0%               15.4%                  13.5%
   6th Decile                  $ 1,792              21.3%                17.5%               14.9%                  13.1%
   7th Decile                  $ 2,204              19.8%                16.2%               13.8%                  12.1%
   8th Decile                  $ 2,758              17.7%                14.5%               12.4%                  10.8%
   9th Decile                  $ 3,559              17.4%                14.2%               12.1%                  10.7%
   10th Decile                 $ 6,295              15.0%                12.3%               10.5%                  9.2%
   All Households              $ 2,086              19.2%                15.8%               13.4%                  11.8%
   * Adjustment for additional motor vehicle (if exclusively used by the deceased): Add 4.3% to above percentages
                                                                                                                            Table 8

1 PARENT FAMILIES – PERSONAL CONSUMPTION EXPRESSED AS PERCENTAGE OF AFTER-
TAX HOUSEHOLD INCOME

   Weekly Income (before tax)                                           Number of Children
                                                              1                        2                            3
   1st Decile                    $ 339                        N/A                      N/A                          N/A
   2nd Decile                    $ 590                        N/A                      N/A                          N/A
   3rd Decile                    $ 823                        N/A                      N/A                          N/A
   4th Decile                    $ 1,101                   32.3%                    25.4%                    21.3%
   5th Decile                    $ 1,429                   30.7%                    24.2%                    20.3%
   6th Decile                    $ 1,792                   29.8%                    23.4%                    19.5%
   7th Decile                    $ 2,204                   27.7%                    21.7%                    18.1%
   8th Decile                    $ 2,758                   24.7%                    19.4%                    16.2%
   9th Decile                    $ 3,559                   24.3%                    19.1%                    15.9%
   10th Decile                   $ 6,295                   21.0%                    16.4%                    13.7%
   All Households                $ 2,086                   26.9%                    21.1%                    17.6%
                                                                                                                            Table 9

N/A – we do not believe personal consumption percentages for these deciles / household compositions can reliably
be used and therefore have excluded them from our calculations
HOW TO CALCULATE FINANCIAL LOSSES
Mathematically the loss of financial dependency is calculated as follows:
Step 1 Determine the Deceased’s Personal Consumption (DPC)
Determine the before and after-tax pool of total household income
Identify the appropriate range of percentages / adopt a percentage
Multiply the after-tax pool of income by consumption percentage
Step 2 Determine the deceased’s notional after-tax income (DNE)
Step 3 Determine loss of financial dependency (DNE – DPC)
We have attached as Appendix 3 a series of examples of how to use the approach.
PUTTING LEVELS OF CONSUMPTION CALCULATED INTO PERSPECTIVE
As previously noted, whilst statistical “percentages” in all studies have been adopted to estimate
consumption and dependency, these values have actually been determined with reference to actual dollar
values and then simply calculated as a percentage of an appropriate denominator (e.g. the total after-tax
household income).
We are of the opinion that this approach will assist practitioners to consider the reasonableness of the
amounts calculated and adjust them as required based on the available information with respect to the
deceased’s personal lifestyle.
As an example, we note the decision of Norris v Routley [2015] NSWSC 883 wherein the adoption of the
expenditure approach (i.e. the “Luntz tables”) resulted in an estimate of the deceased’s personal
consumption being $3,885 per week or $202,052 per year. This amount was asserted to be unreasonably
high and not representative of the deceased’s personal consumption. In the Court of Appeal matter, Mr
Lee estimated the deceased’s personal consumption to be approximately $1,100 per week.Based on the ABS data we note the following underlying estimates of personal consumption as a dollar
value:
2 PARENT FAMILIES – PERSONAL CONSUMPTION EXPRESSED AS A DOLLAR AMOUNT
Weekly Income (before tax) Number of Children
0 1 2 3
1st Decile $ 339 N/A N/A N/A N/A
2nd Decile $ 590 N/A N/A N/A N/A
3rd Decile $ 823 $ 200 N/A N/A N/A
4th Decile $ 1,101 $ 235 $ 193 $ 165 $ 145
5th Decile $ 1,429 $ 278 $ 229 $ 195 $ 172
6th Decile $ 1,792 $ 327 $ 268 $ 228 $ 200
7th Decile $ 2,204 $ 365 $ 299 $ 255 $ 223
8th Decile $ 2,758 $ 397 $ 325 $ 277 $ 243
9th Decile $ 3,559 $ 493 $ 404 $ 344 $ 302
10th Decile $ 6,295 $ 671 $ 549 $ 468 $ 410
All Households $ 2,086 $ 325 $ 266 $ 227 $ 199
Table 10
1 PARENT FAMILIES – PERSONAL CONSUMPTION EXPRESSED AS A DOLLAR AMOUNT
Weekly Income (before tax) Number of Children
1 2 3
1st Decile $ 339 N/A N/A N/A
2nd Decile $ 590 N/A N/A N/A
3rd Decile $ 823 N/A N/A N/A
4th Decile $ 1,101 $ 329 $ 259 $ 217
5th Decile $ 1,429 $ 391 $ 307 $ 257
6th Decile $ 1,792 $ 457 $ 358 $ 299
7th Decile $ 2,204 $ 510 $ 400 $ 333
8th Decile $ 2,758 $ 555 $ 435 $ 363
9th Decile $ 3,559 $ 689 $ 540 $ 451
10th Decile $ 6,295 $ 936 $ 734 $ 612
All Households $ 2,086 $ 455 $ 357 $ 298
Table 11SENSITIVITY OF ASSUMPTIONS – MOTOR VEHICLES
We note that our calculations are based on a series of assumptions. In our opinion, the most material
assumption relates to motor vehicles. Our estimates of personal consumption are based on the
assumption that the only savings in motor vehicle costs as a result of the death of the deceased would
be a proportion of fuel costs, and repairs and maintenance.
We note that considerable debate has ensued as to whether our tables should be presented on the
underlying assumption that households have two motor vehicles, one of which was exclusively for the
use of the deceased. This would appear to be based on recent Census data which suggests that, on
average, households on Census night had garaged approximately 1.8 motor vehicles.
Whilst we acknowledge these statistics, our preferred position is to start with tables based on one (1)
motor vehicle and make an allowance for any additional motor vehicles (if necessary) for the following
reasons:
(i) The Census data includes company motor vehicles which are paid for by an employer and
therefore not a cost to the household or personal consumption;
(ii) The Census data includes motor vehicles which are also for the benefit of dependent children still
living at home;
(iii) The Census data includes motor vehicles which are owned and operated by non-dependent
children still living at home; and
(iv) In our experience Income Tax deductions for motor vehicles is prevalent.
If it was assumed that additional savings did exist (e.g. the household had one less vehicle following the
death of the deceased), then we would estimate that personal consumption would increase by, on
average, 4.3% of the after-tax income of the household.
ALLOWANCE FOR POST RETIREMENT CONSUMPTION
As noted in our previous papers we do not agree with any approach that applies a dependency
percentage to superannuation contributions. Instead we propose that to the extent that a portion of the
deceased’s income was being used to fund their own retirement, it may be appropriate to make an
allowance for the savings in the deceased’s personal consumption from the date of their retirement to
their notional life expectancy.
Whether such a deduction is appropriate is dependent on numerous issues and any loss of financial
dependency on items such as an age pension also requires consideration.
Obviously the level of consumption needs to be considered in light of the deceased’s intended lifestyle
during retirement, of which available income is a significant factor.You can also read