Tax on sugar-sweetened beverages: Perspectives from the field of nutrition - Semantic Scholar
←
→
Page content transcription
If your browser does not render page correctly, please read the page content below
South African Journal for Science and Technology
ISSN: (Online) 2222-4173, (Print) 0254-3486
Page
Page1i of 9ii Oorspronklike
Inhoudsopgawe Navorsing
Tax on sugar-sweetened beverages: Perspectives
from the field of nutrition
Authors: Background: A tax on sugar sweetened beverages (SSBs) was implemented from the 1st
Christine Taljaard, of April 2018 to address overweight and obesity (o/o) and resultant non-communicable
Hester H Vorster
diseases (NCDs) in South Africa (SA). The tax has potentially far-reaching consequences for
Affiliations: consumers as well as industrial and agriculture sectors.
Centre of Excellence for
Nutrition, Faculty of Health
Objectives: This review focuses on: (i) the most recent international and national recom
Sciences, North-West mendations on intakes of added sugars; (ii) contributing factors to o/o; (iii) the ethics of
University, Potchefstroom the tax; (iv) international experiences with similar taxes; and (v) expected advantages and
Campus, Potchefstroom disadvantages.
Corresponding author: Methods: The relevant recent literature is used for a review and discussion of the tax on
Christine Taljaard SSBs in the SA context.
nienatal@gmail.com
Results: The mean intake of added sugars in SA exceeds recommendations. Both o/o and
Dates: non-communicable diseases are problems in SA. A SA study demonstrated the relationship
Received: 24/02/2018 between SSBs and overweight. However, it is uncertain if the intended tax on SSBs, as a
Accepted: 15/08/2018
Published: Pigovian tax, will have benefits for poorer segments of the population. Possible advantages
include additional income generated by the State, lower expenditure on SSBs and medical cost
How to cite this article: savings because of lower prevalence of o/o. The major concern is about potential job losses.
Christine Taljaard,
Hester H Vorster, Tax Conclusions: O/o is the result of complex, multifactorial and transdisciplinary factors and
on sugar-sweetened therefore needs multisectoral and transdisciplinary interventions, of which taxation is but
beverages: Perspectives one. The proposed tax seems ethically sound but there is little evidence that it will reach the
from the field of nutrition,
Suid-Afrikaanse Tydskrif
proposed aims in SA. It is recommended that the government addresses the expected job
vir Natuurwetenskap en losses because of the tax and that implementation and consequence of the tax are monitored
Tegnologie 37(1) .................. and evaluated.
...........................................
Copyright:
© 2018. Authors.
Licensee: Die Suid-
Introduction
Afrikaanse Akademie vir Since April 1, 2018, a tax of 2.1 cents per gram of sugar has been charged in South Africa
Wetenskap en Kuns. This
work is licensed under (SA) on all sugar-sweetened beverages (SSBs) that exceed 4 g sugar/100 ml. The levy is in
the Creative Commons accordance with the Rates and Monetary Amounts and Amendment of Revenue Laws Act,
Attibution License. 2017 (National Treasury 2016b). The purpose of this tax is to decrease the consumption of SSBs
and thus of added sugars, in an attempt to reduce overweight and obesity and the consequent
non-communicable diseases (NCDs) in SA (Economics Tax Analysis Chief Directorate 2016).
The tax also forms part of the Department of Health’s comprehensive strategy to address
overweight and obesity.
Weight gain is a major risk factor for NCDs such as coronary heart disease, hypertension,
stroke, type 2 diabetes mellitus, and some cancers. These diseases are major public health
challenges in SA (Joubert et al. 2007). Sugar intake, especially in the form of SSBs, contributes
to overweight and also tooth decay in children and adults (Brownell et al. 2009; Pan and Hu
2011; World Health Organization 2015a). Prevention of weight gain and NCDs through a
reduced sugar intake, may reduce the burden on SAs public health services, such that the
sugar tax may result in both health and financial benefits.
The tax was welcomed by several institutions (ADSA 2016; South African NCDs Alliance 2016),
but has also been criticised by the producers of sugar (South African Sugar Association 2016)
as well as the marketers of SSBs (BEVSA 2016). The focus of the criticism is that, in a sugar-
producing country such as South Africa, the tax will lead to job losses and that there is not
enough evidence the tax will have the desired outcomes and impact. The research organisation
TIPS (Trade and Industrial Policy Strategies), which facilitates policy development amongst
other things, argues that the possible loss of job opportunities suggested by some critics is
exaggerated, and data have been incorrectly interpreted (Trade and Industrial Policy Strategies
[TIPS] 2016).
http://www.satnt.ac.za 1 Open AccessPage 2 of 9 Oorspronklike Navorsing
In this review you will find brief explanations of the most The average moderately active adult woman needs
recent dietary recommendations regarding added sugars about 8 000 kJ a day and a moderately active man, 10 000
as well as the intake of these sugars in SA. Obesity and kJ. An added sugar intake of ten percent (10%) thus
overweight are then discussed, recognising obesity as a comes to 800 and 1 000 kJ respectively. With a regular
multifactorial problem requiring multi- and transdisciplinary teaspoon (tsp) containing 5 grams of table sugar (sucrose),
interventions. This leads to a discussion of the ethics of the equal to about 85 kJ (Goran and Astrup 2002), the 10%
tax, the arguments for government intervention in dietary maximum recommended added sugar intake is therefore
recommendations through taxes, international experiences approximately 9.4 tsp/day for women and 11.8 tsp/day for
with similar taxes, as well as the expected advantages and men. Five percent is therefore 4.7 tsp/day for women and
disadvantages of the tax. Finally, some recommendations 5.9 tsp/day for men.
are given on further steps to be taken.
This recommendation includes all added sugars including
International and South African honey, syrup, dried and concentrated fruit products,
dried fruits such as raisins, and others, as well as fruit
guidelines for sugar intake concentrates, for example, in fruit juices and jams, together
In 2015, the World Health Organization (WHO) published with other sugars in cakes, tarts, hot and cold desserts,
updated dietary guidelines on sugar intake to combat salad dressing, chutney, pickled fruit and cold drinks. It is
overweight and tooth decay (World Health Organization clear then, that the use of these products should be limited
2015a). A set process was followed (World Health Organi to meet the recommendation.
zation 2014) to ensure that recommendations were based
on the best available scientific evidence. South Africans’ sugar intake
The WHO guidelines on sugar intake (WHO 2015) are as Sugar intake by children
follows: Temple and Steyn (2013) showed in a 1999 national study
that white children (6–9 years old) consumed an average
• The WHO recommends a reduced intake of added
of 67 g of added sugar per day. In comparison, black
sugar over the total life cycle (strong recom
children of the same age group had an intake of 47 g per
mendation*).
day. Jointly, these children have about 5.5% of their total
• In both adults and children, the WHO recommends
energy as added sugars, though in urban areas, they
that added sugars should not be more than 10% of
already exceeded the recommendation with added sugar
the total energy intake**.
at more than 10% of total energy intake. The most common
• The WHO recommends a further reduction of
sources of these sugars (from most to the least) were: table
added sugar intake to less than 5% of total energy
sugar, sugar-sweetened squash (concentrates where water
(conditional recommendation***).
is added), jam, cookies, sugar-sweetened carbonated cold
* Strong recommendation means that when one adheres to the drinks, and breakfast cereals.
recommendation, the desired or beneficial consequences are greater
than any possible adverse effects and that the recommendation Sugar intake by adolescents
can be accepted as a policy in most situations.
MacKeown et al. (2007) showed that adolescents in
** Total energy intake is the sum of all daily intakes of calories/ Gauteng, studied in 2000 (at 10 years of age) and 2003 (at 13
kilojoules of food and drink #. years of age) had an intake of 68 g of added sugars, which
represented 16% of their total energy intake at age 10. By
*** Conditional recommendation means that there is less age 13, this amount had increased to 102 g per day (20% of
certainty about the balance between the benefits and the possible total energy intake).
disadvantages of implementing the recommendation. This
means that substantive debate is needed between all stakeholders Sugar intake by adults
before such a recommendation becomes part of policy and
Temple and Steyn (2013) refer to the CRIBSA study’s
implementation can be accepted.
unpublished data from 1 010 adult participants in four
The South African guideline is part of the SA Food-based urban areas (Townships) in Cape Town. The men had an
dietary guidelines (Temple and Steyn 2013; Vorster et intake of 52 g of added sugars daily (11% of their total
al. 2013) and reflects the WHO recommendations with energy) and the younger women 51 g per day (15% of their
the wording: “Use foods and drinks that contain sugar energy intake). The older women showed a lower intake of
sparingly and not between meals”. It is recommended that 38 g per day (11% of their energy intake).
added sugar should not exceed 10% of total energy (Temple
and Steyn 2013) or 6% of total energy in people that are In the North West Province, changes in dietary intake,
pre-diabetic, obese, or do not regularly consume fluoride, anthropometry and other health outcomes of rural and
such as in drinking water or from fluorinated toothpaste. urban black adults were examined in 2005, 2010 and 2015
Furthermore, it is recommended that no drinks containing in the “Prospective, Urban and Rural Epidemiology”
sugar be given to babies, toddlers and children. (PURE) study. Vorster et al. (2014) reported disturbing
http://www.satnt.ac.za 2 Open AccessPage 3 of 9 Oorspronklike Navorsing
increases in sugar intake over the five-year period from to account for 7% of the 521 000 deaths in SA in 2000 – the
2005 to 2010 (Table I). This is specifically attributed to the fifth biggest cause of death (Norman et al. 2007).
number of people drinking sweetened beverages and the
quantity of these drinks consumed. The intake of sugars The WHO guidelines for intake of added sugars (WHO
as a percentage of total energy in 2010, in most rural and 2015) are based on findings from the international
urban participants, exceeded the recommended amount. literature which indicate that reducing added sugar intake
However, sugars were not the only energy-providing is associated with reduced body weight for adults. This
nutrient for which intake increased, as can be seen by the finding is based on systematic reviews including 30 of 7
increases in total energy intake. 895 randomised controlled intervention studies and 38 of 9
445 cohort studies. Only cohort studies were available for
TABLE I: Consumption of added sugars through the PURE cohort from children, with five studies that met the inclusion criteria. A
2005 to 2010*
meta-analysis of these five studies, that followed children
Variables n Baseline (2005) Follow-up (2010)
for 12 months or longer, has shown that children with the
Energy intake (MJ)
highest intake of SSBs had a significantly greater chance of
Men rural 203 7.3 (6.9, 7.8) 10.3 (9.5, 10.9)
Men urban 205 10.2 (9.6, 10.8) 13.9 (13.2, 14.7)
being overweight or obese, compared to children with the
Women rural 459 6.2 (5.9, 6.4) 9.7 (9.3, 10.2) lowest intake of SSBs (WHO 2015).
Women urban 366 9.2 (8.8, 9.6) 12.0 (11.5, 12.5)
Added sugar (g) In SA the PURE study showed that, between 2005 and
Men rural 203 27.5 (23.2, 31.9) 63.2 (54.6, 71.9) 2010, added sugar intake increased especially from
Men urban 205 44.7 (39.8, 49.5) 74.3 (66.9, 81.1) SSBs. Individuals with added sugar intake above 10% of
Women rural 459 26.7 (24.6, 28.8) 65.7 (58.6, 72.7) their total energy had significantly higher body weight
Women urban 366 47.1 (43.8, 50.4) 78.5 (71.8, 85.1) indices in comparison with those with an intake of added
% Energie v suiker
sugars less than 10% of their energy (Vorster et al. 2014).
Men rural 203 6.9 (5.9, 7.9) 10.5 (9.4, 11.7)
The complexity of the global obesity problem has been
Men urban 205 7.4 (6.7, 8.1) 9.5 (8.6, 10.4)
described by Swinburn et al. (2011) as a consequence of
Women rural 459 7.6 (7.1, 8.2) 11.3 (10.5, 12.2)
Women urban 366 8.8 (8.3, 9.2) 11.2 (10.5, 11 9)
the changes in the global food system, thereby creating
% wat SVKe drink Uit: an “obesogenic” environment in which highly processed
Men rural 203 25 56 food products are increasingly available and affordable.
Men urban 205 60 58 The result is passive excessive consumption of energy
Women rural 459 33 63 and thus obesity. Variation in obesity prevalence between
Women urban 366 65 52 different populations has been explained by differences in
Hoeveelheid koeldrank local and national socio-cultural, economic and transport
(g/dag) environments.
Men rural 69.9 (50.8, 89.1) 98.6 (73.2, 124.0)
Men urban 58.0 (49.0, 70.2) 114.6 (89.2, 134.0)
Figure 1 illustrates, in a customised framework (Swinburn et
Women rural 59.7 (43.7, 57.6) 74.3 (55.5, 93.1)
al. 2011), the factors contributing to overweight and obesity
Women urban 61.3 (48.4, 74.2) 147.7 (142.2, 171.3)
Data is reported as means (95% Confidence Interval)
and the possible solutions to the problem. The framework
*Adapted from Vorster et al. (2014) shows the interaction between environmental, behavioural
and physiological factors that need to be addressed jointly
A review of all diet-related studies conducted on SA adults in health promotion programmes.
for the period 2000 to 2015 by Mchiza et al. (2015) included
thirteen studies. Most focused on the black SA population The systemic and environmental factors on the left of the
with only one study in the Indian population. Worrying framework can promote, amplify, or minimise the effect of
results indicate that all participants exceeded the WHO’s interventions. Most interventions are aimed at moderators
recommendations of 25 g added sugar or 10% of total in the environment or are based on policies. Health
energy (Mchiza et al. 2015). promotion programmes can affect the environment as well
as behaviour, while medication and operations take place
Overweight and obesity on the physiological level. Interventions have a greater
effect on the population if directed toward systemic factors,
This is often expressed as body mass index (BMI), while the political implementation of health promotion
calculated as the weight in kilogram divided by the height programmes and services is more complicated. It is clear
in meters squared. A BMI of 25–29.9 kg/m2 is categorised that added sugars and thus taxes on these sugars are but
as overweight, while people with a BMI equal to or greater one of the factors in this complex problem that need to be
than 30 kg/m2 is classed as obese. There is no doubt that addressed at the population level.
overweight and obesity are a public health problem in both
adults and children in SA (Joubert et al. 2007). Overweight
and obesity are risk factors for various NCDs and estimated
http://www.satnt.ac.za 3 Open AccessPage 4 of 9 Oorspronklike Navorsing
FIGURE 1: The framework developed by Swinburn et al. (2011) to categorise obesity determinants and solutions
Ethical considerations for taxation tax on SSBs, are a highly attractive government strategy and
may be one of the most cost effective interventions to address
on SSBs obesity (World Health Organization 2016). Nevertheless,
Tax legislation that aims to influence dietary habits and taxes on SSBs as part of the strategy for prevention and
prevent NCDs is receiving continuous attention due to the control of obesity in South Africa (2015–2020), have proven a
immense role that costs play in food choices. The rationale source of controversy (Health-e 2016). This is clearly visible
for taxing products with a view to improving public health is from news headlines as well as social media (Maroela editors
mostly based on the view that these products are associated 2016; African News Agency 2016; Van Wyk 2016).
with negative health effects. These negative health effects
result in high healthcare costs which are not borne by either Arguments for and against government inter
the consumer or the producer of the product (World Health ference
Organization 2015b). Therefore, a government wants to act The complexity of overweight and obesity is frequently
to correct the use of those products scientifically found simplified as the result of an imbalance between excessive
to have a negative impact on health. By channelling food energy intake and insufficient physical activity. The
choices in the right direction, better health outcomes and question is however, whose primary responsibility is the
healthier eating habits can be cultivated. prevention of obesity especially among children? Is it not a
shared responsibility resting on parents, guardians, schools,
General principles communities and the state (Kersh et al. 2011)? Although
Public health care as a discipline has existed for more the opinion can also be raised that every parent is best
than 100 years with a focus of protecting and promoting positioned to make decisions regarding the child’s nutrition.
the health of the community, and not only the individual.
Given the extent of the discipline, and the issues that it Swinburn et al. (2011) argue that intervention-driven
addresses, there is an ever-present question of how far policies against obesity should be directed towards the
legislation can impact choice before personal freedom is environment rather than the individual. Therefore, the
constrained (Kass 2001). policy aim should be to make healthy choices easier for
the individual, rather than to convince individuals to make
There is general acceptance that the state must act in the healthy choices (Swinburn et al. 2011). Eating habits cannot
interests of the general public’s health. Fiscal policies, such as be managed directly by law in the same way that law has
http://www.satnt.ac.za 4 Open AccessPage 5 of 9 Oorspronklike Navorsing
changed other behaviours, for example, using seat belts, already demonstrated they are willing to use legislation as
smoking in restaurants or public areas, the use of liquor an intervention to improve public health, as in the case of
by minors, or traffic offenses (Sacks et al. 2009). A person excise duty on tobacco products, and regulations that limit
cannot be ordered when, how much and what to eat. As the trans-fatty acid (Department of Health, 2011) and salt
such, legislation aimed at prevention of obesity is much content (Department of Health, 2016) of food products.
less intrusive in the sphere of human rights and personal
freedom of choice than many other types of legislation at Focus on the tax
the health level. The goal of strategies like tax on SSBs is To correctly interpret the tax on SSBs, it is necessary to
rather to influence behaviour by motivating individuals to consider the “Strategy for prevention and control of obesity
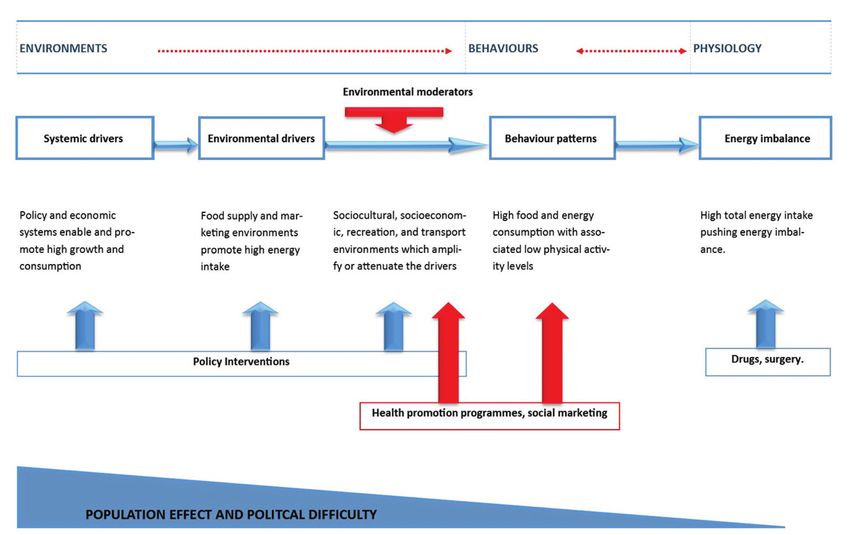
make healthy choices (Swinburn et al. 2011). in South Africa, 2015–2020). According to the Minister
of Health, Dr PA Motsoaledi, the strategy can serve as a
A framework was designed by Kass (2001) to evaluate roadmap for South Africans to be as healthy as possible.
the ethical implications of interventions and policy The strategy focuses on six main objectives (Figure 2). Tax
proposals. This includes determining: (1) the objectives on SSBs forms part of a further six sub-objectives that fall
of the proposed programme; (2) the effectiveness of the under the second objective, showing that this tax is part of
programme to achieve the proposed objectives; (3) the a broader strategy to address obesity.
known as well as potential liabilities/disadvantages of the
programme; (4) whether the liabilities can be minimised; Any tax must comply with four principles before it can be
(5) if the programme can be implemented fairly; and said to be a “good policy” from an economic viewpoint
lastly, (6) whether the pros and cons of the programme are (Calitz et al. 1999). The tax must firstly be economically
evenly distributed. Kass (2001) suggests that, if the above- effective, meaning that the change in price as well as
mentioned framework is followed, an ethically correct its impact on sales must be limited. Secondly, it must be
policy will be the result. The reality is, however, that administratively simple, so that it can be collected at a low
politics play a tangible intrusive role in the formulation and cost. Thirdly, it must be consistent with people’s ability to
execution of policies, and that an ethically correct policy pay. The tax should make up a smaller share of less wealthy
may not necessarily enjoy political preference. The reality people’s spending and a greater share of more wealthy
that politics triumph should not, however, prevent us from people’s spending. Lastly, it must be flexible.
ensuring that fairness, respect, and truth lay the foundation
for high standard, scientifically-founded, ethical policies. The proposed tax is what economists call a Pigouvian tax.
The biggest asset that the SA public health system can have Pigouvian tax is named after the British economist AC
is the public’s confidence that decision making and policies Pigou. It is a tax that attempts to force market participants
for public welfare are carried out. to account for the external (or social) costs of their decisions
in their calculation of costs and benefits (Black et al. 2005). It
Brownell et al. (2009) states that economists agree that it does not meet the economic efficiency principle described
is ethically justifiable for governments to take economic above, precisely because it is aimed at increasing the
steps to address failures, defects and shortcomings in the relative price of SSBs and reducing sales. The tax should
market, as in the case of the marketing of SSBs. The failures be administratively reasonably efficient to levy as the legal
of the market, according to these authors, are that many burden is on private companies that are unlikely to avoid
consumers: (i) are ignorant of the long-term consequences tax and will be able to partially or fully pass the price
of excessive SSB consumption; (ii) are being misled by the increase on to consumers.
advertisement of so-called benefits of SSB use; (iii) make
decisions about a product based on instant gratification The point of equality, or fairness, requires further discussion.
but long-term damage, especially to children and young On one hand, the tax is regressive and poorer people carry
people who are less concerned about adverse effects that a greater burden. On the other hand, the argument can be
may emerge over many years; (iv) do not bear the full cost made that poor populations are the most affected by the ill
of their decisions to drink SSBs themselves i.e. the medical health associated with unhealthy eating habits (Brownell
consequences of overweight and obesity will be borne by et al. 2009). These are precisely the populations that will
government and taxpayers via medical services and funds. benefit from the tax because their spending on SSBs will
decrease if they replace SSBs with water, which is usually
Tugendhaft et al. (2015) argue that the playing field is freely available or at minimum cost. Furthermore, it should
already uneven with consumers who, through marketing benefit poorer communities when their own health is
techniques such as strategic placement of high energy improved. In Mexico, all socio-economic groups reduced
products, are being deceived and that it is precisely use of SSBs after a tax was introduced. The lowest socio-
Government’s responsibility to protect the health of the economic group, however, showed the biggest decrease
population. Manyema et al. (2014) show that the SA (17%) in consumption (Backholer et al. 2016).
government, and specifically the Department of Health, has
http://www.satnt.ac.za 5 Open AccessPage 6 of 9 Oorspronklike Navorsing
Goal 1: Create an institutional framework to support Objectives for goal two
inter-sectoral engagement • Promote the development and implementation
Goal 2: Create an enabling environment that supports of a relevant legislative framework
the availability and accessibility of healthy • Ensure that food and beverage products sold are
food choices in various settings aligned with optimal national and International
Goal 3: Increase the percentage of the population nutritional standards
engaging in physical activity • Ensure responsible and ethical advertising and
Goal 4: Support obesity prevention in early childhood marketing of food by the food industry
(in-utero – 12 years) • Implement user-friendly food labelling education
Goal 5: Communicate with, educate and mobilise tool
communities • Increase access and availability of vegetables and
Goal 6: Establish a surveillance system, strengthen fruits
monitoring and evaluation, and research • Promote healthy eating in different settings
FIGURE 2: An extract from the National Strategy for Prevention and Control of Obesity of the South African Department of Health (Health-e, 2016)
International experiences with of water increased. The effect was also larger in low-income
households as well as urban areas (Colchero et al. 2017).
taxation on sugar-sourced products
The experience of other countries with tax on products Manyema et al. (2014) used a mathematical simulation
containing sugar is summarised in Table II. Clearly similar model to calculate what the potential impact of a 20% tax on
taxes worldwide are primarily intended to be revenue SSBs would be for SA adults. They used SA data on energy
generating as well as to reduce the intake of the taxed intake, BMI distribution and price elasticity (defined as the
products to achieve specific health outcomes. extent of change in the quantity of goods demanded when
the price increases). Their results show a 20% tax on SSBs
Balance Sheet of possible benefits will lead to an estimated reduction of 36 kJ (95% CI: 9-68 kJ)
per day and an expected reduction in obesity of 3.8% (95%
and disadvantages of a tax on SSBs BI: 0.6-7.1) in men, and 2.4% (95% BI: 0.4-4.4) in women.
Possible benefits This means that over 220 000 (95% BI: 24 197-411 795) fewer
people would be obese.
The possible benefits of such a sugar tax are explained by
several authors as both the possible contribution to public
An article by the same research group looked at the cost
health through combating obesity and, at the same time,
of being indifferent to the impact of SSB intake on obesity.
generating economic benefits. These benefits include the
Tugendhaft et al. (2015) used a simulation model for SA to
revenue collected by the tax, the lower spending on SSBs
calculate the impact of a 2.4% annual increase in SSB intake
(depending on what they are replaced with), and also the
on the prevalence of obesity, based on projected SSB sales
benefit of saving on the cost of medical services as a result of
between 2012 and 2017. Such an increase in annual sales
a reduced prevalence of overweight and obesity (Brownell
of SSBs would potentially lead to an additional 1 287 000
et al. 2009; Manyema et al. 2014). The latter benefit may
obese adults, of which 22% are due to increased SSB intake
increase if the additional tax revenue collected is used for
(Tugendhaft et al. 2015).
public health care. In South Africa, however, this does not
seem to be the case at present.
Similar findings have been published in Australia on the
impact of an additional 20% tax on SSBs (Nomaguchi et
The question remains whether the proposed tax on SSBs will
al. 2017). According to the simulation model it seems that
affect a population’s intake of SSBs. Research that assesses
such a tax can reduce the prevalence of obesity by 1.96%.
the impact on intake of SSBs is limited. In the US, Berkeley
Together with the reduction of obesity prevalence, the
was the first jurisdiction to tax SSBs in March 2015 (Falbe
positive impact on healthcare costs of such a proposed tax
et al. 2016). Falbe et al. (2016) found that use of SSBs, four
could also lead to increased productivity.
months after the implementation of the tax, decreased by
21% in Berkeley’s low income and minority groups while
Unexpected outcomes
water intake increased significantly (63%). Colchero et al.
(2017) assessed the changes in consumption of non-alcoholic Table II shows the unexpected outcomes due to tax on
beverages after the tax on SSBs was introduced in January products containing sugar in different countries. This
2014. The findings match those van Falbe et al. (2016) includes, inter alia, product reformulation (possibly for tax
showing that purchases of SSBs were lower while purchase evasion), lower revenue from the tax, job losses that affect
low-income groups the most, increases in purchases across
http://www.satnt.ac.za 6 Open AccessPage 7 of 9 Oorspronklike Navorsing
borders, losses for producers, and a smaller than expected In SA, a sugar-producing country, the strongest objections
decrease in consumption. are around the possible loss of employment opportunities
specifically in the agricultural sector due to reduced
Possible disadvantages/objections demand. This may have a knock-on effect from production
The first objection is that there is no irrefutable evidence throughout the value chain of transport, storage, product
that the tax on SSBs will lead to reduced consumption, manufacturing, packaging, distribution, marketing and
and consequently lower incidence of obesity, lower risk consumption (SASA 2016). Indeed, SASA (2016) comment
of NCDs, and therefore a smaller burden on public health. that around a million job opportunities are created for the SA
The SSB industry’s objections in America (Brownell 2009) market through the 620 000 tonnes of sugar produced each
have shown they are expecting reduced sales due to such a year. SASA argue that the effect of the tax on the total value
tax. This industry believes that sales will decrease! It is also chain will hurt poor, emerging farmers and small businesses
argued (South African Sugar Association – SASA 2016) that the most. The SSB industry further mention all the jobs they
obesity is a multifactorial condition. As such, a tax on SSBs will lose as a result of reduced sales (SASA 2016).
alone cannot solely be used to address overweight and
obesity, and a combination of strategies and interventions Furthermore, a study requested by the European Union has
should be used. shown that taxes on sugar, salt and fat-containing foods in
TABEL II: International experiences with taxation on sugar containing products
Country and year of Type of tax Purpose Using the tax income Outcomes Unforseen Income
implementation generated outcomes
Finland Taxation on products Income generation for The tax generates income The impact of the tax has Claims from the industry €204 million in 2013
such as snacks, the government. for government. not yet been evaluated based on discrimination €250 million in 2014
In 2000, sugar tax on chocolates and ice cream. but unofficial reports against individual food
sweets was scrapped, Exclude biscuits, baked indicate that sales of non- companies.
but not on non-alcoholic foods, yogurts, deserts, alcoholic drinks as well as
beverages. In 2010 jelly, mousse and sugar sweets decreased.
Parliament reinstated granules.
the sugar tax and it was
implemented in 2011. Sugar-sweetened
beverages.
Hungary Taxation of food products Reduce intake, improve The tax income generated Reduced intake of Product reformulation; €61.5 million between
2011 with unhealthy levels of healthy eating habits is used to supplement targeted products. Possible tax evasion; Jan 2013 and Dec
sugar, salt and fat. through advocating for the health budget, Smaller income than 2013.
healthier food choices making a contribution The price of cola-drinks were expected;
Taxation of sugar- and the development of to the salaries paid to increased (3.4%, 1.2% Loss of jobs in low
sweetened beverages. an additional mechanism healthcare staff. and 3.1% respectively) income groups.
for finance of public and intake decreased
health care. (2.7%, 7.5% and 6%
respectively) for 2011,
2012 and 2013.
Denmark Taxation of products To generate additional Supports public health Economic analysis Increase border trade, €134 million between
2011 with more than 2.3% income in order to spending. Finances tax suggests that short-term job losses and losses for Nov 2011 and Aug
saturated fat content reduce income tax. reductions and social intake of some taxed producers. 2012.
(Abolished in 2013) spending. products decreased with
To reduce the intake of 10–15%.
saturated fat.
France Taxation of cold drinks Income generation but is Tax is used to generate An immediate decrease No significant unforeseen Generated about €300
2012 (sugar-sweetened also aligned to address general income for in sales of taxed products outcomes. million per year since
beverages as well as overweight and obesity in government. directly after the tax was 2012.
artificially sweetened children/adolescents. implemented.
beverages)
Mexico Taxation of sugar- Address the high obesity Part of the tax income Decrease in the use of 1 700 job losses. Unknown
2014 sweetened beverages prevalence. 7% of the is used to provide safe taxed products. Unequal effect on low-
as well as energy-dense national health budget is drinking water at public income households.
foods. spent on obesity-related schools, specifically in Smaller effect on obese
diseases. low-income areas. individuals.
US, Berkeley Taxation of the distributer Decrease intake of sugar- The tax is seen as a No data available. Concerns about Unknown
2014 for having the right of sweetened beverages general tax. There is a purchases made outside
distribution. in order to decrease committee that advises of the borders of the
the humanitarian and the city council of country.
economic cost related Berkley.
to the excessive use of Lower than expected
sugar. decrease in usage with
less than expected health
improvements.
(World Health Organization, 2015b, World Health Organization, 2016, World Health Organization, Cornelsen and Carreido, 2015, Jensen and Smed, 2013, Colchero et al., 2016, National
Treasury, 2016a, Soares, 2016, Pineda, 2016, The Guardian, 2015)
http://www.satnt.ac.za 7 Open AccessPage 8 of 9 Oorspronklike Navorsing
Europe, do reduce consumption but are not an optimal statements about the disadvantages or benefits for health
method to promote healthy nutrition as consumers usually (Bruyère et al. 2015). The results of most systematic analyses
replace such products with cheaper products, often of (reviews) show contradictory and inconsistent long-term
lower quality (Ecorys and IDEA 2014). effects (Wiebe et al. 2011; Bruyère et al. 2015; Pereira 2013).
Research on the possible long-term metabolic effects of
Discussion, conclusions and recom artificial sweetener intake on pregnant women, toddlers
and children, is also limited and inconsistent (Brown et
mendations al. 2010; Reid et al. 2016). The overall conclusion seems
The SA dietary guidelines are in line with the WHO’s to be that, at this stage, it is not possible to give a definite
recommendations on added sugars in the diet. It appears guideline about the benefits or disadvantages of using
that large sections of the SA population currently exceed these intense sweeteners for adults or children.
the guidelines. The restrictions on sugar intake are aimed at
preventing overweight and obesity, NCDs and tooth decay. During a study conducted in Soweto, Johannesburg, we
It is clear that a restriction of added sugar intake alone asked overweight and obese black women why they are not
will probably not significantly reduce obesity, as there are replacing SSBs with drinks containing artificial sweeteners.
so many complex and interactive factors involved in its The answers given were mostly that cold drinks with
development. There is currently also no clear evidence that artificial sweeteners “are for sick people, and we are not
a tax on SSBs does reduce sugar intake. sick; do not taste well; taste like medicine; and reminds me
of medicine”. The combination of sweeteners in use does not
There is no doubt that overweight, obesity and consequent appear to meet everyone’s taste but there is also some degree
NCDs are public health problems in SA. Convincing of ignorance among consumers about the content of SSBs.
evidence from the international literature shows that
“excessive” consumption of SSBs contributes to overweight One should look critically at the implementation of dietary
and obesity. In SA, there is sufficient evidence that the guidelines on sugar intake, at the international experience
intake of these beverages has increased, and that the of sugar tax, and whether it has led to a reduction in
increase is related to body weight, body shape and some sugar intake or addresses the problem of obesity in
important risk factors for NCDs (Vorster et al. 2014). developing countries. This review also showed that the
proposed tax may be ethically justified, but there remains
Overweight and obesity are complex, multifactorial little evidence that its intended goals will be achieved in
problems that need to be addressed through various South Africa. The chance that the tax will have its desired
government sectors and healthcare staff through impact will increase significantly if the revenue raised
multidisciplinary interventions (of which tax is only one). by the tax is ploughed back into the health sector. As in
Temple and Steyn (2013) warn that there is uncertainty the case of any intervention directed at public health, the
about the most optimal methods of reducing sugar intake at exact consequences for SA cannot be determined until the
the population level. As with all dietary recommendations, tax act is passed and its effects monitored. It is therefore
“social marketing” and education of consumers are recommended that all implementation programmes around
probably the best starting points. the tax should include evaluation and monitoring plans
and studies, so that the tax can be recalled if it does not
The question is, are there better methods to reduce sugar reduce sugar intake in vulnerable populations. It is critical
intake in the total population? Replacing SSBs with water that monitoring evaluates the: i) cost of products taxed
means that clean, safe drinking water has to be available and their substitutes; ii) purchasing patterns of the taxed
and affordable in all areas, including poorly serviced rural products and substitutes; iii) food composition of taxed
areas, or at least that cold bottled water should be cheaper products and substitutes; iv) dietary intake and habits; and
than SSBs everywhere. v) change in population prevalence of overweight, obesity
and diet-related NCDs (World Health Organization 2015b).
Are artificial and non-energy containing natural sweeteners
the solution? In Brazil it was found that the average daily Furthermore, it is suggested that the government urgently
energy intake of individuals who use only sugar was 16% pay attention to possible job losses the tax may bring and
more than those that use only artificial sweeteners (Silva find innovative ways to prevent and correct them. One
Monteiro et al. 2018). The term “non-energy containing possible option may be sugar cultivation not only for food
sweeteners” includes both artificial sweeteners and natural but also for energy in the bio-fuel field.
non-energy containing sweeteners like stevia and its
products. These sweeteners are a few hundred to thousands Recognition
of times sweeter than sucrose (sugar). Most of them, except
aspartame, contain no energy. Unfortunately, there is a Recognition is granted to Prof Waldo (WF) Krugell (North-
lack of high quality clinical research in which subjects West University) who provided input regarding economic
are followed for long periods of time to make definitive aspects of the taxation.
http://www.satnt.ac.za 8 Open AccessPage 9 of 9 Oorspronklike Navorsing
Competitive interests Kass, N. E. 2001. An ethics framework for public health. American journal of public
health, 91, 1776-1782.
Kersh, R., Stroup, D. F. and Taylor, W. C. 2011. Childhood obesity: a framework for
Dr Christine Taljaard worked on the “Beverage Fortified policy approaches and ethical considerations. Prev Chronic Dis, 8, A93.
With Micronutrients study (BEFORMI)” for her doctoral Mackeown, J. M., Pedro, T. M. and Norris, S. A. 2007. Energy, macro-and
studies funded at the time by Coca Cola South Africa (Ltd). micronutrient intake among a true longitudinal group of South African
adolescents at two interceptions (2000 and 2003): the Birth-to-Twenty (Bt20)
Study. Public Health Nutrition, 10, 635-643.
Prof Este (HH) Vorster is currently serving as scientist in Manyema, M., Veerman, L. J., Chola, L., Tugendhaft, A., Sartorius, B., Labadarios, D.
the Council of South African Sugar Association (South and Hofman, K. J. 2014. The potential impact of a 20% tax on sugar-sweetened
beverages on obesity in South African adults: A mathematical model. PloS one,
Africa Sugar Association-SASA). 9, e105287.
Maroela-Redaksie. 2016. Soettande dalk binnekort bitter oor nuwe belasting
Author Contributions [Online]. Available: http://maroelamedia.co.za/nuus/sa-nuus/soettande-dalk-
binnekort-bitter-oor-nuwe-belasting/ [Accessed 24 Jan 2017].
Both HHV (North West University) as well as CT (North National Treasury 2016. Taxation of sugar sweetened beverages. In: TreasurY, N.
(ed.).
West University) contributed to the conceptualisation,
Norman, R., Gaziano, T., Laubscher, R., Steyn, K., Bradshaw, D. and Collaboration, S.
writing and finalisation of the article. Both authors A. C. R. A. 2007. Estimating the burden of disease attributable to high blood
pressure in South Africa in 2000. South African Medical Journal, 97, 692-698.
contributed to the interpretation of the data, and to the
Pan, A. and Hu, F. B. 2011. Effects of carbohydrates on satiety: differences between
discussion and finalisation of the article. liquid and solid food. Current Opinion in Clinical Nutrition & Metabolic Care,
14, 385-390.
References Pereira, M. A. 2013. Diet beverages and the risk of obesity, diabetes, and cardiovascular
disease: a review of the evidence. Nutrition Reviews, 71, 433-440.
ADSA. 2016. Position statement on the proposed taxation of sugar-sweetened Pineda, E. 2016. What the world can learn from Mexico’s tax on sugar-sweetened
beverages in South Africa [Online]. Available: http://www.adsa.org.za/ drinks [Online]. Available: https://theconversation.com/what-the-world-can-
Portals/14/Documents/2016/Nov/ADSA%20Position%20Statement%20 learn-from-mexicos-tax-on-sugar-sweetened-drinks-56696 [Accessed 28 Nov
on%20Sugar%20Tax_Final_28%20Nov%202016.pdf [Accessed 23 Jan 2017]. 2016].
African News Agency. 2016. 60000 kan werk verloor oor voorgestelde suikerbelasting Sacks, G., Swinburn, B. and Lawrence, M. 2009. Obesity Policy Action framework
[Online]. Available: http://maroelamedia.co.za/nuus/sa-nuus/60-000-kan- and analysis grids for a comprehensive policy approach to reducing obesity.
werk-verloor-oor-voorgestelde-suikerbelasting/ [Accessed 10 Jan 2017]. Obesity reviews, 10, 76-86.
Backholer, K., Sarink, D., Beauchamp, A., Keating, C., Loh, V., Ball, K., Martin, J. and Soares, A. A. 2016. Putting taxes into the diet equation. Bulletin of the World Health
Peeters, A. 2016. The impact of a tax on sugar-sweetened beverages according Organization, 94, 239-241.
to socio-economic position: a systematic review of the evidence. Public health
nutrition, 1-15. South African Sugar Association 2016. Comments on the policy paper on taxation of
sugar sweetened beverages by national treasury.
BEVSA. 2016. Response to taxation of sugar-sweetened beverages policy paper [Online].
Available: http://www.bevsa.co.za/wp-content/uploads/2016/08/22082016- Swinburn, B. A., Sacks, G., Hall, K. D., Mcpherson, K., Finegood, D. T., Moodie, M.
BEVSA-SSB-Tax-Comments-FINAL.pdf [Accessed 24 Feb 2017 2017]. L. and Gortmaker, S. L. 2011. The global obesity pandemic: shaped by global
drivers and local environments. The Lancet, 378, 804-814.
Brownell, K. D., Farley, T., Willett, W. C., Popkin, B. M., Chaloupka, F. J., Thompson, J.
W. and Ludwig, D. S. 2009. The public health and economic benefits of taxing Temple, N. J. and Steyn, N. P. 2013. Sugar and health: a food-based dietary guideline
sugar-sweetened beverages. New England Journal of Medicine, 361, 1599-1605. for South Africa. South African Journal of Clinical Nutrition, 26, S100-S104.
Bruyère, O., Ahmed, S. H., Atlan, C., Belegaud, J., Bortolotti, M., Canivenc-Lavier, The Guardian. 2015. Benefits of Mexican sugar tax disputed as congress approves
M.-C., Charrière, S., Girardet, J.-P., Houdart, S. and Kalonji, E. 2015. Review of cut [Online]. Available: https://www.theguardian.com/world/2015/oct/22/
the nutritional benefits and risks related to intense sweeteners. Archives of benefits-of-mexican-sugar-tax-disputed-as-congress-approves-cut [Accessed
Public Health, 73, 41. 28 Nov 2016].
Calitz, E., Steenekamp, T. J. and Black, P. A. 1999. Public Economics for South African Tugendhaft, A., Manyema, M., Veerman, L. J., Chola, L., Labadarios, D. and Hofman,
Students, Oxford University Press. K. J. 2015. Cost of inaction on sugar-sweetened beverage consumption:
implications for obesity in South Africa. Public Health Nutrition, 1-9.
Colchero, M. A., Popkin, B. M., Rivera, J. A. and Ng, S. W. 2016. Beverage purchases
from stores in Mexico under the excise tax on sugar sweetened beverages: Van Wyk, J. 2016. Suikerbelasting kan werksverliese bring [Online]. Available: http://
observational study. BMJ, 352, h6704. landbou.com/nuus/suikerbelasting-kan-werksverliese-bring/ [Accessed 21
Nov 2016 2016].
Cornelsen, L. and Carreido, A. 2015. Health related taxes on foods and beverages.
London: Food Research Collaboration. Vorster, H. H., Badham, J. and Venter, C. 2013. An introduction to the revised food-
based dietary guidelines for South Africa. South African Journal of Clinical
Economics Tax Analysis Chief DirectoratE. 2016. Taxation of sugar sweetened Nutrition, 26, S5-S12.
beverages: Policy paper [Online]. Available: http://www.treasury.gov.za/
public%20comments/Sugar%20sweetened%20beverages/POLICY%20 Vorster, H. H., Kruger, A., Wentzel-Viljoen, E., Kruger, H. S. and Margetts, B. M.
PAPER%20AND%20PROPOSALS%20ON%20THE%20TAXATION%20OF%20 2014. Added sugar intake in South Africa: findings from the Adult Prospective
SUGAR%20SWEETENED%20BEVERAGES-8%20JULY%202016.pdf [Accessed 2 Urban and Rural Epidemiology cohort study. The American Journal Of Clinical
Feb 2017]. Nutrition, 99, 1479-1486.
Ecorys, E. and Idea, D. 2014. Food taxes and their impact on competitiveness in Wiebe, N., Padwal, R., Field, C., Marks, S., Jacobs, R. and Tonelli, M. 2011. A
the agri-food sector: annexes to the Main report. ec. europa. eu. DocsRoom/ systematic review on the effect of sweeteners on glycemic response and
documents/6150/attachments/1/translations/en/renditions/pdf (accessed 25 clinically relevant outcomes. BMC Medicine, 9, 123.
July 2015).
World Health Organization. Public health product tax in Hungary: An example of
Goran, M. I. and Astrup, A. 2002. Energy metabolism. In: Gibney, M. J., Vorster, successful intersectoral action using a fiscal tool to promote healthier food
H. H. and Kok, F. J. (eds.) Introduction to Human Nutrition. Oxford: Blackwell choices and rais revenues for public health. [Online]. Available: http://www.
Publishing Ltd. euro.who.int/__data/assets/pdf_file/0004/287095/Good-practice-brief-
public-health-product-tax-in-hungary.pdf?ua=1 [Accessed 28 Nov 2016].
Health-E. 2016. Strategy: The Prevention and Control of Obesity in South Africa
2015-2020 [Online]. Available: https://www.health-e.org.za/2015/12/28/ World Health Organization 2014. WHO handbook for guideline development, World
strategy-the-prevention-and-control-of-obesity-in-south-africa-2015-2020/ Health Organization.
[Accessed 7 Nov 2016].
World Health Organization 2015a. Guideline: Sugars intake for adults and children.
Jensen, J. D. and Smed, S. 2013. The Danish tax on saturated fat–short run effects Geneva.
on consumption, substitution patterns and consumer prices of fats. Food
Policy, 42, 18-31. World Health Organization 2015b. Using price policies to promote healthier diets.
Joubert, J., Norman, R., Bradshaw, D., Goedecke, J. H., Steyn, N. P. and Puoane, T. World Health Organization 2016. Fiscal policies for diet and prevention of
2007. Estimating the burden of disease attributable to excess body weight in noncommunicable diseases: technical meeting report, 5-6 May 2015, Geneva,
South Africa in 2000. South African Medical Journal, 97, 683-690. Switzerland.
http://www.satnt.ac.za 9 Open AccessYou can also read