U.S. Farm Income Outlook: September 2020 Forecast - September 23, 2020 - CRS ...
←
→
Page content transcription
If your browser does not render page correctly, please read the page content below
U.S. Farm Income Outlook: September 2020
Forecast

September 23, 2020

                             Congressional Research Service
                              https://crsreports.congress.gov
                                                     R46539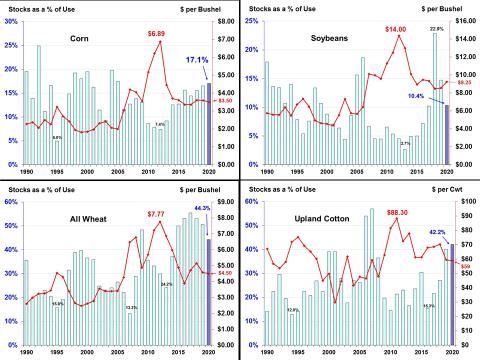
SUMMARY

                                                                                                          R46539
U.S. Farm Income Outlook: September 2020
                                                                                                          September 23, 2020
Forecast                                                                                                  Randy Schnepf
Two major indicators of U.S. farm well-being are net farm income and net cash income.      Specialist in Agricultural
Net farm income represents an accrual of the value of all goods and services produced      Policy
on the farm during the year—similar in concept to gross domestic product. In contrast,
net cash income uses a cash flow concept to measure farm well-being: only cash
transactions for the year are included. Thus, crop production is recorded as net farm
income immediately after harvest—irrespective of whether the crop is stored on farm or sold—whereas net cash
income records a crop’s value only after it has been sold in the marketplace.

This report uses the U.S. Department of Agriculture’s (USDA’s) farm income projections (as of September 2,
2020) to describe the U.S. farm economic outlook.

                           USDA Farm Income Projections as of September 2, 2020
                The most recent aggregate national net farm income projections for calendar year 2020 were issued
                by USDA’s Economic Research Service (ERS) on September 2, 2020. This is the second of three ERS
                forecasts for 2020: the first farm income forecast was announced on February 5, 2020. The third
                forecast is expected to be released on November 27, 2020.

According to the Economic Research Service (ERS), national net farm income is forecast at $102.7 billion in
2020, up $19.0 billion (+22.7%) from 2019, driven by projected record federal support of $37.2 billion, including
$10.4 billion from farm programs authorized under the 2018 farm bill (P.L. 115-334) and $25.8 billion from ad
hoc programs authorized outside of traditional farm omnibus legislation. An alternate measure, net cash income—
focused on cash flows—is forecast at $115.2 billion (+4.5% from 2019).

Both projected net farm income and net cash income increase because of growth in government assistance in
2020, which includes $3.8 billion of 2019 Market Facilitation Program (MFP) payments, $5.8 billion from the
Paycheck Protection Program (PPP), and $16 billion from the Coronavirus Food Assistance Program (CFAP). If
realized, the 2020 government payments of $37.2 billion would represent a 65.7% increase from 2019’s $22.4
billion in government support and would surpass the previous record of $23.2 billion (nominal dollars) in 2000.

Farm asset value in 2020 is projected at $3.1 trillion, up year-to-year by 1.1%. Farm asset values reflect farm
investors’ and lenders’ expectations about long-term profitability of farm sector investments. Another measure of
the farm sector’s well-being is aggregate farm debt, which is projected to be at a record $433.8 billion in 2020—
up 3.6% from 2019. Both the debt-to-asset and the debt-to-equity ratios have risen for eight consecutive years,
potentially suggesting a continued slow erosion of the U.S. farm sector’s financial situation. At the farm
household level, average farm household incomes have been well above average U.S. household incomes since
the late 1990s. However, this advantage derives primarily from off-farm income as a share of farm household total
income.

The final prospects for the 2020 farm income outlook are still clouded by several critical uncertainties. First, the
extent of weather-related effects on yields and harvested acres will not be known until the harvest is completed
and the size of the major field crops has been assessed—most likely not before January 2021. Second, the extent
to which the Coronavirus Disease 2019 (COVID-19) pandemic will resurge again in the fall when cooler weather
forces more people indoors is unknown. Third, also related to the COVID-19 pandemic, is when and how the
general economy will recover and consumer demand patterns return to normal. Fourth is whether agricultural and
food supply chains emerge in a more resilient and responsive form that revives investment and growth at both the
producer and retail levels. Finally, despite the signing of a Phase I trade agreement with China on January 15,
2020, it is unclear how soon—if at all—the United States may resume normal trade with China.

Congressional Research Service
U.S. Farm Income Outlook: September 2020 Forecast
Contents
Introduction ..................................................................................................................................... 1
USDA’s September 2020 Farm Income Forecast ........................................................................... 1
Highlights for the 2020 Farm Income Outlook ......................................................................... 3
Major Economic and Policy Developments Set the Stage ........................................................ 4
Summary of the 2020 Economic Outlook........................................................................... 6
U.S. Crop Developments and Outlook for 2020 ....................................................................... 6
U.S. Livestock Developments and Outlook for 2020 ............................................................... 9
COVID-19 Impacts the U.S. Livestock Sector ................................................................. 10
Beef and Egg Production Decline and Pork, Poultry, and Milk Expand in 2020 ............. 10
Livestock-Price-to-Feed-Cost Ratios Signal Lower Profitability Outlook ....................... 10
Gross Cash Income Highlights................................................................................................. 11
Crop Receipts .................................................................................................................... 12
Livestock Receipts ............................................................................................................ 13
Government Payments to the U.S. Farm Sector ............................................................... 14
Dairy Margin Coverage Program Outlook ........................................................................ 17
Production Expenses ............................................................................................................... 18
Farm Asset Values and Debt .......................................................................................................... 20
Average Farm Household Income ................................................................................................. 23
Total vs. Farm Household Average Income ............................................................................ 23
Figures
Figure 1. Annual U.S. Farm Sector Nominal Income, 1940-2020F ................................................ 2
Figure 2. U.S. Farm Sector Inflation-Adjusted Income, 1940-2020F ............................................. 2
Figure 3. Stocks-to-Use Ratios and Farm Prices: Corn, Soybeans, Wheat, and Cotton.................. 7
Figure 4. U.S. Drought Monitor for September 8, 2020 ................................................................. 9
Figure 5. Livestock Farm-Price-to-Feed Ratios, Indexed .............................................................. 11
Figure 6. Farm Gross Cash Receipts by Source, 2010-2020F....................................................... 12
Figure 7. Crop Cash Receipts by Source, 2010-2020F ................................................................. 13
Figure 8. U.S. Livestock Product Cash Receipts by Source, 2010-2020F .................................... 14
Figure 9. Net Farm Income by Source, 1996-2020F ..................................................................... 15
Figure 10. U.S. Government Farm Support, Direct Outlays, 1996-2020F .................................... 17
Figure 11. The Dairy Output-to-Input Margin............................................................................... 18
Figure 12. Total Annual Farm Production Expenses, 1970-2020F................................................ 19
Figure 13. Farm Production Expenses for Selected Items, 2019 and 2020F ................................. 19
Figure 14. Index of Monthly Prices Received vs. Prices Paid, 2005-2020 ................................... 20
Figure 15. Real Estate Share of Total Farm Sector Assets ............................................................ 21
Figure 16. U.S. Average Farm Land Values, 1985-2020 ............................................................... 21
Figure 17. U.S. Farm Debt-to-Asset Ratio, 1960-2020F............................................................... 22
Figure 18. U.S. Average Farm Household Income, by Source, 1960-2020F ................................ 23
Figure 19. Average Farm Household Income Compared with U.S. Average Household
Income ........................................................................................................................................ 24
Congressional Research ServiceU.S. Farm Income Outlook: September 2020 Forecast Figure A-1. Monthly Farm Prices for Corn, Soybeans, and Wheat, Indexed Dollars ................... 27 Figure A-2. Monthly Farm Prices for Cotton and Rice, Indexed Dollars...................................... 27 Figure A-3. Monthly Farm Prices for All-Milk and Cattle (500+ lbs.), Indexed Dollars .............. 28 Figure A-4. Monthly Farm Prices for All Hogs and Broilers, Indexed Dollars............................. 28 Tables Table A-1. Annual U.S. Farm Income ($ billions) Since 2015, Including 2020 Forecasts............ 29 Table A-2. Average Annual Income per U.S. Household, Farm vs. All, 2013-2020 Forecasts ..................................................................................................................................... 30 Table A-3. Average Annual Farm Sector Debt-to-Asset Ratio, 2013-2020 Forecasts ................... 30 Table A-4. U.S. Farm Prices and Support Rates for Selected Commodities Since 2015- 2016 Marketing Year .................................................................................................................. 31 Appendixes Appendix. Supporting Material on Farm Income .......................................................................... 25 Contacts Author Information........................................................................................................................ 32 Congressional Research Service
U.S. Farm Income Outlook: September 2020 Forecast

Introduction
The U.S. farm sector is vast and varied. It encompasses production activities related to traditional
field crops (such as corn, soybeans, wheat, and cotton) and livestock and poultry products
(including meat, dairy, and eggs), as well as fruits, tree nuts, and vegetables. In addition, U.S.
agricultural output includes greenhouse and nursery products, forest products, custom work, 1 and
other farm-related activities. The intensity and economic importance of each of these activities, as
well as their underlying market structure and production processes, vary regionally based on the
agroclimatic setting, market conditions, and other factors. As a result, farm income and rural
economic conditions may vary substantially across the United States.
Annual U.S. net farm income is the single most-watched indicator of farm sector well-being, as it
captures and reflects the entirety of economic activity across the range of production processes,
input expenses, and marketing conditions that have prevailed during a specific time period.2
When national net farm income is reported together with a measure of the national farm debt-to-
asset ratio, the two summary statistics provide a quick and widely referenced indicator of the
economic well-being of the national farm economy.

USDA’s September 2020 Farm Income Forecast
In the second of three official U.S. farm income outlook releases scheduled for 2020 (see box
“ERS’s Annual Farm Income Forecasts” in the Appendix), the U.S. Department of Agriculture’s
(USDA’s) Economic Research Service (ERS) projects that U.S. net farm income will rise 22.7%
year-over-year in 2020 to $102.7 billion, up $19.0 billion from last year (Figure 1 and Figure 2).3
This projected increase is driven largely by record government subsidies to the sector of $37.2
billion, including $10.4 billion from farm programs authorized under the 2018 farm bill (P.L. 115-
334) and $25.8 billion from ad hoc programs authorized outside of traditional farm omnibus
legislation.
The September forecast of $102.7 billion is 13.1% above the 10-year average of $90.8 billion (in
nominal dollars) but is below 2013’s record high of $123.7 billion. An alternate farm income
measure, net cash income (calculated on a cash-flow basis), is projected at $115.2 billion in 2020,
up 4.5% from 2019 but slightly below the 10-year average of $116.0 billion.4
The divergence in year-to-year changes between the two measures of net income is due to their
different treatment of harvested crops. Net farm income includes a crop’s value after harvest even
if it remains in on-farm storage. In contrast, net cash income includes a crop’s value only when it
is sold. Thus, crops placed in on-farm storage are included in net farm income but not net cash
income.
The 2020 net cash income forecast of $115.2 billion includes $1.1 billion in sales from on-farm
inventories. This is in contrast with 2019 net cash income, when $13.7 billion in sales of on-farm
crop inventories helped to inflate the 2019 net cash income value to $110.3 billion.

1 Custom work involves performing all the machine operations for another landowner in exchange for a set fee or rate.
2 See box “Measuring Farm Profitability” in the Appendix for a definition of net farm income. The appendix also
includes supporting tables and charts that provide additional details on the Economic Research Service (ERS) farm
income forecast.
3 ERS’s 2020 farm sector income forecasts are available at https://www.ers.usda.gov/topics/farm-economy/farm-sector-

income-finances/farm-sector-income-forecast/.
4 See the Appendix for a description of the differences between net farm income and net cash income.

Congressional Research Service                                                                                     1
U.S. Farm Income Outlook: September 2020 Forecast

             Figure 1. Annual U.S. Farm Sector Nominal Income, 1940-2020F

    Source: Economic Research Service (ERS), “2020 Farm Income Forecast,” September 2, 2020. All values are
    nominal—that is, not adjusted for inflation. Values for 2020 are forecast; F = forecast.

            Figure 2. U.S. Farm Sector Inflation-Adjusted Income, 1940-2020F

    Source: ERS, “2020 Farm Income Forecast,” September 2, 2020. All values are adjusted for inflation using the
    chain-type gross domestic product (GDP) deflator, where 2019 = 100. Bureau of Economic Analysis, Real GDP
    Chained Dollars (accessed December 3, 2019). Values for 2020 are forecasts.

Congressional Research Service                                                                                     2
U.S. Farm Income Outlook: September 2020 Forecast
Highlights for the 2020 Farm Income Outlook
For historical perspective, both net cash income and net farm income achieved
record nominal highs in 2013 but fell to recent lows in 2016 (Figure 1) before
trending higher during 2017-2020.
When adjusted for inflation and represented in 2019 dollars (Figure 2), both the
net farm income and net cash income for 2019 are projected to be above their
average values since 1940 of $88.4 billion and $101.2 billion, respectively.
Cash receipts for crop and livestock production activities in 2020 are projected to
be down 3.3% (Table A-1) due to a forecast decline of $14.3 billion in livestock
receipts, which more than offsets a modest $2 billion gain in crop receipts.
USDA forecasts farm prices for grain crops to be 1% to 5% lower for the 2020-
2021 marketing year; while prices for cattle and calves (-8.1%), hogs (-17.8%),
and broilers (-20%) are projected down sharply in the 2020 calendar year. Prices
for eggs, sorghum, and soybeans and products (soyoil and soymeal) are projected
to be higher in 2020/2021 (Table A-4).
Government farm subsidies are projected at a record $37.2 billion in 2020
(Figure 10). In 2020, support from traditional farm programs is bolstered by
large, ad hoc direct government payments in response to the Coronavirus Disease
2019 (COVID-19) pandemic.5 Government payments are projected to account for
36.2% of net farm income—the largest since a 31% share in 2005 (Figure 9).6
Production expenses are forecast to be $4.9 billion lower in 2020 as costs for
livestock and poultry replacements, pesticides, interest costs, and fuel are all
projected to be lower.
Farm asset values and debt levels are projected to reach record levels in 2020—
asset values at $3.1 trillion (+1.1% year-over-year) and farm debt at $433.8
billion (+3.6%)—pushing the projected debt-to-asset ratio up to 14.0%, the
highest level since 2002 (Figure 17).
Abundant domestic and international supplies of grains and oilseeds, coupled
with the severe demand shock related to COVID-19, are expected to contribute to
a sixth-straight year of relatively weak commodity prices in 2020 (Figure A-1
through Figure A-4). However, the commodity price projections for 2020 are
subject to substantial uncertainty associated with as-yet-unknown domestic
production and international commodity market developments.
Economists project that the COVID-19 pandemic could trim global economic
growth by 3.0% to 6.0% in 2020, with a partial recovery in 2021, assuming there
is not a second wave of infections.7 Global trade could also fall by 18%,
depending on the depth and extent of the global economic downturn.
The COVID-19 supply chain disruption dominated U.S. agricultural markets
during the first half of 2020 and has contributed to uncertainty over the supply,
demand, and price prospects for most major commodities. Prospects for large
corn and soybean harvests and the outlook for large ending-of-year stocks
5 CRS Report R46395, USDA’s Coronavirus Food Assistance Program (CFAP) Direct Payments.
6 Indirect subsidies such as crop insurance premium subsidies are not included in the $37.2 billion subsidy total.
7 CRS Report R46270, Global Economic Effects of COVID-19.
Congressional Research Service 3U.S. Farm Income Outlook: September 2020 Forecast
(Figure 3) combine with lingering international trade disputes to reduce market
optimism heading into the fall harvest.
Major Economic and Policy Developments Set the Stage
Several major economic and policy events have occurred since 2018 that have helped to shape the
current U.S. farm income outlook for 2020. These events are briefly reviewed here.
Since 2015, the corn, soybean, and wheat sectors have experienced relatively
strong growth in both productivity and output, helping to build stockpiles at the
end of several successive marketing years through the 2019 season (Figure 3),
while upland cotton saw its end-of-year stocks surge in 2019.
In 2018, the U.S.-China trade dispute emerged as an impediment to trade and
contributed to lower soybean prices.8 The U.S.-China trade dispute led to
declines in U.S. exports to China—a major market for U.S. agricultural
products—in 2018 and 2019 and have added to market uncertainty in 2020.
The difficulties associated with the trade dispute were exacerbated in 2018 when
U.S. farmers produced a record soybean harvest of 4.4 billion bushels and both
record ending-of-year stocks and a record stocks-to-use ratio (22.9%) (Figure 3).
The record soybean harvest combined with the sudden loss of the Chinese
soybean market kept downward pressure on U.S. soybean prices. Despite a
smaller crop and lower stocks in 2019, the reduction in U.S. soybean exports to
China prevented a price recovery.
Coming into 2020, the U.S. agricultural sector was holding relatively large stocks
of corn, soybeans, wheat, and cotton—the four largest commercial crops
produced annually in the United States in terms of area harvested, volume of
output, and value.9 The abundant supplies relative to demand contributed to weak
commodity prices over this period (Figure A-1 and Figure A-2).
In response to the U.S.-China trade dispute, USDA used its authority under the
Commodity Credit Corporation (CCC) Charter Act10 to initiate successive direct
payment programs in 2018 and 2019—referred to as Market Facilitation
Programs (MFPs)—to partially offset the trade damage incurred by U.S.
producers.11 As of August 31, 2020, USDA had paid out $8.6 billion under the
2018 MFP and $14.5 billion under the 2019 MFP.12
On January 15, 2020, President Trump signed a “Phase I” executive agreement
with the Chinese government on trade and investment issues, including
8 CRS Report R45929, China’s Retaliatory Tariffs on U.S. Agriculture: In Brief.
9 The U.S. hay crop exceeds the U.S. cotton crop in area, volume, and value but is less commercially traded and is used
primarily by the livestock sector. In recent years, two specialty crops—grapes and almonds—have rivaled cotton for
fourth place in terms of the value of production, depending on market prices and production.
10 CRS Report R44606, The Commodity Credit Corporation: In Brief.
11 The 2018 Market Facilitation Program (MFP) was authorized by Agriculture Secretary Sonny Perdue at up to $12
billion in financial assistance, including up to $10 billion in direct payments; see CRS Report R45310, Farm Policy:
USDA’s 2018 Trade Aid Package. The 2019 MFP was authorized by Secretary Perdue at up to $16 billion in financial
assistance, including up to $14.5 billion in direct payments; see CRS Report R45865, Farm Policy: USDA’s 2019
Trade Aid Package.
12 Data are as of August 31, 2020; USDA, Farm Service Agency (FSA), “Market Facilitation Program,” at
https://www.farmers.gov/manage/mfp.
Congressional Research Service 4U.S. Farm Income Outlook: September 2020 Forecast
agriculture.13 The agreement was expected to improve market access for U.S.
products into China, including a commitment by China to import $32 billion
worth of additional U.S. agricultural products (relative to a 2017 base of $24
billion) over a two-year period. The Phase I agreement was expected to provide
improved opportunity for certain U.S. exporters; however, there is uncertainty
over whether the agreement may lead to a rearrangement of global trading
patterns rather than create new market demand.
In mid-January 2020, COVID-19 first appeared in the United States and spread
rapidly through the country. The COVID-19 pandemic produced an aggregate
demand shock across the U.S. economy, including the agricultural sector.14
The COVID-19 pandemic induced widespread business closures, massive lay-
offs, and 2020 gross domestic product (GDP) declines of -4.8% for the first
quarter (annualized basis) and -31.7% for the second quarter.15 In August 2020,
24.2 million persons were unable to work because their employer closed or lost
business due to the pandemic, and the overall U.S. unemployment rate was
8.4%.16
COVID-19 lockdowns caused widespread supply chain disruptions that shifted,
and in some cases stopped, the flow of agricultural commodities through the
various supply chains and led to sharp price declines and considerable market
uncertainty.
The principal impact on feed grains, oilseeds, and fiber was primarily the result
of the COVID-19 demand shock on food demand and retail purchasing.17 The
short-run impact was lower prices, stock building of grains and oilseeds, and a
temporary backup of unmarketable surpluses of market-ready livestock and
poultry, as well as perishable fruits and vegetables.
In response to the COVID-19 pandemic, on April 17, 2020, USDA initiated the
Coronavirus Food Assistance Program (CFAP1) valued at $19 billion, including
$16 billion in direct payments to affected producers and $3 billion for food
purchases and distribution.18 As of September 20, 2020, USDA had made $10.1
billion in direct payments under CFAP1.19
On September 18, 2020, USDA announced a second CFAP payment program
(CFAP2) with funding of up to an additional $14 billion. Sign up for CFAP2
began on September 21 and runs through December 11, 2020.20
13 CRS In Focus IF11412, U.S.-China Phase I Deal: Agriculture.
14 CRS Report R46347, COVID-19, U.S. Agriculture, and USDA’s Coronavirus Food Assistance Program (CFAP).
15 GDP growth estimates are on an annualized basis, from U.S. Bureau of Economic Analysis, “Gross Domestic
Product, 2nd Quarter 2020 (Second Estimate); Corporate Profits, 2nd Quarter 2020 (Preliminary Estimate),” BEA 20-41,
news release, August 27, 2020.
16 U.S. Bureau of Labor Statistics, “The Employment Situation—August 2020,” USDL-20-1650, September 4, 2020.
17 Todd Hubbs and Scott Irwin, “Crop Markets Suffer Massive Demand Shock from COVID-19,” Economic Impact of
COVID-19 on Food and Agricultural Markets, CAST Commentary, June 2020.
18 For information on the April 17, 2020, USDA-initiated Coronavirus Food Assistance Program (CFAP1), see CRS
Report R46395, USDA’s Coronavirus Food Assistance Program (CFAP) Direct Payments.
19 USDA, Coronavirus Food Assistance Program Data, “CFAP Dashboard,” September 13, 2020, at
https://www.farmers.gov/cfap/data.
20 For more information, see USDA, “USDA to Provide Additional Direct Assistance to Farmers and Ranchers
Impacted by the Coronavirus,” press release no. 0378.20, September 18, 2020, at https://www.usda.gov/media/press-
Congressional Research Service 5U.S. Farm Income Outlook: September 2020 Forecast
The Trump Administration announced several other new programs in response to
the COVID-19 pandemic, including $349 billion in funding to support the Small
Business Administration’s (SBA’s) lending programs and to create a new
Paycheck Protection Program (PPP).21 The PPP was intended to provide short-
term, low-interest loans that could be forgiven under specified circumstances to
qualifying small businesses (including agricultural firms) and nonprofits. As of
August 8, 2020, the PPP had made $7.3 billion in potentially forgivable loans to
agriculture-related enterprises.22
The long-run impact of the COVID-19 pandemic will depend on how quickly the
economy recovers from Depression-level high unemployment and widespread
restaurant and retail business shutdowns. A slow economic recovery coupled with
the extent of a resurgence of the COVID-19 pandemic in the fall loom over
recovery prospects for both the U.S. economy and the U.S. agricultural sector.
Summary of the 2020 Economic Outlook
The final prospects for commodity prices and the farm income outlook in 2020 are still clouded
by several critical uncertainties. First, the extent of weather-related effects on yields and
harvested acres will not be known until the harvest is completed and the size of the major field
crops has been assessed—most likely by January 2021. Second, the extent to which the COVID-
19 pandemic will resurge again in the fall when cooler weather forces more people indoors is
unknown. Third, also related to the COVID-19 pandemic, is when and how the general economy
will recover and consumer demand patterns return to normal. Fourth is whether agricultural and
food supply chains resuscitate themselves in a more resilient and responsive form that revives
investment and growth at both the producer and retail ends. Finally, despite the signing of a Phase
I trade agreement with China on January 15, 2020, it is unclear how soon—if at all—the United
States may resume normal trade with China.
U.S. Crop Developments and Outlook for 2020
This section reviews the major highlights of the crop growing season from the pre-planting period
until early September, just prior to major harvesting activity for corn and soybeans.
Key market developments in 2020 include the following
U.S. crop producers entered the 2020 year with large stocks (held over from 2019
and earlier harvests) relative to demand for the major grains, oilseed, and fiber
crops—corn, wheat, soybeans, and upland cotton (Figure 3).
The United States and China signed the Phase I trade agreement on January 15,
2020. This fueled farmers’ optimism for 2020 and contributed to early
projections in March for large planted acres in 2020, including 97.0 million acres
for corn (up 8.1% from 2019), 83.5 million for soybeans (+9.7%), 44.7 million
releases/2020/09/18/usda-provide-additional-direct-assistance-farmers-and-ranchers.
21 For information on the federal response to the Coronavirus Disease 2019 (COVID-19) pandemic for different sectors
of the U.S. economy, visit the CRS COVID-19 Resources page at https://www.crs.gov/Resources/coronavirus-disease-
2019.
22 The Small Business Administration (SBA) stopped taking Paycheck Protection Program (PPP) applications on
August 8, 2020. Final loan data for PPP reported here were obtained via a Freedom of Information Act request by an
anonymous nongovernmental organization and shared with CRS.
Congressional Research Service 6U.S. Farm Income Outlook: September 2020 Forecast
for wheat (-1.1%), 13.7 million for cotton (unchanged), and 319.1 million total
area planted to principal crops (+5.4%).23
Figure 3. Stocks-to-Use Ratios and Farm Prices: Corn, Soybeans, Wheat, and Cotton
Source: USDA, World Agricultural Outlook Board, World Agricultural Supply and Demand Estimates, September 11,
2020. All values are nominal. Values for 2020 are forecasts, in dark blue, and separated from historical data.
Notes: Stocks-to-use equals the ratio of season-ending stocks relative to the season’s total usage. Data are
reported on a market-year basis—the market year is the 12-month period that begins at harvest time, during which
the harvested crop is either stored or used on farm or sold in the marketplace. For corn and soybeans, the market
year starts in September and runs through August of the following year. Wheat data are on a June-May market year
basis, and upland cotton data are on an August-July market year.
Planted acres were limited in 2020 for major field crops by a second year of
above-normal prevented planting estimated at over 10 million acres.24 In 2019, a
record 19 million acres of prevented planting acres were recorded.25 By
comparison, from 2000 to 2018, prevent planting averaged 4.1 million acres
annually.
23 National Agricultural Statistics Service (NASS), USDA, Prospective Plantings, March 31, 2020. Principal crops
include corn, sorghum, oats, barley, rye, winter wheat, Durum wheat, other spring wheat, rice, soybeans, peanuts,
sunflower, cotton, dry edible beans, chickpeas, potatoes, sugarbeets, canola, proso millet, all hay, tobacco, and
sugarcane; but also includes double cropped acres and unharvested small grains planted as cover crops.
24 Farm Service Agency (FSA), USDA, “FSA Crop Acreage Data Reported to FSA, 2020 Crop Year,” September 1,
2020.
25 CRS Report R46180, Federal Crop Insurance: Record Prevent Plant (PPL) Acres and Payments in 2019.
Congressional Research Service 7U.S. Farm Income Outlook: September 2020 Forecast
In June, farmers reported that 311.9 million acres were planted to principal crops
(up 3.1% from 2019, but down over 7 million acres from the March survey of
intentions) including 92.0 million to corn (+2.6%), 83.8 million to soybeans
(+9.7%), 44.3 million to wheat (-2.0%), and 12.2 million to cotton (-11.3%).26
Except for the prevent planting acreage mentioned earlier, most principal crops
were planted on time and under good soil moisture conditions. In August,
USDA’s initial outlook projected a record corn crop of 15.3 billion bushels and a
near-record large soybean crop of 4.4 billion bushels.27 Forecasts for both crops
included record yields of 181.8 and 53.3 bushels per acre, respectively, for corn
and soybeans. This initial forecast included declines in market-year average farm
prices (MYAPs) for corn to $3.10 per bushel (-13.9% from 2019) and for
soybeans to $8.35 per bushel (-2.3%) for 2020.
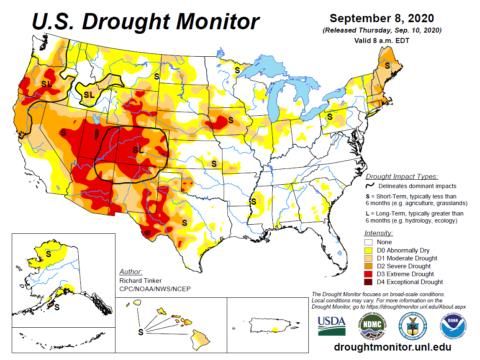
In mid-July, widespread hot, dry conditions set in over much of the western
United States, including portions of the Corn Belt—that is, the Dakotas,
Nebraska, Iowa, and northern Illinois (Figure 4). These poor growing conditions
began to negatively impact yields for corn and soybeans.
On August 10, a large derecho storm system plowed through the Midwest.28
Early news reports suggested substantial damage, including approximately 10
million acres of corn and soybeans, roughly a third of Iowa’s total cropland,
damaged by rain, hail, and wind.
As a result of the unexpected weather developments, USDA, in its September
crop report, lowered yields, acres, and production for both corn and soybeans to
reflect the hot, dry conditions and the effects of the derecho across Iowa. In
particular, national corn and soybean estimated yields were reduced to 178.5 and
51.9 bushels per acre, respectively. The harvested-corn acreage estimate was
lowered to 83.473 million acres, a reduction of 550,000 acres—all from Iowa.
Soybean acres were left unchanged. MYAPs were revised substantially upward to
$3.50 per bushel for corn and $9.25 per bushel for soybeans.
Starting in mid-August, China began to make large purchases of U.S. corn and
soybeans.29 While much uncertainty remains about the eventual size of Chinese
grain and oilseed imports, market optimism and concerns about weather-related
production issues fueled a rise in commodity prices in the U.S. futures market
that began in mid-August (starting on August 12) and have pushed soybean
prices for the nearby futures contract to surpass $10 per bushel on September
14.30
26 NASS, USDA, Acreage, June 30, 2020.
27 USDA, World Agricultural Outlook Board (WAOB), World Agricultural Supply and Demand Estimates (WASDE),
August 12, 2020.
28 A derecho is a weather event caused by severe thunderstorms and often characterized by 70-100 mph straight-line
winds. Krissa Welshans, “Derecho storm causes widespread, significant damage,” Feedstuffs, August 11, 2020.
29 Keith Good, “China Could Become Largest Corn Importer, While Soybean Variables Come Into Focus,” Farm
Policy News, September 10, 2020.
30 Chicago Mercantile Exchange, “Soybean Futures Quotes for the November 2020 contract,” CME Group, accessed on
September 15, 2020.
Congressional Research Service 8U.S. Farm Income Outlook: September 2020 Forecast
Figure 4. U.S. Drought Monitor for September 8, 2020
Source: The National Drought Mitigation Center, University of Nebraska-Lincoln, at https://droughtmonitor.unl.edu/.
Why the Emphasis on Corn and Soybeans?
Often the discussion of the U.S. agricultural situation focuses on what is happening with corn and soybeans to the
exclusion of many other important crops. This is due largely to the fact that corn and soybeans are the two largest
commercial crops in the United States in terms of both value and acreage. The corn and soybean crops provide
important inputs for the domestic livestock, poultry, and biofuels sectors. In addition, the United States is
traditionally one of the world’s leading exporters of corn, soybeans, and soybean products—vegetable oil and
meal.
Since 2010, the United States has used about 34% of its annual corn supply for feed, another 34% for biofuels, 12%
for exports, and 9% for food processing, while 11% on average are retained as stocks. Similarly, since 2010, 49% of
U.S. soybean supplies have been used domestically—“crushed” into soybean meal and oil, while 43% has been
exported, and 8% has gone into stocks. As a result, the outlook for these two crops is critical to both farm sector
profitability and regional economic activity across large swaths of the United States, as well as in international
markets.
U.S. Livestock Developments and Outlook for 2020
Because the livestock sectors (particularly dairy and cattle, but hogs and poultry to a lesser
degree) have longer biological lags and often require large capital investments up front, they are
slower to adjust to changing market conditions than is the crops sector. Furthermore, once an
animal or poultry is market-ready—that is, once it has attained the optimal weight gain and is
ready to be sold—the producer will need to sell it to capture the maximum benefit of the weight
gain and to avoid further costs associated with holding the animal or poultry for any additional
period. In contrast, grain or oilseed producers can simply continue to store their commodities if
market conditions change unexpectedly. As a result, the demand shocks related to COVID-19
impacted the livestock sector more severely than the crops sector.
Congressional Research Service 9U.S. Farm Income Outlook: September 2020 Forecast COVID-19 Impacts the U.S. Livestock Sector Starting in mid-April, a surge in infections among workers in meat packing plants and other food processing plants led to multiple plant closures and contributed to unexpected surpluses of ready- for-market hogs, cattle, and poultry at the farm level.31 Producers were forced to either euthanize their animals or continue to feed them at a loss. Meat processing plant closures have two opposing market effects: on the one hand, demand for livestock in the surrounding region is reduced, and this tends to depress cash and futures prices, lowering prices that producers receive and that packers pay for market-ready livestock; on the other hand, the supply of consumer-ready products is reduced, which tends to raise wholesale and retail prices for the affected products. As evidence of this, USDA reported a widening gap between farm and wholesale prices for beef in the spring.32 Most of the affected meat processing plants have been brought back on line but are operating under new safety guidelines and often with fewer workers on site at any given time. In many cases, these changes have slowed the operating line speed and the amount of throughput. An examination of the farm, wholesale, and retail price data for beef and pork suggests that the price spread between farm and retail prices peaked in May and June and has subsided somewhat in July but still remains at historically high levels.33 Beef and Egg Production Decline and Pork, Poultry, and Milk Expand in 2020 Growth in beef (-0.4%) and egg (-2.1%) production are expected to turn negative in 2020, while pork (+2.2%), poultry (+1.1%), and milk (+1.6%) production are projected up.34 This is in contrast with 2019 when all five protein categories experienced robust year-over-year growth— beef (+1.1%), pork (+5.0%), poultry (+2.5%), eggs (+2.6%), and milk (+0.4%). USDA projects protein production under all five categories to return to positive growth in 2021. Prior to COVID-19, nearly 54% of U.S. food consumption occurred outside of the home, including much of the consumption of meat products. A key uncertainty for the meat-producing sector is whether demand for meat products (in both the domestic and export markets) will return to pre-COVID-19 levels or whether a new equilibrium will be established that absorbs the growth in output projected for 2021. This balance between demand and supply will determine the direction of livestock, poultry, egg, and milk prices. Livestock-Price-to-Feed-Cost Ratios Signal Lower Profitability Outlook The changing conditions for the U.S. livestock sector may be tracked by the evolution of the ratios of livestock output prices to feed costs (Figure 5). A higher ratio suggests greater profitability for producers.35 The cattle-, hog-, and broiler-to-feed ratios have all exhibited 31 CRS Insight IN11366, COVID-19 Disrupts U.S. Meat Supply; Producer Prices Tumble. 32 William Hahn, “Record increase in March farm-to-wholesale beef price spread driven by sharp wholesale price changes in mid-March 2020,” Chart of the Day, USDA, ERS, April 23, 2020. See also “Cash Prices, Meat Cutout Diverge,” ProFarmer, April 25, 2020. 33 Michael Nepveux, “Pandemic Results in Record Farm-to-Retail Price Spreads in Beef and Pork,” American Farm Bureau Federation (AFBF), Market Intel, September 4, 2020. 34 WAOB, USDA, WASDE, Table—U.S. Meat Supply and Use; and Table—U.S. Egg Supply and Use, pp. 32-33, September 11, 2020. 35 The ratio is calculated as the farm price for milk, cattle (steers and heifers), hogs, and broilers compared with their major feed source: Cattle and hog feed cost is 100% corn; broilers feed cost is 58% corn and 42% soybeans; dairy feed Congressional Research Service 10
U.S. Farm Income Outlook: September 2020 Forecast

significant volatility during the 2017-2020 period but in general have trended downward during
2018 through 2020, suggesting eroding profitability.36
The milk-to-feed price ratio trended upward from mid-2018 into late 2019 before collapsing in
early 2020. However, as the prospects for large corn and soybean crops in 2020 pushed feed
prices lower, the profitability of milk production improved, and the milk-to-feed ratio rose into
mid-2020. This trend may again reverse itself as USDA has recently raised its outlook for grain
and oilseed prices in 2020, while continuing to forecast lower milk prices in 2020 and 2021.37
These results vary widely across the United States. Many marginally profitable cattle, hog,
broiler, and milk producers face continued financial difficulties.

                    Figure 5. Livestock Farm-Price-to-Feed Ratios, Indexed
  (ratio of national average farm price per 100 lbs. of meat to per-unit feed cost; indexed, 2017 = 100.)

    Source: National Agricultural Statistics Service (NASS), Agricultural Prices, August 30, 2020. Calculations by CRS.
    Notes: The livestock feed price ratio is calculated as the farm price for milk, cattle (steers and heifers), hogs,
    and broilers to their major feed source: cattle and hog feed cost is 100% corn; broilers feed cost is 58% corn and
    42% soybeans; and dairy feed cost is a mix of corn, soybean meal, and alfalfa hay.

Gross Cash Income Highlights
Projected farm sector revenue sources in 2020 include crop revenues (46% of sector revenues),
livestock receipts (38%), government payments (9%), and other farm-related income (8%),
including crop insurance indemnities, machine hire, and custom work (Figure 6). Total farm
sector gross cash income for 2020 is projected up slightly (+0.2%) to $428.8 billion, as large

cost is a mix of corn, soybean meal, and alfalfa hay. Feed costs—at 30%-80% of variable costs—are generally the
largest cost component in livestock operations.
36 Broilers are chickens raised for meat. Layers are chickens retained for egg production.

37 WAOB, WASDE, U.S. Dairy Prices, September 11, 2020, p. 34.

Congressional Research Service                                                                                      11
U.S. Farm Income Outlook: September 2020 Forecast
declines in cash receipts from livestock activities (down $14.3 billion or -3.3%) are offset by
record government payments (up $14.7 billion or +65.7%).
Figure 6. Farm Gross Cash Receipts by Source, 2010-2020F
Source: ERS, “2020 Farm Income Forecast,” September 2, 2020. All values are nominal—that is, not adjusted
for inflation. Values for 2020 are forecasts. Gross farm income percentage shares (right-hand side) are for 2020;
totals may not add to 100 due to rounding.
Notes: Farm-related income includes income from custom work, machine hire, agritourism, forest product
sales, crop insurance indemnities, and cooperative patronage dividend fees.
Crop Receipts
Total crop sales peaked in 2012 at $231.6 billion when a nationwide drought pushed commodity
prices to record or near-record levels. In 2020, crop sales are projected at $196.6 billion, up 1.0%
from 2019 (Figure 7). Projections for 2020 and percentage changes from 2019 include the
following
feed crops—corn, barley, oats, sorghum, and hay: $57.0 billion (-4.5%);
oil crops—soybeans, peanuts, and other oilseeds: $36.1 billion (-0.6%);
fruits and nuts: $33.6 billion (+17.0%);
vegetables and melons: $19.4 billion (+2.3%);
food grains—wheat and rice: $11.0 billion (-6.7%);
cotton: $6.6 billion (-7.3%); and
other, including tobacco, sugar, greenhouse, and nursery: $32.9 billion (+2.6%).
Congressional Research Service 12U.S. Farm Income Outlook: September 2020 Forecast
Figure 7. Crop Cash Receipts by Source, 2010-2020F
Source: ERS, “2020 Farm Income Forecast,” September 2, 2020. All values are nominal—not adjusted for
inflation. Values for 2020 are forecasts. Percentage shares of crop receipts (right-hand side) are for 2020.
Livestock Receipts
The livestock sector includes cattle, hogs, sheep, poultry and eggs, dairy, and other minor
activities. Cash receipts for the livestock sector grew steadily from 2010 to 2014, when it peaked
at a record $212.3 billion. However, the sector turned downward in 2015 (-10.7%) and again in
2016 (-14.1%), driven largely by projected year-over-year price declines across major livestock
categories (Table A-4 and Figure 8).
In 2017, livestock sector cash receipts recovered with year-to-year growth of 7.9% to $175.6
billion. Cash receipts increased slightly in 2018 (+0.4%) before declining in 2019 (-0.2%). In
2020, cash receipts are projected down sharply (-8.1%) for the sector at $161.7 billion (lowest
value since 2010) due to declines in the four major categories: cattle, hogs, dairy, and poultry and
eggs. Projections for 2020 (and percentage changes from 2019) include
cattle and calf sales: $61.2 billion (-7.7%),
dairy sales: $39.6 billion (-2.2%),
poultry and egg sales: $35.5 billion (-12.1%),
hog sales: $18.5 billion (-15.9%), and
miscellaneous livestock:38 $6.9 billion (+0.7%).
38Miscellaneous livestock includes aquaculture, sheep and lambs, honey, mohair, wool, pelts, and other animal
products.
Congressional Research Service 13U.S. Farm Income Outlook: September 2020 Forecast
Figure 8. U.S. Livestock Product Cash Receipts by Source, 2010-2020F
Source: ERS, “2020 Farm Income Forecast,” September 2, 2020. All values are nominal—that is, not adjusted
for inflation. Values for 2020 are forecasts. Percentage shares of livestock receipts (right-hand side) are for 2020.
Government Payments to the U.S. Farm Sector
Government direct payments to U.S. farmers—projected at a record $37.2 billion in 2020—are
expected to represent 36.2% of projected net farm income of $102.7 billion (Figure 9). The
government share of net farm income reached a peak of 65.2% in 1984 during the height of the
farm crisis of the 1980s. The importance of government payments as a percentage of net farm
income varies nationally by crop and livestock sector and by region.
As shown earlier (Figure 6), federal farm subsidies of $37.2 billion would represent an 8.7%
share of projected gross cash income of $428.7 billion in 2020.
Historically, direct government farm program payments have included39
direct payments (decoupled payments based on historical planted acres);40
price-contingent payments (both coupled and decoupled program outlays linked
to market conditions);
conservation payments (including the Conservation Reserve Program and other
environmental-based outlays);
39 Government farm payments do not include premium subsidies or indemnities paid under the federal crop insurance
program—indemnity payments are included as “farm-related income.” Also, government payments do not include
USDA loans, which are listed as a liability in the farm sector’s balance sheet.
40 Decoupled means that payments are not linked to current producer behavior and, instead, are based on some other
measure outside of the producer’s decisionmaking sphere, such as historical acres planted to program crops.
Decoupling of payments is intended to minimize their incentives on producer behavior.
Congressional Research Service 14U.S. Farm Income Outlook: September 2020 Forecast
ad hoc and emergency disaster assistance payments (including emergency
supplemental crop and livestock disaster payments); and
other miscellaneous outlays, including payments under ad hoc programs initiated
by the Administration, outside of traditional farm-bill authorities, such as Market
Loss Assistance (MLA) payments for relief of low commodity prices, the Market
Facilitation Program (MFP) payments to offset retaliatory tariff damages, and the
Cotton Ginning Cost-Share program—but also legislatively authorized programs,
such as the biomass crop assistance program, peanut quota buyout, milk income
loss, tobacco transition, and other miscellaneous programs.
Figure 9. Net Farm Income by Source, 1996-2020F
Source: Compiled by CRS from ERS, “2020 Farm Income Forecast,” September 2, 2020. Sources of net farm
income, expressed as percentage shares (right-hand side), are for 2020. Values for 2020 are forecasts.
USDA Direct Payments in 2019
In 2019, $22.4 billion in federal payments were made to producers. This was the largest taxpayer
transfer to the agriculture sector (in nominal dollars) since 2005 (Figure 10). The surge in federal
subsidies in 2019 was driven by large “trade-damage” payments made under the MFP initiated by
USDA in response to the U.S.-China trade dispute.41 MFP payments (reported to total $14.5
billion) include outlays from the 2018 MFP program that were not received by producers until
2019, as well as payments under the first and second tranches of the 2019 MFP program, some of
which are expected to be paid in 2020.
41USDA has initiated two trade aid packages with up to $28 billion of financial support designed to partially offset the
negative price and income effects of lost commodity sales to major markets. The 2018 trade aid package was valued at
up to $12 billion (see CRS Report R45310, Farm Policy: USDA’s 2018 Trade Aid Package), while the 2019 trade aid
package was valued at up to $16 billion (see CRS Report R45865, Farm Policy: USDA’s 2019 Trade Aid Package).
Congressional Research Service 15U.S. Farm Income Outlook: September 2020 Forecast
In 2020, MFP payments are projected to decline to $3.8 billion, representing the third and final
tranche of payments from the 2019 MFP program. On September 9, 2020, USDA announced a
new MFP-like program—referred to as the Seafood Trade Relief Program (STRP)—valued at
$530 million, which targets U.S. seafood products that had been affected by retaliatory tariffs.42
However, seafood is not included as part of ERS farm income forecasts. In addition, no further
MFP payments have been announced for 2020 by the Administration.
USDA Direct Payments in 2020
Projected government payments of $37.2 billion in 2020, if realized, would represent a 65.7%
increase from 2019 and would be the largest annual federal subsidy outlay to the agricultural
sector on record in both nominal and inflation-adjusted dollars. The surge in federal subsidies in
2020 is driven by large ad hoc payments made under three Administration-initiated programs:
The 2019 Market Facilitation Program (MFP): most of the 2019 MFP
payments occurred in 2019 ($10.7 billion), but the final $3.8 billion in MFP
payments are expected to be made in 2020.
The 2020 Coronavirus Food Assistance Programs (CFAP1 and CFAP2):
USDA has allocated $16 billion in funding for CFAP1 to address COVID-19-
related damages that occurred during the first half of 2020. As of September 20,
2020, $10.1 billion of CFAP1 funding has been dispersed. USDA has allocated
additional funding of up to $14 billion under CFAP2, also to address COVID-19-
related damages to the U.S. agricultural sector.
The 2020 Paycheck Protection Program (PPP): USDA expects that $5.8 billion
of $7.3 billion of PPP loans to agriculture-related enterprises will be forgiven and
counted as farm income in 2020.43
USDA permanent disaster assistance44 is projected higher year-over-year in 2020 at $2.5 billion
(+14.2%). Most of the $2.5 billion comes from a new, temporary program, the Wildfire and
Hurricane Indemnity Program Plus, enacted through the Disaster Relief Act of 2019 (P.L. 116-
20). Payments under the Price Loss Coverage program are projected at $3.9 billion in 2020, up
from $1.9 billion in 2019. In contrast, Agricultural Risk Coverage outlays are projected to decline
to $39 million, down from $641 million in 2019 (see “Price Contingent” in Figure 10).45
Conservation programs include all conservation programs operated by USDA’s Farm Service
Agency and the Natural Resources Conservation Service that provide direct payments to
producers. Conservation payments are forecast at $4.0 billion for 2020, up 5.0% from $3.8 billion
in 2019, and are expected to account for 11% of federal farm support in 2020.
42 USDA, “USDA Supports U.S. Seafood Industry Impacted by Retaliatory Tariffs,” news release, September 9, 2020,
at https://www.farmers.gov/Seafood.
43 For information on the PPP loan forgiveness, see CRS Report R46397, SBA Paycheck Protection Program (PPP)
Loan Forgiveness: In Brief.
44 Fiscal year payments generally involve outlay commitments incurred during the previous crop year. For example,
FY2019 disaster assistance payments are primarily related to disasters for crops that were grown and harvested in 2018.
See CRS Report RS21212, Agricultural Disaster Assistance, for information on available farm disaster programs.
45 For details, see CRS Report R43448, Farm Commodity Provisions in the 2014 Farm Bill (P.L. 113-79).
Congressional Research Service 16U.S. Farm Income Outlook: September 2020 Forecast
Figure 10. U.S. Government Farm Support, Direct Outlays, 1996-2020F
Source: ERS, “2020 Farm Income Forecast,” September 2, 2020. All values are nominal (not adjusted for
inflation). Values for 2020 values are forecasts. Government payments as percentage shares (right-hand side) are
for 2020.
Notes: Data are on a calendar-year basis and reflect the timing of the actual payment. “Direct Payments”
include production flexibility contract (PFC) payments enacted under the 1996 farm bill and fixed direct
payments (DP) of the 2002 and 2008 farm bills. “Price-Contingent” outlays include loan deficiency payments,
marketing loan gains, counter-cyclical payments, Average Crop Revenue Election, Price Loss Coverage,
Agricultural Risk Coverage, and the dairy Margin Protection program (MPP), and Dairy Margin Coverage (DMC)
payments. “Conservation” outlays include Conservation Reserve Program (CRP) payments along with other
conservation program outlays. “Ad Hoc and Permanent Disaster” is divided into payments under the Market
Facilitation Program (MFP), Paycheck Protection Program (PPP), Coronavirus Food Assistance Program (CFAP),
Market Loss Assistance (MLA), and “Disaster Assistance” programs, each of which is identified with a different
blue pattern. “Disaster Assistance” is an aggregate category that includes supplemental crop and livestock
disaster payments and other emergency payments to the agriculture sector, such as payment made under the
Wildfire, Hurricane Indemnity Program (WHIP). “Miscellaneous” outlays include payments under the cotton
ginning cost-share, biomass crop assistance, peanut quota buyout, milk income loss contract, tobacco transition,
and other miscellaneous payment programs.
Dairy Margin Coverage Program Outlook
The 2018 farm bill (P.L. 115-334) made several changes to the previous Margin Protection
Program (MPP) for dairy, including a new name—the Dairy Margin Coverage (DMC) program—
and expanded margin coverage choices from the original range of $4.00-$8.00 per hundredweight
(cwt.).46 Under the 2018 farm bill, as a cushion against low milk prices, producers have the option
of buying coverage to insure a margin between the national farm price of milk and the cost of
feed up to a threshold of $9.50/cwt. on the first 5 million pounds of milk coverage.
46The margin equals the All Milk price minus a composite feed price based on the formula used by the Dairy Margin
Coverage (DMC) of the 2018 farm bill starting January 2019 and, for all prior months, the Margin Protection Program
(MPP) of the 2014 farm bill (P.L. 113-79). See CRS Report R45525, The 2018 Farm Bill (P.L. 115-334): Summary
and Side-by-Side Comparison, and CRS In Focus IF10195, U.S. Dairy Programs After the 2014 Farm Bill (P.L. 113-
79).
Congressional Research Service 17U.S. Farm Income Outlook: September 2020 Forecast
Figure 11. The Dairy Output-to-Input Margin
(dairy margin equals the national average farm price of milk less average feed costs per 100 pounds of
milk)
Source: NASS, Agricultural Prices, August 30, 2020. Calculations by CRS. All values are nominal.
Note: The margin equals the All Milk price minus a composite feed price based on the formula used by the
DMC of the 2018 farm bill starting January 2019 and, for all prior months, the MPP of the 2014 farm bill (P.L.
113-79). See CRS Report R45525, The 2018 Farm Bill (P.L. 115-334): Summary and Side-by-Side Comparison.
The DMC margin differs from the USDA-reported milk-to-feed ratio (shown in Figure 5) but
reflects the same market forces. In 2019, the formula-based milk-to-feed margin used to
determine government DMC payments started the year near $8.00/cwt. but rose to over
$12.00/cwt. by year’s end, thus exceeding the newly instituted $9.50/cwt. payment threshold
(Figure 11). In 2020, the DMC margin plummeted to below $6.00/cwt. in May before jumping to
$12.30/cwt. in July. The volatility is a function of market uncertainty over feed prices, as
described earlier in this report. USDA projects that the DMC program will make $219 million in
payments in 2020, down from $295 million in 2019.
Production Expenses
Total production expenses for 2020 for the U.S. agricultural sector are projected at $344.2 billion
in nominal dollars, down $4.6 billion (-1.3%) from 2019 (Figure 12). Production expenses
peaked in both nominal and inflation-adjusted dollars in 2014, then trended lower through 2019
in inflation-adjusted dollars and are projected lower again in 2020.
Production expenses affect crop and livestock farms differently. The principal expenses for
livestock farms are feed costs, purchases of feeder animals and poultry, and hired labor. In
contrast, fuel, seed, pesticides, interest, and fertilizer costs are major crop production expenses.
USDA projects that 6 of the 10 major expense categories will rise in 2020—including feed, labor,
fertilizer, seed, net rent, and taxes (Figure 13). Expenses for livestock and poultry purchases,
pesticides, interest, and fuel are expected to decline in 2020.
Congressional Research Service 18You can also read