The Design and Legacy of the 2024 Olympics in San Francisco - Micheline Chagniot University of California: Davis Landscape Architecture Senior ...
←
→
Page content transcription
If your browser does not render page correctly, please read the page content below
The Design and Legacy of the 2024
   Olympics in San Francisco

               Micheline Chagniot
           University of California: Davis
             Landscape Architecture
                Senior Thesis 2013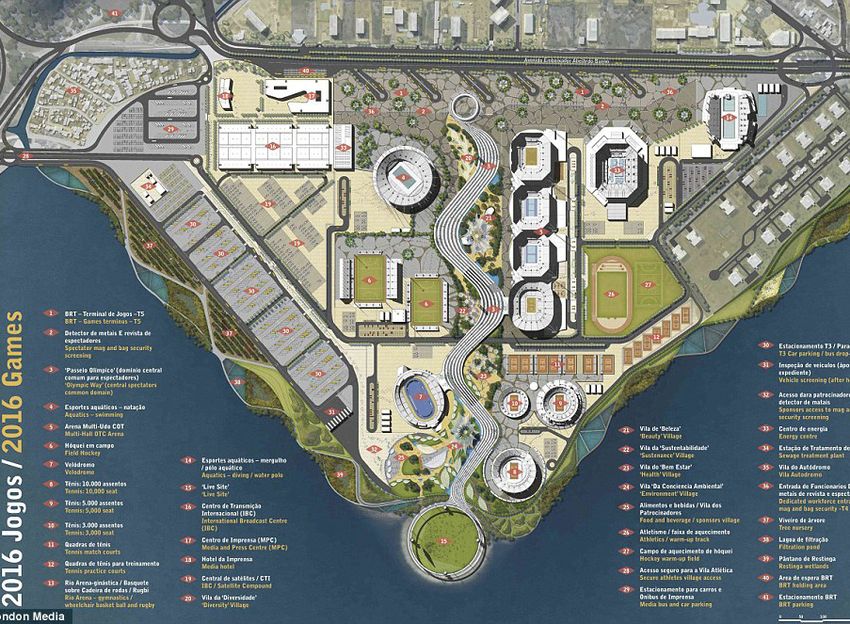
The Design and Legacy of the 2024 Olympics in San
                      Francisco
                                             By Micheline Chagniot

Presented to the faculty of the Landscape Architecture Department of the University of California, Davis on June 14,
  2013 in partial fulfillment of the requirements for the Degree of Bachelors of Science in Landscape Architecture.

Accepted and Approved By:

____________________________________________                ____________________________________________
Stephen Wheeler, Senior Project Faculty Advisor             Heath Massey, Committee Member

____________________________________________                ____________________________________________
David Chursenoff, Committee Member                          Michael Rios, Committee Member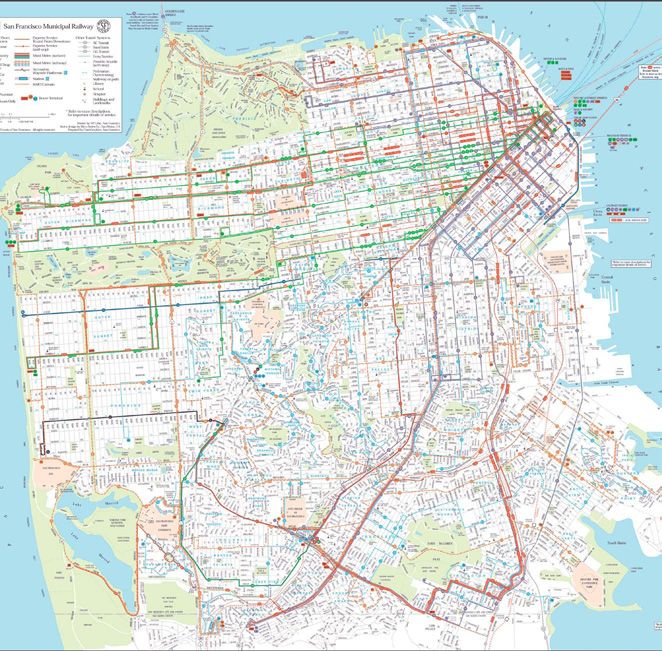
Abstract

With the possibility of placing a bid for the 2024 Summer Olympic Games, San Francisco could help bring the world to-

gether while proudly displaying its unique identity as a US city. San Francisco is capable of hosting the Summer Olympics

due to the existing transportation systems, hotels, and athletic venues within the surrounding are. With emphasis placed

on the legacy design, the termination of the Games will result in economic soundness of the city by bringing jobs to the

Olympic Park area and through an increase in tourism. The legacy will revive San Francisco’s Bayview and Hunters Point

neighborhoods and positively affect the economy and lifestyles of residents in the area. This legacy design will cater to the

intent of the Hunters Point Redevelopment Plan and serve as a model for future Olympic Games.
To my parents for all they have done for me, my Tante Suzanne
and Uncle Ferdinand, and to the LDA class of 2013. I couldn’t
                have done it without you guys.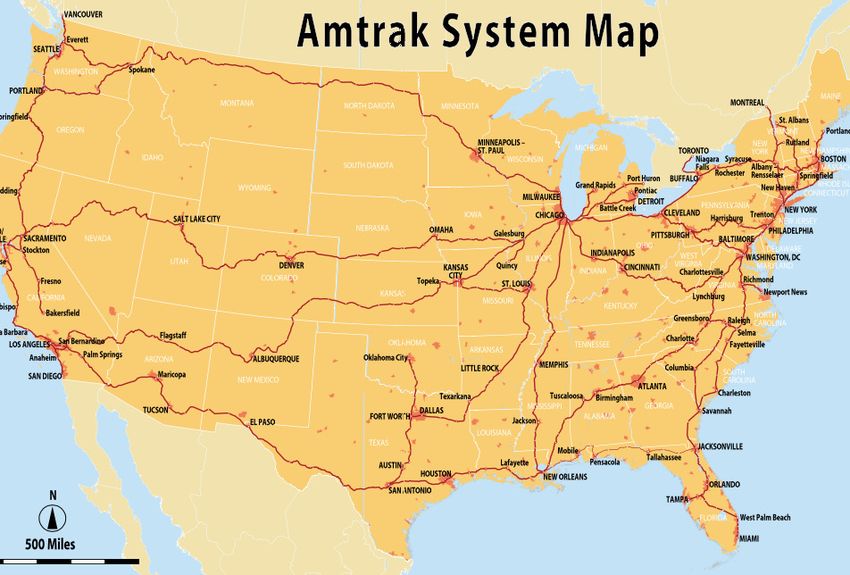
Acknowledgements
   With my deepest gratitude, appreciation, and love, I would like to thank the following people for helping make this
entire process and project possible. Without them, I wouldn’t be here today.

To my committee members:

Michael Rios
Thank you for showing me the world of Urban Design. Because of you, I know what I want to become. You have
helped me out tremendously in so many ways and have been such an inspiration to me. You have taught me so much
and I am forever thankful.

Heath Massey
Thank you for supporting me throughout this entire project and these past few years here at Davis. You have been an
absolute pleasure to study under and I have grown so much as a designer through the knowledge you have given me.
Thank you for always inspiring me to keep developing my designs and ideas.

David Chursenoff
Churchy, thank you for seeing this process through the eyes of a student. You have been the utmost helpful with your
research and enthusiasm about this project. Thank you for constantly checking up on me, offering your assistance,
and being so dedicated to the entirety of this project.
To my family, friends, and loved ones:

Mom and Papa
Thank you for funding my five years of college. You’ve motivated me to work hard and have always told me that I
could accomplish this, even when the finish line felt nonexistent. Most importantly, thank you for supporting me in
choosing a major that I love. It was a roundabout process, but I think I have become a better person because of it. I
hope to make you two proud. Merci pour tout.

My little sister
Thanks for putting up with all of my text messages at 3am.

Amie Patel
Thank you for all of your love and support, Amie. You have kept me sane throughout these past three years and have
been such a wonderful and encouraging person. You are an inspiration to me and I know that you will one day be a
great urban designer. It’s kismet. You are one of the most loyal friends I have ever met.

Johann Holvick-Thomas
Johann, I would not be in this major if it wasn’t for you. You showed me the world of Landscape Architecture and
have been there with me through thick and thin. Your honesty and love have helped me become who I am today as a
person and as a designer. Thanks for everything.

The LDA class of 2013
Words do not express the connection I have made with you guys throughout these past few years. I will miss you
all tremendously. You are all some of the hardest working and most talented people I have ever met. You have all
changed my college life here in Davis for the better. I know that you will all go far in life. You are all my inspiration.

Coffee
For with coffee, almost anything can be done.
Preface
One of my first memories of the Olympics is watching the 2000 Sydney Games with my dad in the kitchen. I was enthralled

and amazed by the athletes from all over the world competing under one roof in events they had dedicated their entire lives

to. I remember asking my dad why we had not watched the Olympics before then and why we didn’t watch them more often.

He then explained to me of their occurrence every four years and how teams from different countries send only their best

athletes to represent their nation. From then on, I had a very raw understanding of what the Olympics meant to me and

perhaps most of the world. The Olympics are peace. They are unity. Talent, grace, athleticism, thankfulness, dedication,

sympathy, empathy, heartache, and celebration. Countries put aside their differences and come together to celebrate and

marvel over the potential of the human form. People don’t wish pain upon others-- they wish only for human success. These

athletes understand the sacrifices their competitors have made and show the utmost grace and respect to each other. They are

a model for how we as a people should act toward one another. Ever since that evening in the kitchen, I have been hooked on

the Olympics.

My passion thus far in life has been bringing people together, making others happy, and acquiring knowledge. With this

project, I was able to challenge myself in ways that I wasn’t sure were possible. Since starting this quarter, I have grown as a

designer and a researcher and hope that it is evident in my designs. This design is intended to show pride of my hometown

while bringing the world together for two and a half weeks of peace.
Table of Contents

                    01
                    04
                    14
                    32
                    44
                    53
Introduction Part I: Case studies 5. Choosing a Host City 6. Past Olympics 11. What’s to Come: Rio de Janeiro 2016 Part II: Site suitability & Venues 15. Zoning 17. Transportation 22. Housing 24. Venues Part III: olympic park & legacy design 33. Hunters Point Redevelopment Plan 37. Olympic Park 40. Legacy Design Part IV: Olympic village design & Legacy 45. Olympic Village: Introduction 46. During the Olympics 51. The Legacy references
LIST OF Figures
Figure 1.0    Logo of the Los Angeles Olympics....................................................................................................................5
Figure 1.1    Home of the Trojans............................................................................................................................................5
Figure 1.2    Abandoned Swimming Pool..............................................................................................................................8
Figure 1.3    The Ruins of the Diving Pool.............................................................................................................................8
Figure 1.4    Another Neglected Stadium..............................................................................................................................8
Figure 1.5    Beijing National Aquatic Centre.......................................................................................................................9
Figure 1.6    Beach Volleyball Stadium...................................................................................................................................9
Figure 1.7    Public Water Park................................................................................................................................................9
Figure 1.8    Decrepit Stadium.................................................................................................................................................9
Figure 1.9    London Olympic Park Plan...............................................................................................................................10
Figure 1.10   An Aerial of the Park..........................................................................................................................................10
Figure 1.11   London Olympic Village....................................................................................................................................10
Figure 1.12   Rio 2016................................................................................................................................................................11
Figure 1.13   The Four Zones...................................................................................................................................................12
Figure 1.14   Rio Olympic Plan................................................................................................................................................12
Figure 1.15   Rio Olympic Legacy............................................................................................................................................12

Figure 2.0    San Francisco Zoning: Opportunities..............................................................................................................15
Figure 2.1    San Francisco Planning Department Zoning Map.........................................................................................16
Figure 2.2    The Four Airports...............................................................................................................................................17
Figure 2.3    SF Muni Map.......................................................................................................................................................18
Figure 2.4    Caltrain.................................................................................................................................................................19
Figure 2.5    Capitol Corridor in the Bay Area......................................................................................................................20
Figure 2.6    Amtrak, USA.......................................................................................................................................................20
Figure 2.7    Freeways...............................................................................................................................................................21
Figure 2.8    Ferry Routes........................................................................................................................................................21
Figure 2.9    California Venues................................................................................................................................................24
Figure 2.10   California and Bay Area Venue Chart.............................................................................................................25
Figure 2.11   Bay Area Venues Map.................................................................................................................................................26
Figure 2.12   Existing San Francisco Venues Chart.......................................................................................................................27
Figure 2.13   Pre-Olympic Venues to Build....................................................................................................................................27
Figure 2.14   San Francisco Venues Map........................................................................................................................................28
Figure 2.15   Olympic Park Venues Chart......................................................................................................................................29
Figure 2.16   Olympic Park Venues Map........................................................................................................................................30

Figure 3.0    HPRP Statistics............................................................................................................................................................33
Figure 3.1    HPRP.............................................................................................................................................................................34
Figure 3.2    Olympic Park Master Plan.........................................................................................................................................37
Figure 3.3    Olympic Park Legacy..................................................................................................................................................39

Figure 4.0    Olympic Village Illustrative.......................................................................................................................................45
Figure 4.1    Olympic Village Perspective......................................................................................................................................47
Figure 4.2    Olympic Village Boulevard........................................................................................................................................47
Figure 4.3    Olympic Village Amenities........................................................................................................................................49
Introduction
    Every four years, the world comes together to watch the world’s greatest athletes compete in a two and a half week long

    event. With national pride booming during the Olympic Summer Games, hosting The Games is considered a great hon-

    or. Yet, the application process in becoming a host city, as well as the preparations necessary, may be more daunting than

    one would expect. The International Olympic Committee (IOC) follows strict guidelines to ensure that the Olympics are

    hosted by cities fully capable of taking on such an endeavor. Before a city makes an Olympic bid, it is imperative that they

    understand the potential repercussions of hosting this event. By examining past Olympic host city designs, layouts, and

    legacies, it is evident that San Francisco is comparable to past host city on all accounts. San Francisco can serve as a model

    for a successful Summer Olympic city and Legacy design. A successful Olympic design is one that can support the Olympics

    during their two and a half week duration while also considering how the host city will transform once the events have been

    terminated. Since the legacy of The Games is what a city will forever have, it is crucial to generate a design that will work in

    junction with the city and its inhabitants. The design goal is to create a successful Olympic City design and legacy design

    that will help the city flourish and avoid debt. The following design has been modeled after past successful Olympic Games

    while also examining the pitfalls that other cities have fallen victim to. By examining their failures and reasons for inade-

    quacy, I am able to create a design that will best help San Francisco, the Bay Area, and the USA from avoiding insurmount-

    able amounts of debt.

1
The logo chosen to represent the 2024 Olympics for this project is a design by graphic designer Michael Walsh. The logo
contains hues of the Olympic ring colors and eludes to both the Olympic Torch as well as the Golden Gate Bridge. Logos
chosen for the Olympics are meant to represent the host city and that years Summer Games.
The motto for the city of San Francisco is “Gold in peace, iron in war.” This motto stems from San Francisco’s history of
natural disasters and the city’s way of rebuilding itself each time. For this design, “iron in war,” has been eliminated from
the representation of the games since this is supposed to be a peaceful time that the world comes together as one. The latter
peace” seems to be fitting for the Olympics since gold medals are what each individual strives towards.
The Paralympics start once the Olympic Games are terminated. The Paralympics, led by the International Paralympic
Committee (IPC), use the same venues as the Olympic Games. Fewer venues are needed for the Paralympic games as there
are fewer competitors and sports played. The only three sports added to the Paralympic Games which are not included in
the Olympic Games are boccia, goalball, and rugby. Otherwise, the events are relatively similar with slight modifications to
the events to allow for disabled competitors. The 2024 San Francisco Olympic Design has been planned to function for the
Paralympic Games as well as the Olympic Games, but the focus of this project will be on the latter. The existing venues will
be able to serve their duties as Olympic and Paralympic venues.
2Part I Case Studies
Choosing a Host City

    Before considering a design for an Olympic Host City, it is important to have a rough understanding of the Olympic

    bidding process. With an understanding of the bidding process, one can see what makes a city an ideal host candi-

    date. When a city places a bid for the games (costing roughly $150,000 USD), the IOC spends almost an entire year

    investigating the city on several key facts. Some of the factors considered are as follows:

            1) An Olympic host city must be big enough to support the Olympics and the influx of people it

            will cause. There must be an adequate transportation system, plenty of housing/hotel rooms avail-

            able, and they must be able to handle the high level of security necessary during The Games.

            2) The proposed city must convince its residents that hosting the Olympics will improve the city

            and create new jobs. The people should also be aware of the taxes they may receive in order to sup-

            port hosting this event.

            3) The host city must obtain positive media coverage to aid in the development of The Games.

    Looking at past Olympic legacy failures, the design of the site after the Games have been terminated is becoming in-

    creasingly important in choosing host cities (Cashman, 2002).

5
Past Olympics
Los angeles (1984)
The Los Angeles Olympic games caused a shift in the way
host cities view venues. LA, being expansive and largely
sports based, had many different athletic venues already
existing within the city. The National Olympic Commit-
tee members suggested that they improve upon existing
venues for the Games rather than building entirely new
ones. Only two venues needed to be built, resulting in
a $200 million profit from the Games. Both UCLA and
Figure 1.0 Logo of the Los Angeles Olympics
USC used their student housing to ensure that there was
adequate housing for the tourists coming to their city.
The profit made during this Olympiad was the largest
ever and thus sparked a renewed interest in cities hosting
The Games. The venues were then converted back into
sports venues to support local teams and events. This
Olympiad is known for its small Olympic footprint as
the games came, went, and moved on. The city structure
itself was barely changed or affected (Usborne).
Figure 1.1 Once the home of Olympic Athletics and Ceremonies, this stadium is now
the home of the USC Trojans
6Barcelona (1992)
Barcelona has been viewed as having one of the most to becoming a livable city (Usborne).
successful Olympic legacies. Host cities strive towards
creating a legacy much like Barcelona’s. The structure
of the city was changed as Olympic preparations were Sydney (2000)
made. The beach was expanded and businesses grew as
The XXVII Olympiad in Sydney, Australia was seen as one
the nation prepared for the influx of people it would be
of the most successful games by the president of the IOC at
serving. A new port was built in Barcelona as they ran
the time. The games reportedly ran smoothly; however, the
with the theme of “center of commerce.” The number of
aftermath of the event was not as well planned as The Games
hotel rooms in Barcelona more than doubled after the
themselves. The Sydney Olympic Park was not designated
Games as the amount of tourism increased drastically. A
to become anything once the Olympics had passed. It wasn’t
social legacy of their hosting was an increase in sports
until 2005 that the site became residential and commercial use
interest and participation by children of the country.
areas. The Sydney Olympics are seen as a prime example in
One of the goals of the Olympics is to increase sports
Olympic design but not in legacy design. The designers and
participation younger generations. These games did just
planners of the Sydney Games have influenced other Olympic
that. Barcelona has been flourishing in terms of tourism
Games as they have aided in other host city Olympiad plan-
and commerce and it is said that the Olympic Games are
ning. (Usborne).
to thank. Careful Olympic and legacy planning has led
to a successful transformation from hosting The Games
7Athens (2004)
Bringing The Games back to their origin in 2004, the XXVIII
Olympiad in Athens is infamous for its Olympic legacy. It has
become a model of post-game Olympic failure and is known for
having the worst Olympic legacy. Out of the twenty two venues
used for the games, twenty one now lie abandoned (“What be-
Figure 1.2 Abandoned swimming pool
comes of,” 2009). The people of Athens and Greece were forced
to pay higher taxes due to this poor planning and the Games
have also been called a catalyst for Greece’s current suffering
economy (Cashman, 2002). The XXVIII Olympiad has lead to
the IOC taking Olympic legacy design into careful consider-
ation to avoid what Athens has become. It has been stated by
members of the IOC and the NOC members of Athens that poor Figure 1.3 The ruins of the diving pool
planning went into designing The Games and in considering the
aftermath. Hosting the Olympics tends to either transform cities
or bring them to ruin; in the case of Athens, it is quite evident
that the latter occurred (Usborne).
Figure 1.4 Yet another neglected Olympic Stadium
8Beijing (2008)
With a government that differs greatly from that of the USA’s, the Beijing Olympics are a difficult standard to compare
Games to. Roughly 1.5 million people were evicted and removed from their homes in preparations for the Olympic
Games (Borger, 2007). Due to the communist form of government in Beijing, there are very few parameters in developing
an Olympic city and an Olympic legacy. Many of the venues used in these games are now abandoned but some have been
re-purposed for a greater cause. The Ice Cube (used for swimming, diving, and synchronized swimming), for example,
has been converted into a public water park (Usborne).
Top Left: (Figure
1.5) Beijing Nation-
al Aquatic Center
during the Games
Bottom Left: (Figure
1.7 )The Aquatic
Center has since
been turned into a
public water park
The Beach Volleyball
venue during the
Olympics (top right;
Figure 1.6) has since
been abandoned and
forgotten (bottom
right; Figure 1.8)
9London (2012)
Though the games have only recently been terminated, Lon-
don is undergoing many changes to ensure positive growth
of their city. The new houses being developed and the new
transportation system are among the few changes being
brought to London. The Olympic Park is to be renamed the
Figure 1.9 London Olympic Park Plan
Queen Elizabeth Olympic Park. This area of the city had
been neglected for years before the game; with the addition
of this new park, hopefully a positive change will be brought
to the area and create an enjoyable environment for many.
The Olympic/Paralympic Village will be converted into
thousands of new homes, half of which will be affordable
Figure 1.10 An aerial view of the Olympic Park
housing (Beard, 2013). The Olympic Village will be re-
named “East Village” and will contain a educational campus
and a community health center. The Olympics are acting as
a catalyst for positive change in this large and famous city
with the hopes of improving impoverished areas and bring-
ing in droves of tourists (www.london2012.com).
Figure 1.11 London Olympic Village
10What’s to Come: Rio de Janeiro 2016
With much anticipation, the 2016 Games will be the first Olympiad hosted in a South American country. With a large
focus of their design on sustainability, nearly half of the competing athletes will be able to reach their venues in less than
10 minutes, and almost 75 percent will do so in less than 25 minutes. Of the 34 venues (16 are being built) to be used
during the Games, eight will undergo some permanent works, seven will be temporary, and nine are being constructed
as permanent legacy venues. With modifications made in terms of sports played in the games (the addition of gold and
removal of wrestling, for example), 28 sports will be viewed during this 2.5 week event with 10,500 athletes competing.
There will be 7 million Olympic tickets available in total and the Olympic Village will be about 185 Acres with 9,460
bedrooms, averaging 1.87 people per bedroom (www.rio2016.com) .
Figure 1.12 The proposed
Olympic Park for Barra da
Tijuca in Rio de Janeiro,
Brazil
11Figure 1.13 The Olympics will take place primarily in four different zones
within Rio de Janeiro. Barra da Tijuca will contain the main Olympic
Park as well as the Olympic Village.
(Top right; Figure
1.14) The Olympic
Park plan as designed
by AECOM as well
as the Legacy Plan
(Bottom Right; Figure
1.15)
12PART II Site Suitability and venues
San Francisco Zoning
     Before building necessary venues in San Francisco,

     it is imperative to look at land ownership. By ex-

     amining zoning maps of the San Francisco Plan-

     ning Department, one can deduce where building

     venues would be best, specifically the Olympic

     Village. Based off of the SF zoning map, it is im-

     portant to direct our focus to public land and land

     owned by the city. Some areas deemed as “public”

     don’t seem suitable for building venues nor suit-

     able to sustain the influx of people going to those

     sites. The Presidio, for example, is viewed as public

     land yet building venues in this historic area would

     prove to be quite difficult due to site history and

     efforts to protect wildlife in the area. The areas that

     seem most suitable for venue erection are Bayview
                                                               Figure 2.0 The highlighted areas mark areas of opportunity based off of the San Francisco
     and Hunter’s Point. Bayview is already home to            Planning Department’s Zoning Map.

     Candlestick Park, the venue chosen to host athletics
15
Figure 2.1 San Fran-
cisco Zoning Map
and the opening and closing ceremonies. Hunter’s Point is listed under “See Hunter’s Point Redevelopment Plan.”
This redevelopment plan will be used in a way that both caters to their original development plan and those ameni-
ties needed during the Olympics. The redevelopment plan will be further discussed in the subsequent chapter.
16Transportation
In order for a host city to be considered for the Summer Games, they must ensure that transportation in their city is ade-
quate for the games or that it will be made adequate for the 2.5 week period. San Francisco and the Bay Area have the bene-
fit of having an extensive transportation system as well as four international airports located within the area.
Airports
There are three airports located within 46 miles of San Fran-
cisco. San Francisco International Airport is closest to the
Olympic action followed by Oakland International Airport
and lastly San Jose International Airport. Having these three
airports located close to the host city will not only allow for
the Olympians to reach the city but also for spectators to
reach the city without too much air traffic. Another airport,
though located about two hours away from the host city,
is the Sacramento International Airport. By mapping the
different airports in the area, this design is sure to make sure
that the SF Olympics have a global impact as well as a local
impact. Figure 2.2 Four main surround-
ing airports
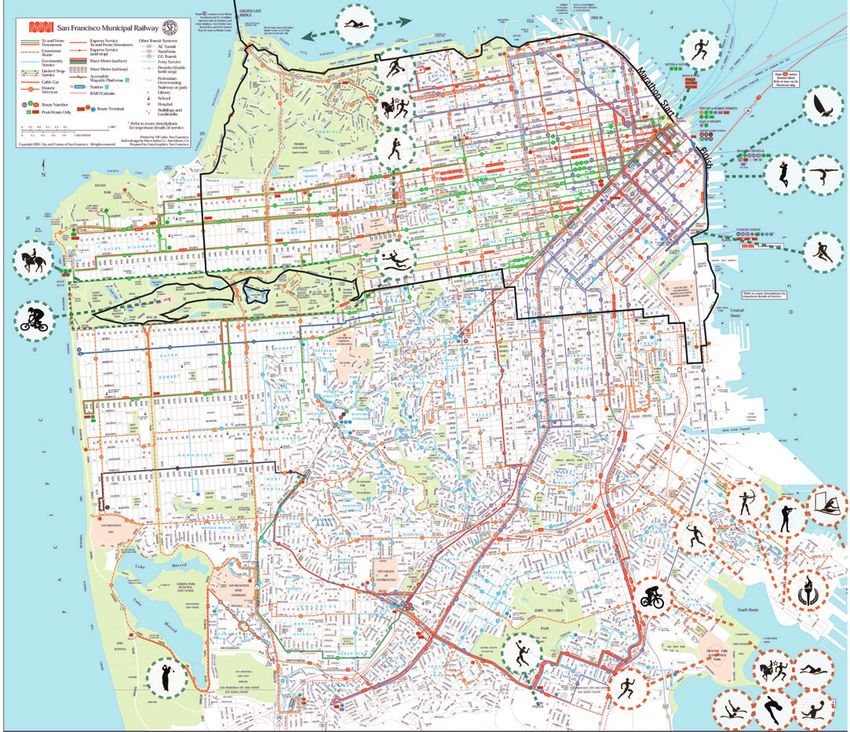
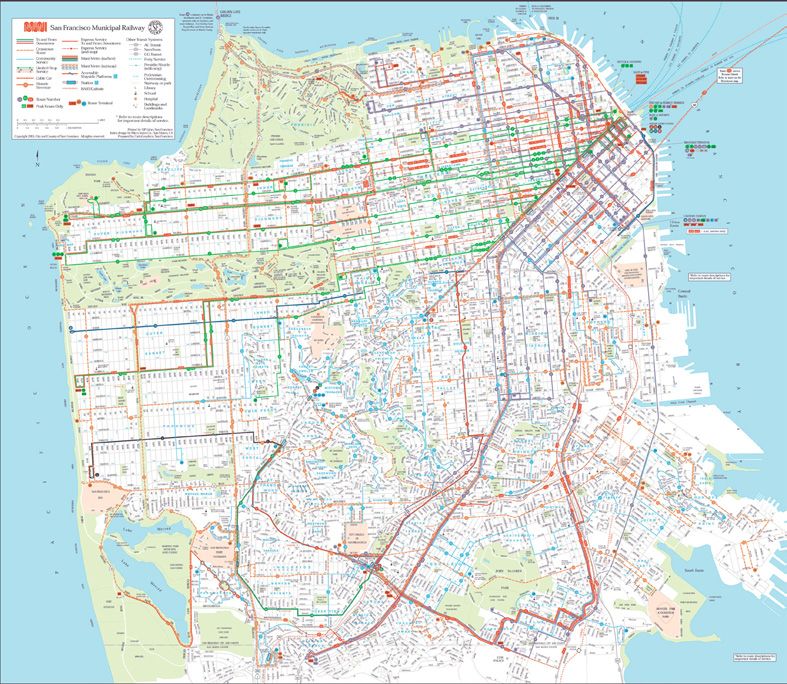
17Muni
SF Muni operates approximately 80 routes with stops
within 2 blocks of 90% of all residences in the city
(www.sfmta.com). The venues chosen for San Fran-
cisco are all accessible by Muni and within walking
distance from Muni lines. For the Olympic Village
and Olympic Park, Muni lines and shuttle services
will either be extended or added temporarily during
The Games. This design strives for public trans-
portation dependence while trying to eliminate the
number of drivers on the road.
Figure 2.3 San Francisco public transportation lines (includes CalTrain, Muni, trollies, and ferry
routes
18Caltrain
Caltrain is a California commuter rail that extends from Gilroy, CA to San Francis-
co, CA. It contains 32 stations and transports roughly 42,354 people on weekdays
(“Stations”). Caltrain will allow for people from different areas of the Peninsula to
work their way upward toward the host city as well as allowing those from the city
to make their way to events South of San Francisco.
Figure 2.4 Caltrain map
19Amtrak
Amtrak will allow for the San Francisco Olympics to be affected on a more national level. It will allow people from all reach-
es of the country to come to The Games at a reasonable price. Some major cities that include Amtrak stops are Montreal,
Boston, Miami, Houston, Denver, Chicago, New York City, Vancouver, Seattle, Portland, San Diego, and Los Angeles. Capitol
Corridor (operated by Amtrak) is fully supported by the state of California yet operates under the Amtrak California brand
(www.capitolcorridor.org). Capitol Corridor runs from San Jose to Auburn. This allows for more travel within the Bay Area
and for people to reach their necessary destinations.
Figure 2.5 Amtrak’s Capitol Corridor route Figure 2.6 The Amtrak System throughout the United States and regions of Canada
20Streets and Freeways Ferries
The ferry routes throughout the San Francisco Bay will traverse
the San Francisco and San Pablo Bays. This will allow for another
means of transportation for those trying to reach the host city or
venues throughout the Bay Area. The ferry ports in San Francisco
are located near Muni stops, allowing for enabling easier circulation
throughout San Francisco.
The extensive freeway system running throughout
the Bay Area allows for rapid movements of large Freeways of the Bay Area (Left; Figure 2.7) and local ferry routes (above; Figure 2.8)
groups of people. The grid-like layout of San Fran-
cisco also makes navigating the city relatively easy
for tourists visiting the area.
21Housing
With lodging being a determining factor in choosing an host The different university campuses in the area can also
city, it is essential to look at the different types of housing serve as hotels much like Georgia Institute of Technolo-
options for those coming to San Francisco and the Bay Area gy, Clark Atlanta University, and Georgia State Univer-
(excluding athletes and those who will be in the Olympic sity of served as housing and Olympic Villages during
Village). Before the London Olympics, there was an estimat- the Atlanta Olympics of 1996 (SITE). Different college
ed 11 million visitors excepted to visit the city. 8.5 million campuses with student housing that could possibly be
sports tickets were put on sale but around 7.5 million were used during the Olympics are the University of Califor-
sold (Oliver, O’Mahony, Palmer, 2012) . nia: Berkeley, University of San Francisco, San Francisco
State University, San Jose State University, Sacramento
As of September 2012, there were 33,642 hotel rooms in San State University, and University of California: Davis.
Francisco and 215 hotels. On average, 2 people stay in each
hotel room (“San Francisco Visitor”).
With the different venues spread throughout the Bay Area,
not all of the visitors will be staying in San Francisco. With
other urban cities surrounding San Francisco, there will be
enough hotels to support the influx of people to the area.
22Venues
It is unknown to many that when a city hosts the Olympics, many events are not held in the host city itself. During the
2008 Beijing Olympics, the farthest venue (Equestrian) was 1,220 miles away in Hong Kong. Hong Kong is roughly a
three and a half hour flight south of Beijing. The farthest venue during the London Olympics was in Glasgow, Scotland
(403 miles), and the farthest venue (football) for the upcoming Olympics in Rio de Janeiro is a two and a half hour plane
ride away in Salvador (1,012 miles). When discussing venues for the San Francisco Olympics, it needs to be pointed out
that not all of these events will be taking place in San Francisco (olympic.org).
It is necessary to not only research existing athletic venues in San Francisco and the Bay Area but to also research venue
sizes and capacities of previous Olympic Games. By examining capacities of the Beijing and London Olympics, an esti-
mated capacity per event has been taken into consideration when deciding which events will take place where. By exam-
ining past Olympic stadiums and researching which events were held where, this design allows for the scheduling of the
Games to be accurate with no scheduling conflicts. . Since most venues will be hosting more than one sport, following
past Olympic schedules ensures that there will be no scheduling conflicts.
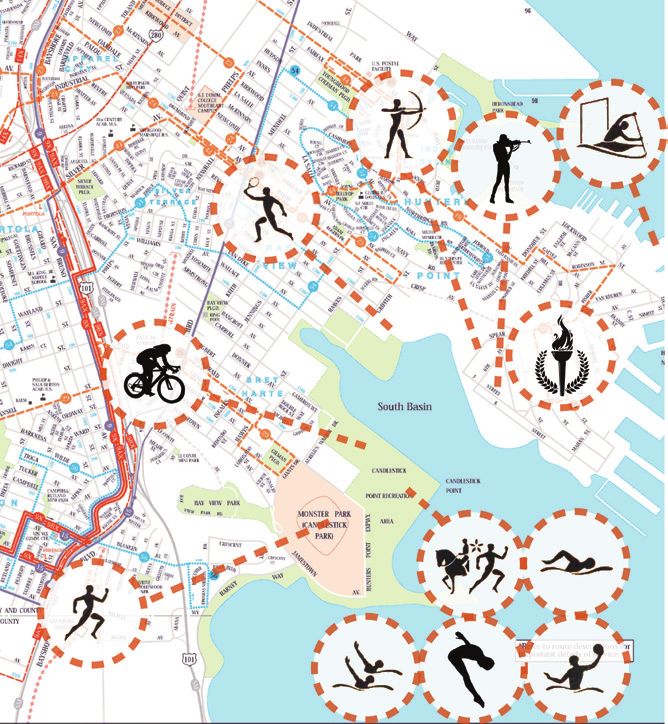
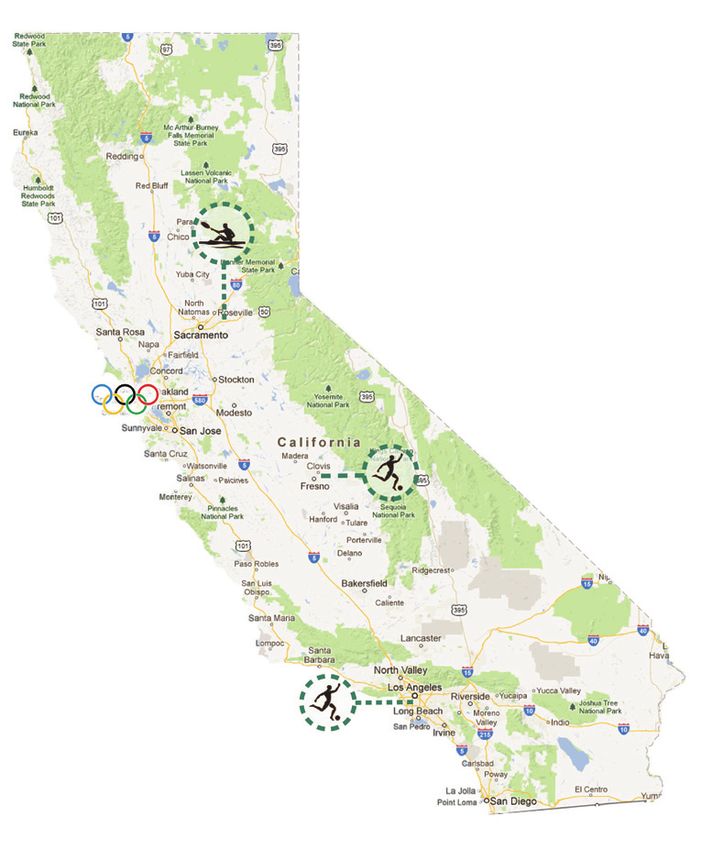
Figure 2.9 California venues map with
legend (right)
23Legend
Football
Rowing and Ca-
noeing (Sprint)
Host City and Bay
Area Venues
24Bay Area and california venues Figure 2.10 25
Legend

     Table Tennis          Handball

    Weightlifting          Football

    Basketball             Fencing

    Badminton              Equestrian

    Gymnastics               Modern
    (rhythmic)               Pentathlon

    Taekwondo              Volleyball

    Judo            Figure 2.11 Bay Area venues and
                    legend (right)

                                            26
Existing Venues in san francisco
Venue Name Capacity Sport
Cow Palace 12,953 Volleyball
AT&T Park 41,915 Field Hockey
Athletics
Candlestick Park 80,000
Ceremonies
Boxing
War Memorial Gymnasium 5,300 Modern Pentathlon (Fencing)
Handball
Kezar Stadium 10,000 Beach Volleyball
San Francisco Marathon Route Standing Athletics (Marathon, Race Walk)
Swimming (Marathon)
San Francisco Bay TBD (est 3,000)
Triathlon
Golden Gate Park Polo Fields 5,500 Cycling (BMX)
San Francisco Cycling Tour TBD Cycling (Road)
Golden Gate Park TBD Equestrian (Cross Country)
Figure 2.12
Venues to be built (Pre-Olympics)
Venue Name Capacity Sport
Warriors San Francisco Arena 17,500 Basketball
Gymnastics (Artistic, Trampoline)
America’s Cup Pier 30 Sailing
Figure 2.13
27Figure 2.14
28Olympic Park Venues
Olympic Legacy must be taken into consideration when designing the Olympic Park. The venues with the largest capaci-
ties have been spread out to ensure that areas of the park do not become to heavy with pedestrian circulation. The Hunters
Point Redevelopment Plan (which will be discussed in the subsequent chapter) was also taken into consideration when
choosing which venues will be made temporary. Creating vistas over the San Francisco Bay is also a goal when choosing
building location and orientation.
Venue Name Capacity Sport
Swimming
Synchronized Swimming
San Francisco Aquatic Center 22,000 Diving
Modern Pentathlon (Swimming)
Water Polo
A.P. Velodrome Track 6,000 Cycling (Track)
Leonard White Water Rafting Center 10,000 Canoeing (Slalom)
Farrell Tennis Stadium 30,000 Tennis
Arnold Target Shooting Field 8,000 Shooting
Owens Archery Green 5,000 Archery
Figure 2.15
29Legend
Athletics Canoeing
(Slalom)
Cycling Olympic Vil-
(Track) lage
Tennis Modern
Pentathlon
(Swimming)
Archery Swimming
Shooting Synchronized
Swimming
Figure 2.16
Diving Water Polo
30PART III Olympic Park Design and legacy
Hunters Point Redeveopment Plan
 The Hunters Point Redevelopment Plan (HPRP) plays a large part in this legacy design. Hunters Point Shipyard (“Ship-

 yard”) is a former naval base which has been planned to undergo extensive redevelopment and planning, including the

 Candelstick Point portion of Bayview. The HPRD is projected to have a total of 12,100 units (residential) and 352.6 acres of

 open space. The buildings in the area will be of various use. These uses are regional retail, neighborhood retile, artist’s stu-

 dio, office/R&D, hotel, arena, and community facilities. Of the housing units, roughly one third will be affordable housing.

 A bus rapid transit system will connect Hunters Point Shipyard, Candlestick Point, and surrounding neighborhoods with

 each other and with Caltrain, Muni, and BART (“Hunters Point Shipyard”).

                                                                                               (Left; Figure 3.0) A
                                                                                               look at the HPRP statis-
                                                                                               tics and the plan itself
                                                                                               (Right; Figure 3.1)

33
34
the Olympic park
 The Olympic Park will be located in Hunters Point and Bay         San Francisco’s 19 and 29 Muni lines are proposed to be

 View in the South Eastern portion of San Francisco. The           rerouted during the duration of the Olympic Games. The

 Olympic Park contains venues for six different sports and         two lines will run through the Olympic Park to allow for

 also includes athletic practice areas. The Park takes advan-      large groups of people to access different venues and areas.

 tage of the waterfront views these two neighborhoods pos-         Shuttle services should also be provided to bring people from

 sess by focusing closely on building orientation and street       neighboring public transportation lines to the Park. The

 layout. By orienting buildings and venues towards the San         rerouting of the 19 and 29 lines also allows for people to park

 Francisco Bay, vistas and axes are created while decreasing       their cars in the Olympic Park parking lots and to then take

 the natural windiness of the site.                                Muni farther into the site. It is also proposed that these lines

                                                                   run at higher frequencies than they currently run to cater to

 Street layout of the Park is heavily influenced by the cur-       the influx of people coming to the site while decreasing the

 rently existing streets (though few) and the proposed street      amount of vehicles on the road.

 layout of the Hunters Point Redevelopment Plan. Many of

 the streets will be closed off during the Olympics to allow for   Different amenities in the area (aside from sporting venues)

 walkability and safety of pedestrians and bicyclists. Vehicu-     are meant to increase usability of the site and the amount

 lar use is discouraged in Olympic planning to allow for more      of people entering the area. The Energy Center and Sew-
 sustainable methods of travel and to decrease the amount of       age Treatment Plant are crucial to every Olympic host city

 traffic in the area.                                              design. The Energy Center will aid in powering the Olym-
35
pic Village as well as sporting venues and other areas of the trance points to allow for the security of athletes, Olympic
Park. It is also encouraged that most of the energy used on officials, and tourists. Car security checks will be preformed
site be from renewable sources. The Sewage Treatment Plant in each of the three parking lots and baggage checks will also
will also serve the people of the Olympic Village by safely and be performed before entering the main site. Parking has
efficiently treating blackwater. also been placed on the outskirts of the Park and has been
refrained from being placed underground to decrease the
The proposed green spaces throught the Park allow for peace- possible threats of terrorist attacks on the Olympic Park and
ful prominades along San Francisco Bay’s waterfront. Much large Olympic venues. Security is always a costly aspect in
of the area is already comprised of natural vegetation and hosting the Olympic Games, but it is a measure that cannot
greenery and the HPRP also works to improve the amount be overlooked.
and quality of green space in the area. These walks allow
for people to walk almost the entirety of the Olympic Park,
thus seeing the venues and different tourist attractions that
the Park has to offer. Walkways through the greenspaces are
modeled after the HPRP.
The Park should only be accessible by a few roads and en-
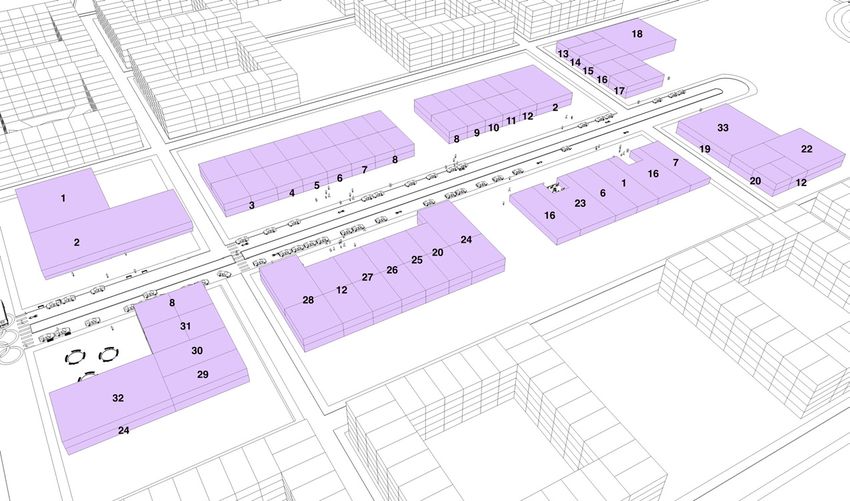
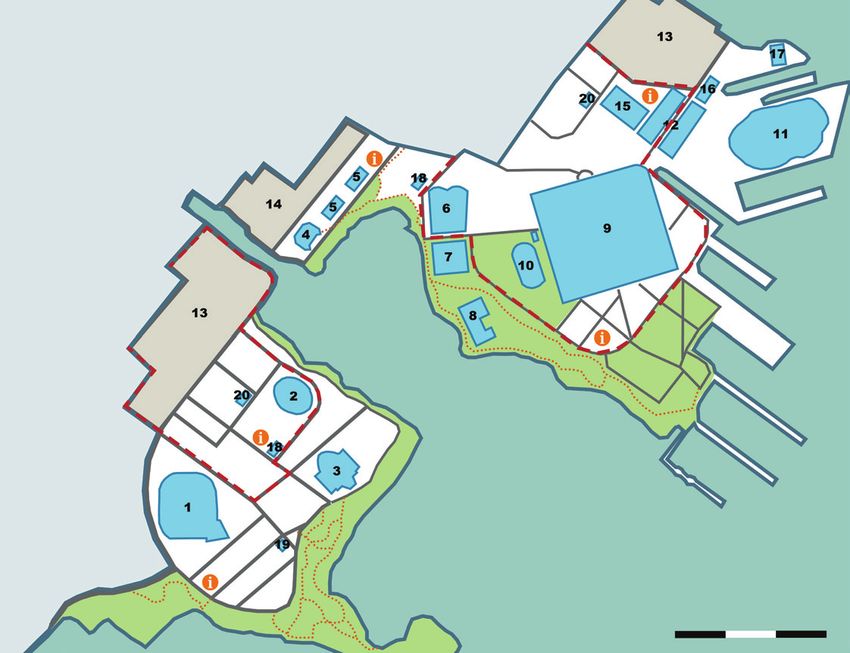
36Olympic Park master plan
0’ 500’ 1000’ 1500’
Figure 3.2 Olympic Park master plan
37Legend
1. Candlestick Olympic Stadium 18. Olympic Souvenir Store
2. AP Velodrome 19. Media Hotel
3. San Francisco Aquatic Center 20. Food and Beverage Village
4. Farrell Tennis Stadium
5. Dinh Tennis Stadium and Practice
Building
Courts
6. Owens Archery Field Park and Green Space
7. Practice Archery Green
8. Arnold Target Shooting Field Parking Lot
9. Olympic Village
10. Olympic Village Practice Fields San Francisco Bay
11. Leonard White Water Rafting Center Information Center
12. International Broadcast Center
13. Car Parking and Bus Drop Off Street
14. Media Bus and Car Parking
15. Media and Press Center Muni Route
16. Energy Center
Pedestrian and Bicycle Path
17. Sewage Treatment Plant
38Figure 3.3 San Francisco
Olympic Legacy plan closely
follows that of the Hunters Point
Redevelopment Plan. Buildings
which have remained from the
Olympic Games are circled in
red
39Venue Legacy
The venues existing prior to the Olympics will resume their ter the Games, it is imperative to draw people into the area
previous functions and uses. Hunters Point, Bayview, and through communal neighborhood amenities and to supply
the Olympic Park will be turned into a site very similar to jobs to those living in the area.
the original Hunters Point Redevelopment Plan. This pro-
posed plan and proposed building adaptations are designed The Olympic Village will contain residential, mixed-use,
to best serve the community and people that will be living and retail/commercial buildings. By keeping the retail/
in the area. commercial buildings, jobs will be brought into the area for
those living there. The Olympic Village will be discussed in
The International Broadcast Center and the Olympic greater detail in the subsequent chapter.
Souvenir Stores will become retail/commercial space. The
Media Hotel will be transformed into high-rise residential This area will be comprised of large parks and open green
as intended for that site by the HPRP. The San Francisco space to encourage people to visit the site. Miles of pe-
Aquatic Center will become a community pool and since destrian and bike trails allow for people to stroll and exer-
such a large venue is not necessary for the area, it will be cise along the waterfront while enjoying a view of the San
reduced in size to something more functional and cost Francisco Bay. Signage can also be implemented to mark
effective. Like the San Francisco Aquatic Center, the Me- the new historical significance of the site and to detail the
dia and Press Center will also be designated as community athletes and events of the San Francisco Games that made
buildings. Since many Olympic host cities fall into debt af- this Olympiad unique.
40Bus routes will be implemented in the area to keep this site connected to the rest of San Francisco. Muni routes will al- low for people from different reaches of the city to visit this site and what it has to offer. A bus rapid transit system will connect Hunters Point, Candlestick Point, and surrounding neighborhoods with each other and with Caltrain, Muni, and BART (“Hunters Point Shipyard”). In order to ensure financial stability and economic growth of the site, efforts must be made to ensure that there are enough jobs in the area as well as ways for people to enter these neighborhoods easily. These two currently impov- erished and industrial neighborhoods must be seen in a new and positive light to draw people into the historic San Francisco Olympic Legacy Park. 41
PART Iv
The Olympic Village Design and
            legacy
Olympic Village Introduction
As previously mentioned, it is crucial for Olympic designs to focus primarily on the legacy design. This has been made
quite evident in the design for the San Francisco Olympic Village. Using zoning maps of San Francisco as well as the
Hunter’s Point Redevelopment Plan to choose the Village location, this design creates a livable neighborhood for people
after the Games while still being able to support the large number of people occupying these units during The Games. The
Olympic Village itself is not open to the public and can only be accessed by those with special privileges.
Figure 4.0
45Olympic village: during the games
Residential Units
During the Olympic Games, athletes , officials, and train- This design contains 3,495 units. Some officials and train-
ers live in dorm-style units. Between 17,500 and 18,000 ers will live in quarters with only 4 tenants in total. The
people stay in the Olympic Village. Due to this discrep- residential building masses are along the outskirts of the
ancy of 500 people, it is best to plan for the possibility Village to provide the athletes with privacy when train-
of their being the larger amount of people. Therefore, ing and when using the centralized public use areas. The
this design caters to the possibility of their being 18,000 center courtyards of each building will allow for athletes
tenants. Looking at the Olympic Village of the London to relax throughout the day to focus on their upcoming
Olympics, units for the San Francisco Olympics will also events. The larger square building masses are 5 stories
have an average of 5.45 people per unit. This results in the high and consist of 160 units each in total. The smaller
need for at least 3,303 units. Units will be 800 sq. feet (2-3 building masses total 60 units each. Some of the central-
bedrooms) and will not contain kitchens until the legacy ized Olympic Village Boulevard mixed use buildings will
plan has commenced. contain dwelling units on their top floors. There are a total
of 55 dwelling units immediately surrounding the Olympic
Village Boulevard.
46Residential Units: 3,495
2-3 bedrooms: 6,990 10,485
bedrooms
Commercial Units: 44
Figure 4.1
Acres: 53
Acres with Training Park: 67
Dwelling Units per Acre: 65.8
D.U./A with Training Park: 51.6
Figure 4.2
47Village amenities
The amenities needed by the villagers during the Games have an interesting and wide range. Catering to thousands of
people and the needs of a variety of people from different backgrounds and cultures, the shared common spaces of The
Village allow for people to focus on their events while also allowing for time to relax and enjoy their time at the San Fran-
cisco Olympic Village.
The commercial area is centrally located within the Village to allow for walkability from all reaches of the site and to create
a sense of community. The area is meant to encourage people to stay in the open spaces while conversing outside. Since
this centralized area is surrounded by buildings, Olympians are allowed privacy from the media and outside world during
their stay.
48Figure 4.3 49
1. Training Pool                17. Sports Information Center
2. Gymnasium                    18. Auditoreum
3. General Store                19. Games Hall
4. Chef ’s Hall                 20. Bank
5. Airport Departure Facility   21. Family Reunion Center
6. Massage Center               22. Religious Center
7. First Aid Station            23. Photoshops
8. Merchendise                  24. Dining Area
9. NOC Service Center           25. Hair Dresser
10. Accreditation               26. Post Office
11. Protocol Office             27. Accreditation
12. Information Center          28. Dance Hall
13. Telecommunication Center    29. Travel Agent
14. Internet Center             30. Packaging and Courrier Service
15. Bookable Rooms              31. Flourist
16. Lounge                      32. Library, Music, and Video Center

                                                                     50
Olympic village: The Legacy
A majority of the Olympic Village units will be turned into affordable housing. The area will follow the HPRP as
closely as possible with some changes made as needed. Parking will be hidden from street view behind building
masses and some first floor units may be converted into tuck-under garages. The Village legacy does still try to stress
walkability and limit the use of vehicles, so parking spaces will be limited to about .5-1.5 spaces per unit. Careful
attention has been made to ensure that there are plenty of “eyes on the street” to help deter crime from happening in
this area.
Commercial spaces will be mixed use and contribute to a walkable neighborhood. By having the commercial area
extend from the top to the bottom of the site, people are drawn in to the area. This helps ensure that the site will con-
tinue to be used after the games and therefore lead to economic revenue.
A traffic circle will be installed for the public to access the site. The traffic circle extends far into the legacy Village
site, allowing for people to see far into the commercial area and hopefully encourage people to visit the area.
51References International Olympic Committee. (n.d.). Retrieved from http://www.olympic.org (n.d.). Retrieved from http://www.olympic.org/rio-2016-summer-olympics Simon Usborne. (n.d.). Retrieved from http://www.independent.co.uk/sport/olympics/after-the-party-what-happens-when- the-olympics-leave-town-901629.html (n.d.). Retrieved from http://www.london2012.com/spectators/venues/ Waitt, G. (n.d.). Retrieved from http://www.sciencedirect.com/science/article/pii/S0160738302000506 Cashman, R. (n.d.). Retrieved from http://ceo.uab.cat/lec/pdf/cashman.pdf Beard, M. . Retrieved from http://www.standard.co.uk/news/london/how-the-6bn-legacy-of-the-olympic-park-is-transform- ing-east-london-8532141.html Borger, J. (n.d.). Retrieved from http://www.guardian.co.uk/world/2007/jun/06/sport.china Oliver, M., O’Mahony, J., & Palmer, D. (n.d.). Retrieved from http://www.telegraph.co.uk/sport/olympics/7908313/London- 2012-Olympics-venue-guide.html (n.d.). Retrieved from http://www.gostanford.com/facilities/stan-stadium.html San Francisco Municipal Transportation Agency, (n.d.). Routes & stops. Retrieved from website: http://www.sfmta.com/get- ting-around/transit/routes-stops Caltrain, (n.d.). Stations. Retrieved from website: http://www.caltrain.com/stations.html Capitol Corridor, (n.d.). Retrieved from website: http://www.capitolcorridor.org 53
San Francisco Travel, (n.d.). San francisco visitor industry statistics. Retrieved from website: http://www.sanfrancisco.travel/
partners/Research-Statistics-2013.html

San Francisco Redevelopment Agency, (n.d.). Hunters point shipyard- candlestick point project summary. Retrieved from
website: http://www.sfredevelopment.org/index.aspx?page=57

What becomes of olympic stadiums?. (2009, Oct 01). Time Sports, Retrieved from http://keepingscore.blogs.time.
com/2009/10/01/what-becomes-of-olympic-stadiums/

Facility information. (n.d.). Retrieved from http://www.coliseum.com/info/facilityinfo.php

Hp pavilion: general information. (2006). Retrieved from http://www.hppavilion.com/building_information/generalinfor-
mation.asp

(n.d.). Retrieved from http://sanfrancisco.giants.mlb.com/sf/ballpark/information/index.jsp?content=history

Memorial stadium [Web log message]. Retrieved from http://www.calbears.com/facilities/memorial-stadium.html

(n.d.). Retrieved from http://www.49ers.com/stadium/

                                                                                                                             54
You can also read


