DOWNTOWN CIRCULATOR STUDY - Existing and Emerging Conditions June 2020 - Downtown Austin Alliance
←
→
Page content transcription
If your browser does not render page correctly, please read the page content below
DOWNTOWN CIRCULATOR STUDY
Existing and Emerging Conditions

                                   June 2020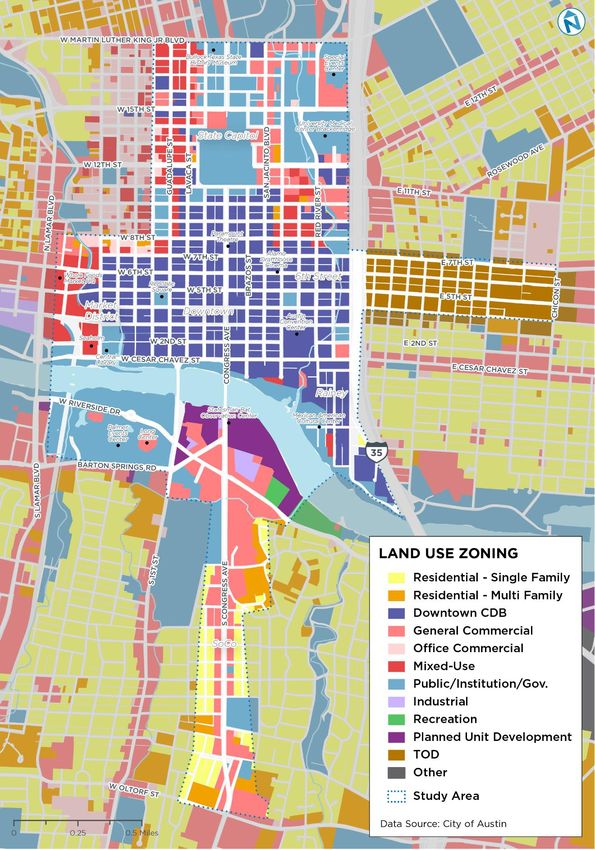
Downtown Circulator Study | Existing and Emerging Conditions

Table of Contents
                                                                                                  Page
1     Introduction ................................................................................ 1-1
      Project Overview .......................................................................... 1-1
      Study Area .................................................................................. 1-2
2     Downtown Today .......................................................................... 2-1
      Urban Form ................................................................................. 2-1
      Land Use .................................................................................... 2-4
      Market Groups .............................................................................. 2-6
      Transportation Options................................................................... 2-15
3     Downtown Tomorrow .................................................................... 3-1
      Pandemic Recovery Planning ............................................................. 3-1
      Adopted and Ongoing Planning .......................................................... 3-1
      Emerging Development ................................................................... 3-6
4     Austin Case Studies ....................................................................... 4-1
      The ‘Dillo.................................................................................... 4-1
      MetroRail Connectors...................................................................... 4-4
5     Peer City Case Studies ................................................................... 5-1
      Literature Review: TCRP Report 87 (2001) ............................................. 5-1
      Case Studies ................................................................................ 5-2

Cover photo by Jeremy Banks

                                       Nelson\Nygaard Consulting Associates Inc. | i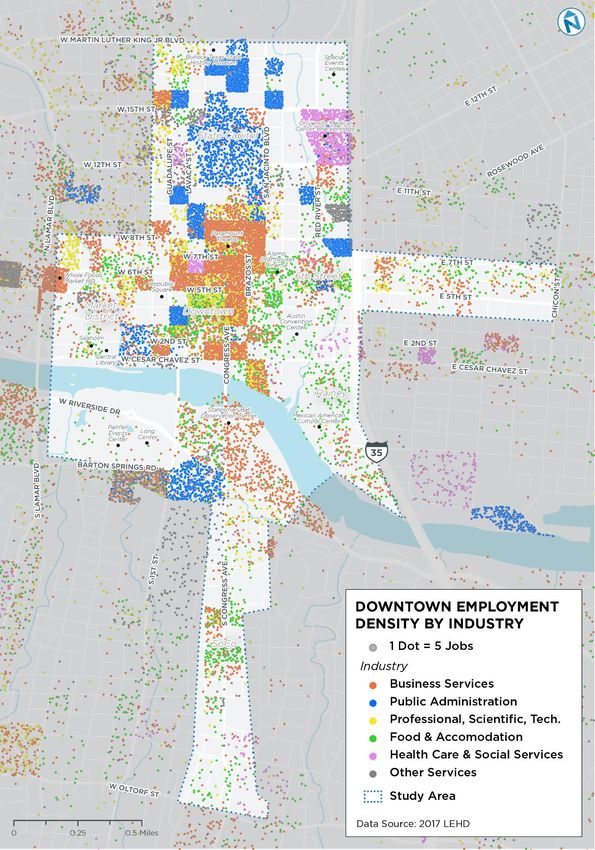
Downtown Circulator Study | Existing and Emerging Conditions

Table of Figures
                                                                                                  Page
Figure   1-1    Project Timeline ................................................................. 1-1
Figure   1-2    Study Area ........................................................................ 1-2
Figure   2-1    Rainey Street District ........................................................... 2-2
Figure   2-2    Study Area Districts .............................................................. 2-3
Figure   2-3    Land Use Zoning .................................................................. 2-5
Figure   2-4    Employment Density ............................................................. 2-7
Figure   2-5    Downtown Total Employment by Industry .................................... 2-8
Figure   2-6    Employment Density by Industry .............................................. 2-9
Figure   2-7    Home Locations of Low Income Downtown Workers ....................... 2-10
Figure   2-8    Low-Income Home Locations .................................................. 2-11
Figure   2-9    Downtown Population Growth ................................................ 2-12
Figure   2-10   Density of Employed Residents ............................................... 2-13
Figure   2-11   Visitor Destinations ............................................................. 2-14
Figure   2-12   Traffic congestion on Congress Avenue during morning peak period .... 2-15
Figure   2-13   Downtown Area Parking ........................................................ 2-16
Figure   2-14   2019 Vehicular Travel Patterns Between Zones ............................ 2-17
Figure   2-15   Project Connect Rendering .................................................... 2-18
Figure   2-16   Current Capital Metro Downtown Transit Network ........................ 2-19
Figure   2-17   Capital Metro Transit Network and Weekday Ridership ................... 2-20
Figure   2-18   Pedestrian Facilities ............................................................ 2-21
Figure   2-19   Bike Facilities.................................................................... 2-22
Figure   2-20   Scooter riders on 3rd Street .................................................... 2-23
Figure   2-21   Micromobility Within and Between Zones ................................... 2-24
Figure   3-1    Project Connect Recommended Metro System Plan ........................ 3-5
Figure   3-2    Emerging Downtown Development ............................................ 3-8
Figure   4-1    Austin Skyline, 1987 ............................................................. 4-1
Figure   4-2    ‘Dillo Replica Trolley Bus ....................................................... 4-1
Figure   4-3    ‘Dillo Route Network, 2008 ..................................................... 4-2
Figure   4-4    ‘Dillo Route Network, 2009 ..................................................... 4-3
Figure   4-5    MetroRail Connector Routes, 2009 ............................................ 4-4
Figure   5-1    DC Circulator Routes ............................................................ 5-3
Figure   5-2    DC Circulator Vehicle on Georgetown Route................................. 5-4
Figure   5-3    CBUS Route ....................................................................... 5-5
Figure   5-4    CBUS Vehicle ..................................................................... 5-6
Figure   5-5    Houston Greenlink Downtown Circulator Routes ............................ 5-7
Figure   5-6    Greenlink Circulator ............................................................. 5-8
Figure   5-7    Portland Streetcar ............................................................... 5-9
Figure   5-8    Portland Streetcar .............................................................. 5-10
Figure   5-9    Denver Circulator Routes ...................................................... 5-11
Figure   5-10   Free Mall Ride Vehicles ........................................................ 5-12

                                    Nelson\Nygaard Consulting Associates Inc. | ii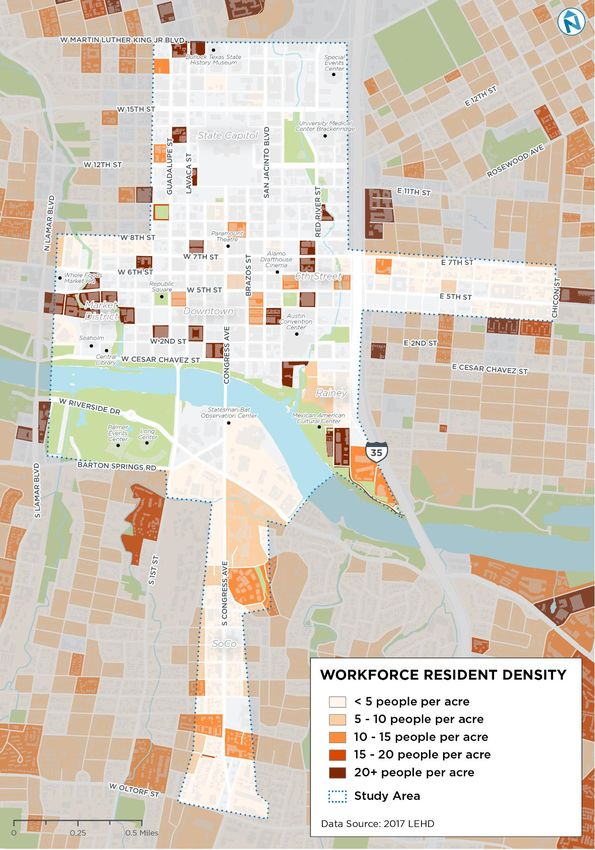
Downtown Circulator Study | Existing and Emerging Conditions

1 INTRODUCTION
PROJECT OVERVIEW
The Downtown Austin Alliance (DAA), in partnership with the City of Austin and Capital Metro, initiated
the Downtown Circulator Study to evaluate the market demand for a downtown transit circulator or
other near-term solutions to address mobility challenges within downtown.
As the first deliverable of the study, this report summarizes existing conditions, highlights planned
growth, and provides cases studies of circulators in other cities to help inform the best path forward
for a potential circulator route(s) in downtown Austin.
This report was authored between March and May 2020 during the start of the COVID-19 outbreak. As
such, components of this report reference conditions that existed prior to the city’s stay-at-home order
and economic slowdown. Nevertheless, it is important to document downtown market, transportation,
and infrastructure conditions prior to the pandemic so that the Downtown Austin Alliance (DAA) and its
stakeholders can forecast and plan for future mobility needs during and post recovery.
Figure 1-1   Project Timeline

                                 Nelson\Nygaard Consulting Associates, Inc. | 1-1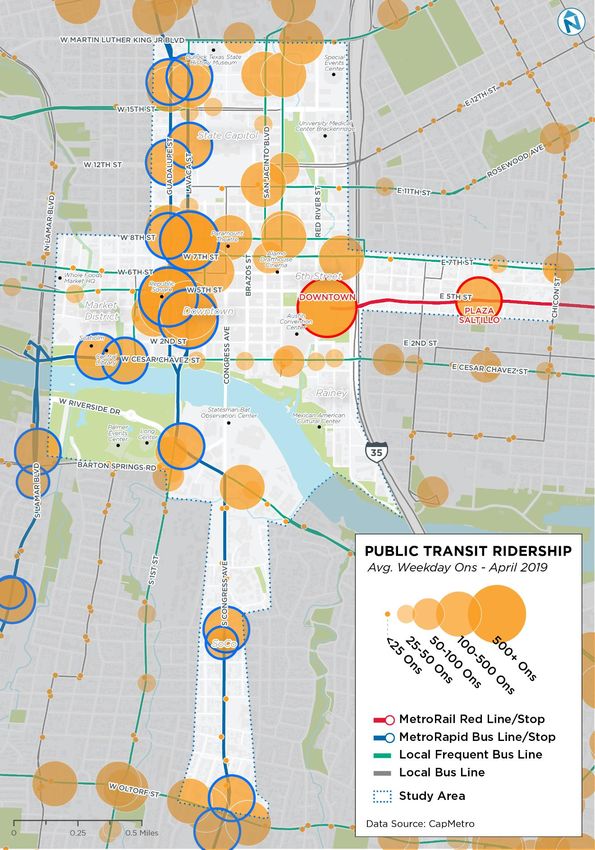
Downtown Circulator Study | Existing and Emerging Conditions

STUDY AREA
The study area extends beyond the boundaries of the Downtown Public Improvement District (PID) to
also include portions of East Austin and South Congress, as well as Auditorium Shores.
Figure 1-2   Study Area

                                Nelson\Nygaard Consulting Associates, Inc. | 1-2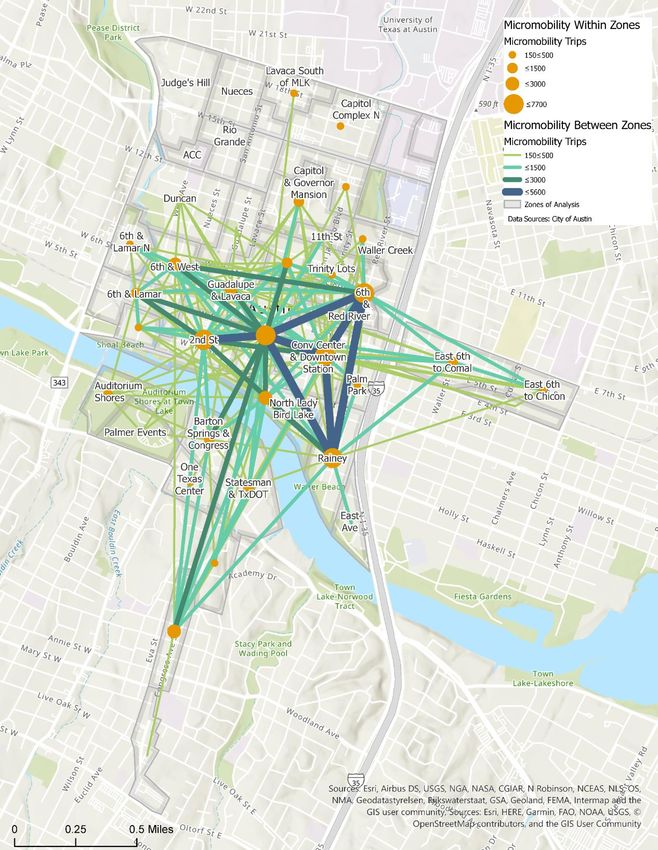
Downtown Circulator Study | Existing and Emerging Conditions

2 DOWNTOWN TODAY
URBAN FORM
Downtown Austin is comprised of several districts that have unique characteristics. Downtown Austin is
typically defined as the area east of I-35, north of Cesar Chavez Street, west of Lamar Boulevard, and
south of 11th Street or Martin Luther King Jr Boulevard. Additional districts included in this study
include Uptown, Capitol, University, Hospital, East End, Rainey, South Central Waterfront, and SoCo.

Martin Luther King, Jr. Boulevard to 11th Street
The northern end of the study area is dominated the Texas State Capitol and several state office
buildings situated between 15th Street and Martin Luther King, Jr. Boulevard. Development east of the
State Capitol Complex includes the Dell Seton Medical Center and University of Texas athletic and
special event spaces, and the redesigned Waterloo Park (currently under construction), each of which
occupy multiple blocks.

11th Street to Lady Bird Lake
Downtown Austin has a traditional grid design with most block lengths ranging from 272’-450’. Shoal
Creek and Waller Creek break up the downtown street pattern near its eastern and western edges.
Several major streets, such as 5th Street, 6th Street, 7th Street, Guadalupe Street, Lavaca Street, San
Jacinto Boulevard, and Trinity Street, are limited to one-way travel. Alleyways divide several blocks
along Congress Avenue, 5th Street, and 6th Street. The Austin Convention Center spans six city blocks in
the southeast corner of downtown.
South of Cesar Chavez Street, the Rainey District consists of long, narrow blocks with limited public
right-of-way. Blocks east of I-35 typically have short lengths, narrow streets, and alleyways.

                                Nelson\Nygaard Consulting Associates, Inc. | 2-1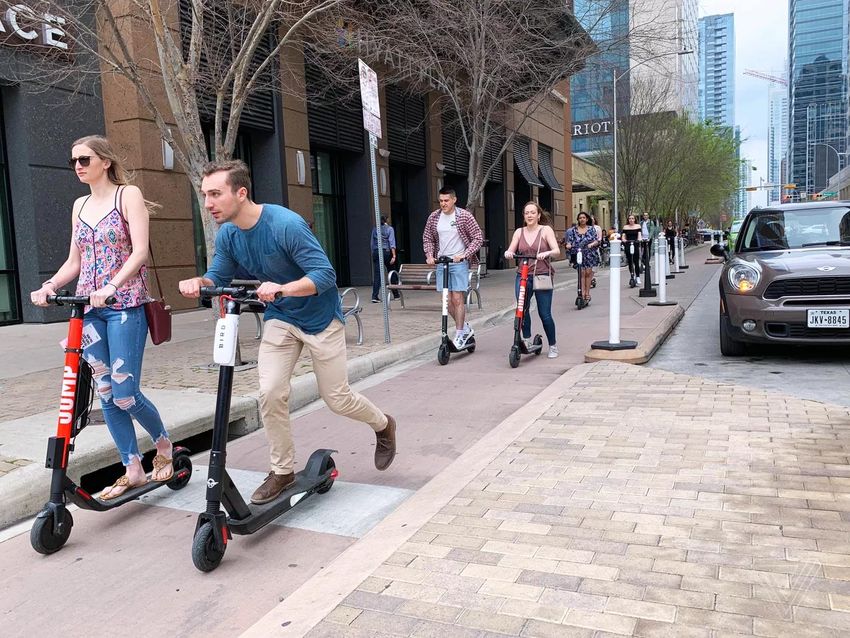
Downtown Circulator Study | Existing and Emerging Conditions

Figure 2-1     Rainey Street District

Source: Austin360

South of Lady Bird Lake
The South Central Waterfront District is comprised of large tracts bounded by Lady Bird Lake to the
north, Bouldin Creek to the south, and South First Street to the west. The Austin American Statesman
complex contains several large surface parking lots and a sprawling office block.
West of the South Central Waterfront District, Auditorium Shores and Butler Park consist of open space,
Palmer Events Center, Long Center, and the Dougherty Arts Center.
The majority of SoCo matches downtown in terms of block length and orientation. Additionally, most
SoCo blocks between Annie Street and Academy Drive are very wide (120’) and have back-in angled
parking. Development on South Congress north of Live Oak Street have height restrictions associated
with the South Congress Capitol View Corridor.

                                        Nelson\Nygaard Consulting Associates, Inc. | 2-2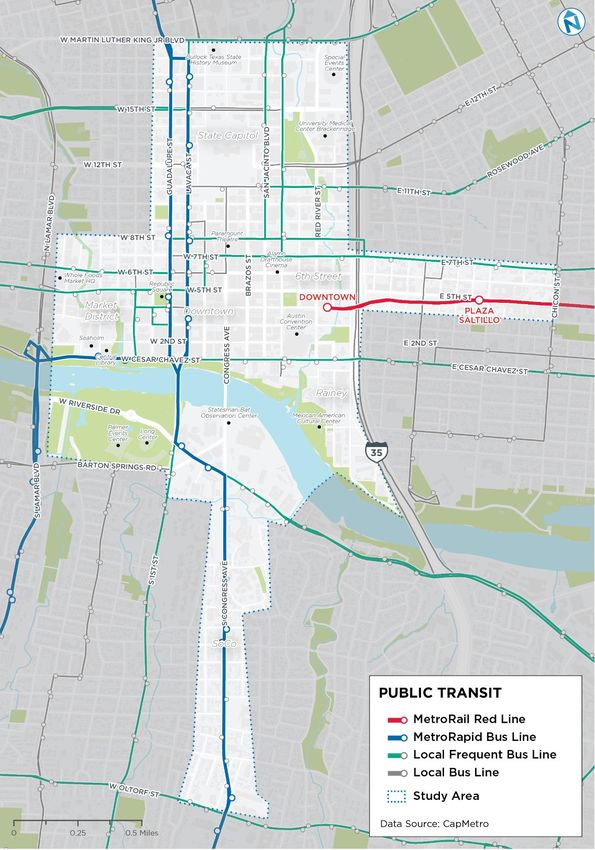
Downtown Circulator Study | Existing and Emerging Conditions

Figure 2-2   Study Area Districts

                                    Nelson\Nygaard Consulting Associates, Inc. | 2-3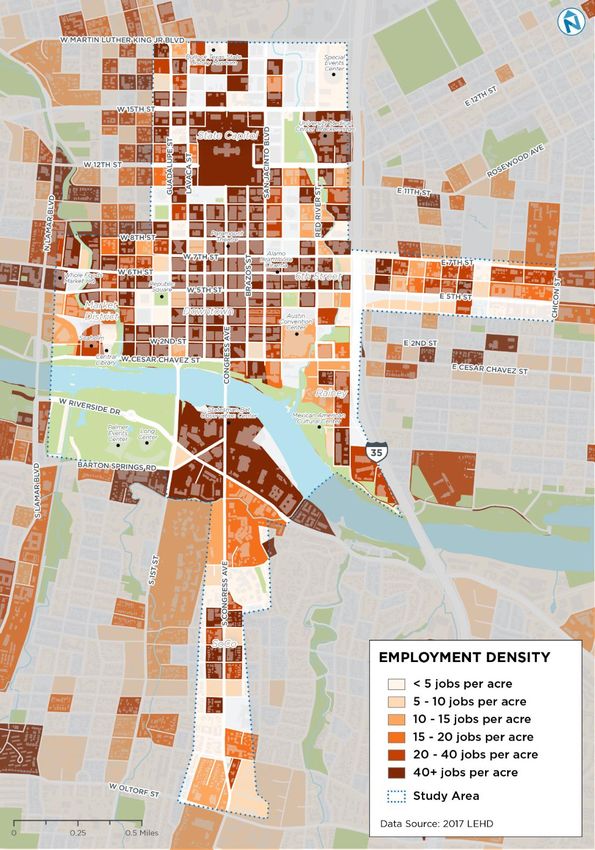
Downtown Circulator Study | Existing and Emerging Conditions

LAND USE
Downtown Austin features a mix of land uses that serves to support a healthy urban ecosystem
conducive to transit and walking. The most prevalent land uses in the study area are Downtown Central
Business District (CBD), Public/Institutional/Governmental, General Commercial, and Transit Oriented
Development (TOD). Land use mix varies significantly south of Lady Bird Lake.

Central Business District
The predominant land use between Cesar Chavez Street and 11 th Street is Downtown Central Business
District. North of 11th Street, land uses are largely public space, institutional, and governmental, with
the exception of mixed-use along Guadalupe Street and Lavaca Street.

State Capital Complex
The State Capitol complex located north of 11th Street and south of Martin Luther King, Jr. Boulevard
between Lavaca Street and San Jacinto Boulevard is predominately zoned as
Public/Institutional/Governmental.

East End/Saltillo
Blocks between I-35, 4th Street, 7th Street, and Chicon Street are designated as Transit-Oriented
Development (TOD). The Plaza Saltillo mixed-use development recently opened and includes big
retailers such as Target and Whole Foods. Plaza Saltillo Station is served by Capital Metro’s Red Line
commuter rail and numerous bus lines is located in the center of the East End District at the
intersection of 4th Street and Comal Street.

South Central Waterfront
Within the South Central Waterfront, land uses include general commercial, public space, and planned
unit development (PUD). A major redevelopment is being planned at the current site of the Austin
American Statesman east of Congress Avenue between Lady Bird Lake and Riverside Drive.

SoCo
The SoCo district is famous for its restaurants, retail, and hotels and features institutional uses,
including the Texas School for the Deaf campus and Lively Middle School. The SoCo district is
surrounded by Travis Heights and Bouldin neighborhoods which are predominantly single-family homes.

                                 Nelson\Nygaard Consulting Associates, Inc. | 2-4
Downtown Circulator Study | Existing and Emerging Conditions
Figure 2-3 Land Use Zoning
Nelson\Nygaard Consulting Associates, Inc. | 2-5Downtown Circulator Study | Existing and Emerging Conditions
MARKET GROUPS
Downtown Austin and its neighboring districts join to create multiple activity centers. This section of
the report examines the distribution, destinations, and travel patterns of Downtown Austin’s three
primary market groups – residents, visitors, and employees.
By analyzing market groups and activity centers, the Downtown Austin Alliance will be able to better
understand demand for future potential circulator routes.
Nelson\Nygaard Consulting Associates, Inc. | 2-6Downtown Circulator Study | Existing and Emerging Conditions
Downtown Employees
The study area is host to over 110,000 employees with the highest densities along Congress Avenue
between Cesar Chavez Street and 11th Street. North of 15th Street, the State Capitol complex also
feature high employment densities. Major employers within the study area include the State of Texas,
City of Austin, Travis County, Dell Seton Medical Center, Whole Foods, Facebook, Google, and Indeed.
South of Lady Bird Lake and east of I-35, the SoCo and East End Districts feature moderate to low
employment densities.
Figure 2-4 Employment Density
Nelson\Nygaard Consulting Associates, Inc. | 2-7Downtown Circulator Study | Existing and Emerging Conditions
Employment by Industry
Downtown Austin hosts a strong mix of employment sectors, led by business services, public
administration, and tech (professional, scientific, and technical) industries.
Business services jobs are largely concentrated along Congress Avenue between Cesar Chavez Street
and 11th Street. Public administration jobs dominate the northern portion of the study area with
multiple state office buildings north of the State Capitol. Additional public administration employment
clusters include City of Austin, Travis County, and Federal office buildings along Guadalupe Street,
Lavaca Street, Red River Street, and Barton Springs Road.
East of the Capitol there is a dense concentration of healthcare jobs at the Dell Seton Medical Center.
The west side of the Capitol features a mix of tech, hospitality, and public administration jobs. Tech
industry employment is largely concentrated in buildings along Congress Avenue, Colorado Street, and
Brazos Street. Tech industry workers tend to live more locally to their place of work and are more
likely to commute using alternative modes such as transit, walking, bicycle, or scooter.
The food and accommodations sector are spread throughout downtown, with the highest
concentrations of food services located north of the Convention Center and near tech jobs. East of
Congress Avenue and south of 8th Avenue, there is a high concentration of hotels to serve the
Convention Center, 6th Street, Red River District, and the Rainey District.
While employment density south of Lady Bird Lake and east of I-35 is more sparse, both areas host a
variety of industries. Both SoCo and the East End districts have a mix of retail and restaurants.
Figure 2-5 Downtown Total Employment by Industry
Data Source: 2017 LEHD
Nelson\Nygaard Consulting Associates, Inc. | 2-8Downtown Circulator Study | Existing and Emerging Conditions
Figure 2-6 Employment Density by Industry
Nelson\Nygaard Consulting Associates, Inc. | 2-9Downtown Circulator Study | Existing and Emerging Conditions
Employee Home Locations
Although downtown employees commute from all over the region, areas with the highest concentration
of downtown employees include Central Austin south of 51st Street, East Austin west of Airport
Boulevard, Southeast Austin north of Oltorf Street, and South Central Austin north of Ben White
Boulevard. Areas farther from the city center with moderate concentrations of downtown workers
include the Crestview/Brentwood and Windsor Park neighborhoods, as well as South Austin between
Ben White Boulevard and William Cannon Drive.
Figure 2-7 Home Locations of Low Income Downtown Workers
Nelson\Nygaard Consulting Associates, Inc. | 2-10Downtown Circulator Study | Existing and Emerging Conditions
Low-Income Employee Home Locations
The highest concentration of low-income downtown workers is in Southeast Austin between Lakeshore
Boulevard and Oltorf Street. Other areas with a high concentration of low-income downtown employees
include West Campus, Hyde Park, North University, Central East Austin, and South Central Austin.
Regionally, most low-income downtown workers who commute from outside of Austin reside cities to
the north and northwest, including Pflugerville, Round Rock, Cedar Park, and Leander.
Figure 2-8 Low-Income Home Locations
Nelson\Nygaard Consulting Associates, Inc. | 2-11Downtown Circulator Study | Existing and Emerging Conditions
Downtown Residents
From 2013 to 2019, according to the US Census, Downtown grew by approximately 3,000 residents, an
increase of nearly 23 percent. US Census American Community Survey (ACS) population estimates
represent data at a large (block group) geographic level, so US Census Longitudinal Employer-
Household Dynamics data was used to analyze the home locations of employees residing in Downtown
Austin. Therefore, downtown residents not employed are not included in the following population
density map.
Figure 2-9 Downtown Population Growth
Source: US Census
Nelson\Nygaard Consulting Associates, Inc. | 2-12Downtown Circulator Study | Existing and Emerging Conditions
Figure 2-10 Density of Employed Residents
Nelson\Nygaard Consulting Associates, Inc. | 2-13Downtown Circulator Study | Existing and Emerging Conditions
Downtown Visitors
As one of the country’s top travel destinations, downtown Austin’s bustling tourism and hospitality
industry reached an all-time high in 2019. Events such as South by Southwest (SXSW) and Austin City
Limits draw several hundred thousand visitors every year. The Convention Center is also a large draw
for visitors throughout the year. Notably, the largest concentration of hotels is within a few blocks of
the Convention Center. Downtown Austin is also a major destination for local visitors with established
nightlife districts, including Sixth Street, Red River, Warehouse, Rainey, East End, SoCo.
Figure 2-11 Visitor Destinations
Nelson\Nygaard Consulting Associates, Inc. | 2-14Downtown Circulator Study | Existing and Emerging Conditions
TRANSPORTATION OPTIONS
Downtown Austin’s mode split- or percentage of travelers using a particular type of transportation or
number of trips by type- is not precisely known. Most mode split data focuses on commute to work
patterns to spotlight on the vast majority of trip patterns. Some cities use the U.S. Census American
Commuter Survey (ACS) data as an approximation for mode split. In the case of Austin, ACS data
indicates that roughly ¾ of the city commutes by car. However, a recent survey by Movablity Austin
suggests that fewer downtown workers commute by car than ACS data may indicate.
The Austin Transportation Department is currently embarking on the Austin Core Transportation (ACT)
plan (described in Chapter 3) which seeks to gather precise data on downtown’s mode split. In the
interim, this section highlights general trends by mode.
Drive-Alone
While downtown Austin has a significantly lower drive alone mode share than most other areas of the
City, private automobiles remain the primary mode of transportation among downtown employees and
visitors. ACS data points to roughly 75% drive-alone rates city-wide. Auto traffic within downtown peaks
during morning and afternoon commute periods with congestion along several corridors, particularly
those providing ingress or egress to or from the Central Business District.
Figure 2-12 Traffic congestion on Congress Avenue during morning peak period
Source: Austin Culture Map
Nelson\Nygaard Consulting Associates, Inc. | 2-15Downtown Circulator Study | Existing and Emerging Conditions
Parking
One of the key drivers behind the high-drive alone rate is the large supply of parking downtown,
compared to other cities with higher multimodal mode use. The Downtown Parking Study Parking
inventoried parking within downtown in September 2016, estimating over 65,000 off-street spaces in
garages and lots and 6,400 on-street spaces. Downtown parking was classified as public, restricted, or
varied. All public on-street parking within downtown and the East End districts is metered. Parking
within the Capitol Complex is enforced by the State of Texas.
Figure 2-13 Downtown Area Parking
Nelson\Nygaard Consulting Associates, Inc. | 2-16Downtown Circulator Study | Existing and Emerging Conditions
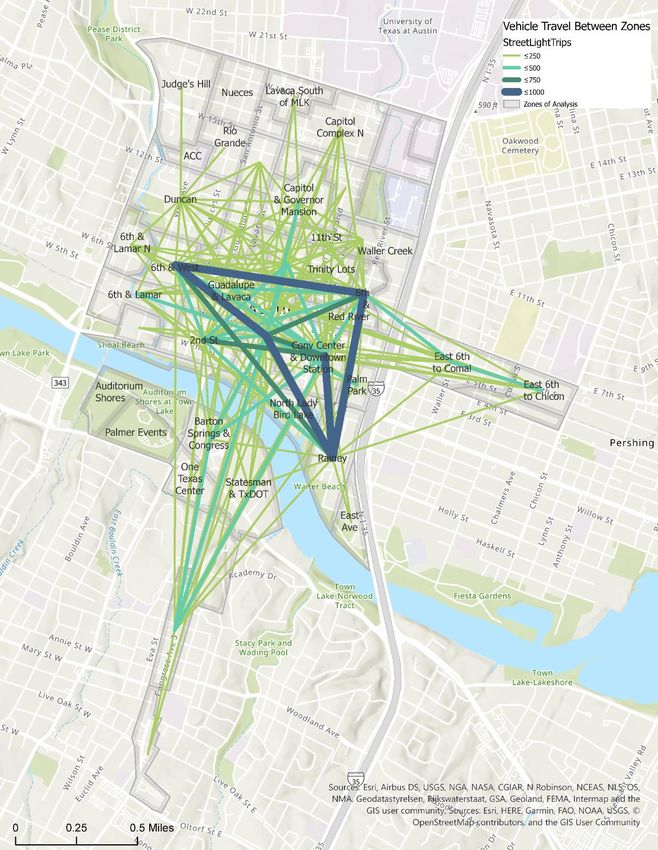
2019 Vehicular Travel Patterns within Downtown Zones
To understand travel patterns before, during, and after the COVID-19 outbreak and associated stay-at-
home order, the Downtown Austin Alliance obtained anonymized data from a traffic analytics company
that processes mobile data collected from mobile devices. Data obtained for this study only includes
trips taken by automobiles, not walking, biking, transit or other modes.
Figure 2-14 2019 Vehicular Travel Patterns Between Zones
Nelson\Nygaard Consulting Associates, Inc. | 2-17Downtown Circulator Study | Existing and Emerging Conditions
Transit
Downtown Austin is served by a combination of local (MetroBus), rapid bus (MetroRapid), express bus
(MetroExpress), and commuter rail (MetroRail).
Most downtown ridership can be attributed to the bus network. As the primary transit corridors in
downtown, Guadalupe Street and Lavaca Street have several high ridership stops due to passengers
transferring between routes or traveling to/from downtown. Secondary transit corridors downtown
include San Jacinto Boulevard, Trinity Street, Cesar Chavez Street, 7th Street, and 8th Street.
MetroRail provides connectivity from Leander (approximately 30 miles northwest of downtown) to the
eastern edge of downtown Austin. MetroRail runs daily, with more frequent service during the weekday
morning and afternoon peak periods. Capital Metro is currently in the process of constructing a
permanent Downtown Station that will replace the current temporary station and include connections
to local bus (Route 17 on Cesar Chavez and Route 4 on 7th Street), electric cab, carshare, B-cycle
bikeshare, dockless scooters and bikes, and the Lance Armstrong Bikeway. Construction on the new
station started in March 2019 and is anticipated to last into Spring 2021.
Capital Metro experienced a 11.5% increase in system ridership after launching its redesigned bus
network in June 2018 with an 8% increase the year after. The COVID-19 pandemic resulted in a 60%
decline in bus ridership and a 85% decline in rail ridership in April 2020 as compared to April 2019.
Capital Metro is currently planning for future regional needs and currently finalizing Project Connect, a
high-capacity transit plan that would bring light rail to downtown by 2030. The Project Connect plan
envisions reducing travel time by dedicating transitways with high-frequency service.
Figure 2-15 Project Connect Rendering
Source: Project Connect
Nelson\Nygaard Consulting Associates, Inc. | 2-18Downtown Circulator Study | Existing and Emerging Conditions
Figure 2-16 Current Capital Metro Downtown Transit Network
Nelson\Nygaard Consulting Associates, Inc. | 2-19Downtown Circulator Study | Existing and Emerging Conditions
Figure 2-17 Capital Metro Transit Network and Weekday Ridership
Nelson\Nygaard Consulting Associates, Inc. | 2-20Downtown Circulator Study | Existing and Emerging Conditions
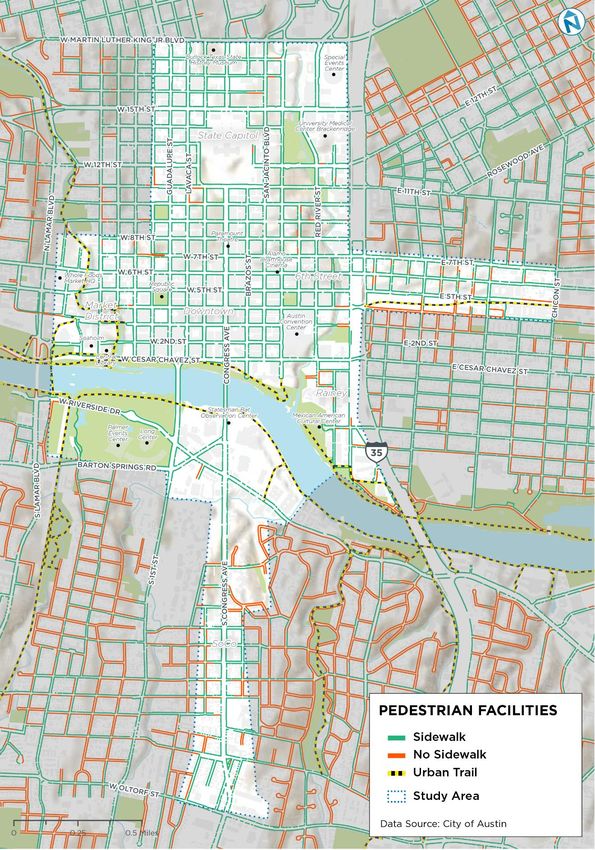
Walking
Downtown has a lively pedestrian street scene. The study area has a nearly complete sidewalk network
with few gaps. Downtown is further connected by urban trails such as the Butler Hike and Bike Trail
which runs along both sides of Lady Bird Lake and the Shoal Creek Trail which extend from Lady Bird
Lake through downtown.
Figure 2-18 Pedestrian Facilities
Nelson\Nygaard Consulting Associates, Inc. | 2-21Downtown Circulator Study | Existing and Emerging Conditions
Topography
Elevations within the study area increase gradually from Lady Bird Lake north to the State Capitol and
south to Oltorf Street. Major topographical boundaries are at 7 th Street Downtown heading north, and
Riverside Drive heading south, where there are notable elevation changes. Generally, the whole of the
study area is walkable, despite spotted sidewalk gaps and hills.
Average Monthly Temperatures
Temperatures in Austin can be prohibitive of walking as a long-distance transportation option in the
Summer months. As the midday temperature is typically above 90 degrees Fahrenheit with high
humidity from late May through late September.
Biking
Biking downtown is inviting to some and deemed dangerous to others. Cyclists report the safest feature
of downtown’s bike network is the Lance Armstrong Bikeway, a crosstown cycle track that runs from
Shoal Creek Trail through downtown to East Austin. The Butler Hike and Bike Trails along both sides of
Lady Bird Lake provide continuous east-west connectivity but are mostly used for recreational
purposes. North-south bike travel in downtown is more challenging than east-west travel due to
topography and need for cyclists to mix with auto traffic.
Figure 2-19 Bike Facilities
Nelson\Nygaard Consulting Associates, Inc. | 2-22Downtown Circulator Study | Existing and Emerging Conditions
Micromobility
Over the past half-decade, shared mobility
options have rapidly expanded in Downtown Micromobility trip pairs can help serve
Austin. In 2013, the city rolled out Austin BCycle, as an indicator for desired short-trip
a docked bike share program. In more recent
patterns within the study area.
years, dockless scooter has emerged as the most
popular option, constituting 95% of all
micromobility trips.
Trips within downtown (primarily south of 11th Street) make up a high percentage of micromobility trips
in the study area. A very limited number of micromobility trips are are to/from the northwest and
northeast corners of the study area. The vast majority of trips occur within CBD (origin and destination
are within the CBD). The epicenter of dockless trips is in the area between Shoal Creek, 7th Street, I-
35, and Cesar Chavez Street. The average trip time for micromobility is 10 minutes.
The following is a list of major trip pairs:
▪ SoCo and CBD
▪ CBD and Rainey Neighborhood
▪ Rainey Neighborhood and Red River District
▪ 6th Street and Rainey Neighborhood
▪ West CBD and 6th Street
▪ Republic Square and CBD
Figure 2-20 Scooter riders on 3rd Street
Source: The Verge
Nelson\Nygaard Consulting Associates, Inc. | 2-23Downtown Circulator Study | Existing and Emerging Conditions
Figure 2-21 Micromobility Within and Between Zones
Nelson\Nygaard Consulting Associates, Inc. | 2-24Downtown Circulator Study | Existing and Emerging Conditions
3 DOWNTOWN TOMORROW
PANDEMIC RECOVERY PLANNING
This report was produced during the COVID-19 pandemic and more specifically, in the midst of Austin’s
stay-at home/shelter in place order. As more and more businesses begin to open in June 2020, the
question remains: what will downtown Austin look like in a post-pandemic world?
To shed light on what mobility needs will be most pressing, this study includes an analysis of travel
patterns before, during, and after the stay at home order. Also, by working with stakeholders to
understand changes to downtown activity and future needs, the project team will seek to understand
how a circulator can potentially be a catalyst for recovery.
Though Austin will be changed by COVID-19, some of the groundwork of previous planning efforts sheds
light on key planning goals and provides momentum for upcoming projects.
ADOPTED AND ONGOING PLANNING
Downtown Austin Plan
Adopted in 2012, the Downtown Austin Plan (DAP) charts a comprehensive course for Downtown’s
growth over several decades. The plan acknowledges the varied contexts that exist within the
downtown boundary and provides direction on future land use, density, transportation framework, and
public space that are grounded in the character of each district identified in the plan. Several
elements of the DAP have been codified in development regulations and that affect travel patterns
within the Downtown area, including:
▪ Recommendations for re-zoning within downtown to increase density, particularly in targeted
locations within Northwest Downtown
▪ Establishment of a transportation framework plan that identifies modal priorities on major
streets, incorporating recommendations from the Great Streets Master Plan
▪ Establishment of a downtown density program that includes an urban design review process for
development to ensure compliance with DAP goals
The data used to analyze trends for development within downtown are nearing ten years old, and in
many cases recent trends in new construction, particularly office and hotel uses, have far outpaced the
rate of growth anticipated in the original ten-year scenario.
Nelson\Nygaard Consulting Associates, Inc. | 3-1Downtown Circulator Study | Existing and Emerging Conditions
Downtown Austin Parking Strategy
The Downtown Austin Parking Strategy represents Austin’s first attempt at quantifying both the supply
of and demand for parking within the downtown area. The Strategy relied on a rigorous data collection
effort to capture parking utilization for on-street and off-street parking, finding that the primary
problem with parking availability downtown lies in its lack of accessibility rather than a lack of supply.
The Strategy makes several recommendations for improving the accessibility and management of
downtown parking, several of which have been enacted by responsible agencies, including:
▪ Adjusting parking meter prices to encourage on-street availability
▪ Expanding existing Affordable Parking Program
▪ Coordinating Mobility Services for employees
▪ Introducing Transportation Demand Management strategies for new developments
One of the recommendations from the Strategy is to evaluate a circulator shuttle and park-and-ride
system for downtown. The most under-utilized on- and off-street parking supply exists at the fringes of
downtown, and utilization could be improved if a last-mile connection tailored to downtown employees
existed.
Austin Strategic Mobility Plan (ASMP)
The Austin Strategic Mobility Plan – adopted in 2019 - represents the City of Austin’s first
comprehensive review of citywide transportation policy since the 1990s. The plan is driven by a
citywide goal to achieve a 50% non-single occupant vehicle (SOV) commute mode split by 2039 (the
horizon year for the Imagine Austin Comprehensive Plan), which would accommodate Austin’s
anticipated 20-year growth while maintaining current levels of traffic congestion. Citywide, Austin’s
mode split today is about 74% SOV and 25% for all other modes of travel, but downtown Austin sees a
much higher share of non-SOV commuters than the city at large.
The ASMP updated the street network table to reflect best practices in multi-modal street design while
establishing priority networks for automobiles, transit, bicycles, and pedestrians based on a
comprehensive consolidation of existing mode-specific planning efforts. One of the signature
recommendations of the ASMP is the establishment of a Transit Priority Network, which includes the
Capital Metro Project Connect Vision Plan (as adopted by the Capital Metro Board of Directors in Dec.
2018) and other high-frequency routes operated by the transit agency. The most aggressive increase in
citywide mode-share is anticipated for transit (from a current share of 4% to a 16% goal by 2039), and
investment in high-capacity transit operating in dedicated transitways is a critical element of
increasing the usefulness and attractiveness of transit as a way to get to work. As downtown continues
to add jobs and housing density, the ability for transit to maximize efficient access to downtown will
only grow.
The ASMP also outlines a host of policy recommendations that support the overall mode-split target,
including reducing traffic fatalities, increasing the use of Transportation Demand Management
principles, right-sizing and managing parking supply, and developing shared mobility options by
leveraging data and emerging technology.
Nelson\Nygaard Consulting Associates, Inc. | 3-2Downtown Circulator Study | Existing and Emerging Conditions
Austin Core Transportation Plan
While the ASMP applied to the entire City of Austin transportation network, there was an
acknowledgement through the planning process that the downtown street grid and transportation
landscape justified a more detailed process for incorporating the goals of the ASMP into the downtown
context. The City of Austin embarked on the Austin Core Transportation Plan shortly after adoption of
the ASMP and is currently wrapping up the existing conditions analysis and initial outreach phase.
The ACT Plan acknowledges the amount of change that has occurred downtown since the last effort at
establishing a mobility framework for the area – not only with an increase in private development, but
through adoption of and advancement of other planning efforts such as the ASMP, the Parking Strategy,
and Project Connect. The ACT Plan also acknowledges the outsized role that downtown will play in
achieving the ASMP’s citywide 50% non-SOV mode split given its role as the largest employment center
(by far) in the region. It will provide a framework for incorporating transformational regional projects –
such as Project Connect and the rebuilding of I-35 through downtown – into the overall downtown
mobility landscape.
Nelson\Nygaard Consulting Associates, Inc. | 3-3Downtown Circulator Study | Existing and Emerging Conditions
Project Connect
Project Connect is the ongoing long-range planning effort led by Capital Metro to improve the regional
system of high-capacity transit through 2045. The Long Range Vision Plan – adopted by the Capital
Metro Board of Directors in 2018 – envisions a series of improvements to many modes of transit, many
of which serve downtown, including commuter express bus routes and regional park & ride facilities,
commuter rail enhancements, addition of MetroRapid routes similar to today’s 801 and 803, and
construction of dedicated transitways along the Orange, Gold, and Blue Line corridors (see
Recommended System Plan, next page).
Proposed Orange, Gold, and Blue Line corridors would provide transit service in dedicated transitways
that serve downtown Austin and connect to major regional destinations including the University of
Texas and Austin-Bergstrom International Airport. Since adoption of the Vision Plan in 2018, Capital
Metro has been conducting a more detailed Alternatives Analysis process, which will result in a
recommendation for a Locally Preferred Alternative (LPA) later in 2020 that defines the mode,
alignment, and type of transitway (street level, above ground, or below ground) recommended for
each corridors, including within the downtown area.
I-35 Cap & Stitch
As TxDOT considers dedicating funding for a full re-build of I-35 through Central Austin, the Downtown
Austin Alliance has engaged with the Urban Land Institute (ULI) and a diverse group of community
partners to develop a holistic vision for how the I-35 project can enhance downtown. The key goal
driving the planning effort is to leverage the lowered freeway and redesigned crossings to “stitch”
together parts of Downtown and East Austin that have long been disconnected by the current freeway’s
design, and doing so in a way that enhances multimodal connectivity while providing opportunities for
affordable housing. Additionally, opportunities for providing public space on top of the lowered
freeway have been front and center in many community conversations since TxDOT began design work
for I-35.
The ULI advisory panel visited Austin in February 2020 to meet with community leaders, visit the site,
and develop preliminary recommendations for the corridor. A full picture of the community’s vision for
I-35 will be developed based on these recommendations and released later this year.
Nelson\Nygaard Consulting Associates, Inc. | 3-4Downtown Circulator Study | Existing and Emerging Conditions
Figure 3-1 Project Connect Recommended Metro System Plan
Source: Capital Metro
Nelson\Nygaard Consulting Associates, Inc. | 3-5Downtown Circulator Study | Existing and Emerging Conditions
EMERGING DEVELOPMENT
Much of the new development that is currently under construction or planned for downtown is
concentrated in a few key districts within the overall downtown core:
Republic Square
Some of Downtown’s largest ongoing or planned developments are within a few blocks of the recently
revamped Republic Square park, including 6X Guadalupe – which will be Austin’s tallest building when
complete in 2021. Other prominent development proposals include The Republic, BBVA Tower, and
Hanover Republic Square. Additionally, the State of Texas has recently authorized the sale of the
Hobby State Office Building at 3rd and Guadalupe, which could result in a significant public/private
partnership development opportunity.
Convention Center
The City Council provided preliminary guidance for a massive expansion and renovation of the Austin
Convention Center in 2019, directing city staff to pursue a redevelopment plan that includes
opportunities for private development and better urban design to re-stitch the street grid in the
southeast quadrant of downtown. Capital Metro is also reconstructing the Downtown MetroRail station
to better accommodate demand, which could further influence the development trajectory in this part
of downtown.
Rainey Street
While initiation development in the Rainey Street district was modest after adoption of CBD zoning in
2005, recent development proposals have involved increasing density and intensity as land available for
redevelopment in the district diminishes. Within the last two years, proposals for several high-rise
towers have been received and, in many cases, approved for the district.
Dell Seton Medical School
While redevelopment near the Dell Seton Medical School has also been slower to take off then initially
anticipated, recent announcements have put a renewed spotlight on this quadrant of downtown. In
addition to the school and hospital, new medical-adjacent office space is on the way on the site of the
former Brackenridge Hospital site, adjacent to the almost-complete redesign of Waterloo Park. New
residential development has started to blossom in this area, with two large multifamily developments
under construction at I-35 and 12th Street.
South Central Waterfront District
South of the river, the Austin-American Statesman campus is planned to be transformed into a mixed-
use waterfront development and will likely feature a comparable density of jobs while also adding
substantial population density as well as visitor attractions. Additional redevelopment is in progress or
being planned between Lady Bird Lake, Congress Avenue, Riverside Drive, and South 1st Street.
Nelson\Nygaard Consulting Associates, Inc. | 3-6Downtown Circulator Study | Existing and Emerging Conditions
Capitol Complex Master Plan
Many of the cranes present in downtown today are constructing one of the largest public works
projects that the State of Texas has undertaken. Several new State office buildings will be replacing
parking lots just north of the State Capitol and allowing departments with employees scattered in
leased space around the metro area to be in one central location. The legislature has funded the two
first phases and additional phases of development could be authorized in future legislative sessions.
Source: Texas Facilities Commission
The 84th Texas Legislature has funded Phase 1 of the master plan, which includes:
▪ A 14-story, 603,000-square-foot office building at 1801 Congress Ave., the site of a former
surface parking lot, to be named after George H. W. Bush.
▪ A 12-story, 420,00-square-foot office building at 1601 Congress Ave.
▪ 3,800 parking spaces between underground and above-ground garages.
▪ A pedestrian mall along Congress Avenue from Martin Luther King Jr. Boulevard to 16th Street.
Nelson\Nygaard Consulting Associates, Inc. | 3-7Downtown Circulator Study | Existing and Emerging Conditions
Figure 3-2 Emerging Downtown Development
Nelson\Nygaard Consulting Associates, Inc. | 3-8Downtown Circulator Study | Existing and Emerging Conditions
4 AUSTIN CASE STUDIES
THE ‘DILLO
Between 1984 and 1987, Austin experienced its first downtown construction boom in over 70 years. The
addition of several prominent office towers increased doubled downtown employment and created its
first parking pinch.
Figure 4-1 Austin Skyline, 1987
Source: Austin History Center
In response to the sudden growth, Capital Metro introduced Austin’s first downtown shuttle, the
Armadillo Express, or more affectionately known as the ‘Dillo, in 1984. The free shuttle service
consisted of replica trolley buses that traversed downtown and served over a thousand employees,
students, jurors, and visitors daily.
Figure 4-2 ‘Dillo Replica Trolley Bus
Source: LoneStarMike
Nelson\Nygaard Consulting Associates, Inc. | 4-1Downtown Circulator Study | Existing and Emerging Conditions
Over the next two decades, the ‘Dillo expanded to a network of five routes that provided connectivity
throughout downtown and beyond. ‘Dillo routes varied in terms of alignment, hours and frequency of
service, target market(s), and ridership.
The Red and Yellow ‘Dillo routes primarily functioned as shuttles from free park-and-rides southwest of
downtown to Congress Avenue, the State Capitol, Travis County Courthouse, Austin Community College
Rio Grande Campus, and the University of Texas. The Red ‘Dillo served the parking lot west of Austin
High School and the Yellow ‘Dillo served the parking lot south of Butler Shores Park. The Orange ‘Dillo
mostly ran along Congress Avenue, connecting downtown with the University of Texas and SoCo. The
Blue ‘Dillo featured a clockwise loop alignment, primarily along Lavaca Street, Martin Luther King, Jr.
Boulevard, San Jacinto Boulevard, and 4th Street. The Silver ‘Dillo operated in a fairly direct alignment
along 5th and 6th Streets between Deep Eddy Pool and Capital Metro’s headquarters along Pleasant
Valley Road in East Austin.
Figure 4-3 ‘Dillo Route Network, 2008
Source: Capital Metro
Nelson\Nygaard Consulting Associates, Inc. | 4-2Downtown Circulator Study | Existing and Emerging Conditions
In 2009, Capital Metro redesigned its ‘Dillo route network in an effort to increase ridership. The new
‘Dillo route network consisted of two routes that provided simpler and more frequent service. Austin
Community College Rio Grande Campus, University of Texas, East Austin, and free park-and-rides
southwest of downtown were not included in the new ‘Dillo route network. Capital Metro also
implemented a $1 base fare in conjunction with the service redesign.
Figure 4-4 ‘Dillo Route Network, 2009
Source: Capital Metro
The truncated ‘Dillo route network, 2008/2009 economic crisis, and updated fare policy caused
ridership to plummet. Capital Metro discontinued the ‘Dillo routes in October 2009 as part of a
systemwide reduction of inefficient service prompted by decreased sales tax funding due to the Great
Recession.
Nelson\Nygaard Consulting Associates, Inc. | 4-3Downtown Circulator Study | Existing and Emerging Conditions
METRORAIL CONNECTORS
In February 2009, Capital Metro implemented a set of new routes that provided connections between
MetroRail stations and nearby employment centers. Five routes awaited morning passengers
disembarking at MLK Station and Downtown MetroRail stations, and transported them to the University
of Texas, State Capitol, Guadalupe Street, Congress Avenue, and Riverside Drive. In the afternoon,
each route returned passengers to the same MetroRail stations.
All three Downtown Station MetroRail Connector routes and the MLK Station-State Capitol route were
eliminated in 2010. The MLK Station-University of Texas MetroRail Connector route remains in service.
Figure 4-5 MetroRail Connector Routes, 2009
Source: Capital Metro
Nelson\Nygaard Consulting Associates, Inc. | 4-4Downtown Circulator Study | Existing and Emerging Conditions
5 PEER CITY CASE STUDIES
LITERATURE REVIEW: TCRP REPORT 87 (2001)
The Transportation Research Cooperative Program’s Report 87 (published in 2011) aimed to gather a
greater insight into the state of downtown circulator systems across North America, since literature
covering downtown circulators is scarce. To this effect, a survey was conducted to obtain a snapshot of
downtown circulators. In total, the survey had 78 respondents. The survey also includes input from
agencies that discontinued or have not implemented a circulator service, in order to gain a greater
insight into their reasoning. There a several key takeaways that from the report that are summarized
below:
▪ Funding is key: a reliable source is best.
▪ Partnership and branding are imperative
▪ Simple, frequent routes and free service are most enticing to riders.
▪ Employees and visitors are the most common markets.
▪ Defining target markets is important.
▪ Coordinate with existing transit rather than duplicate service.
▪ Service flexibility is key, particularly adapting to traffic flow and patterns.
▪ Understanding the needs of hotels, visitors bureaus, large employers, and convention centers
will help in effective planning and implementation.
▪ Regular reviews are important to note changes that could affect the service.
▪ Understanding attitudes toward walking and typical walking distances is important.
Nelson\Nygaard Consulting Associates, Inc. | 5-1Downtown Circulator Study | Existing and Emerging Conditions
CASE STUDIES
The following circulators were reviewed to gain a better understanding of the design characteristics,
service profiles, ridership performance, funding, and management. The five circulators operate in
environments similar to downtown Austin and will be helpful in formulating recommendations in the
future phases of this study.
DC Circulator, Washington, D.C.
CBUS Downtown Circulator, Columbus, OH
GreenLink Downtown Circulator, Houston, TX
Portland Streetcar, Portland, OR
MetroRide and MallRide, Denver, CO
Sources: DC Circualtor, COTA, Houston Metro, Portland Streetcar, RTD
Nelson\Nygaard Consulting Associates, Inc. | 5-2Downtown Circulator Study | Existing and Emerging Conditions
DC Circulator, Washington, D.C.
The DC Circulator is made up of six different routes
serving Washington, DC area, with one of the 6 routes The DC Circulator connects visitors
servicing Rosslyn Metro Station across the Potomac and employees with multiple
River in Virginia. The circulator system offers visitors activity centers, providing a
convenient and affordable access to major tourist simple, frequent, and fast service.
attractions and also serves as a reliable mobility option
for residents and workers in the downtown area.
The DC Circulator has a characteristic brand, consisting of easily identifiable vehicles and easy-to-
understand routes. Offering rides for $1.00, routes consistently run every 10 minutes, seven-days a
week. On game days, the DC Circulator offers extended service for local sports teams. Passengers pay
fares using a variety of methods including DC Circulator passes, cash, WAMTA bus passes, and SmartTrip
Cards.
DC Circulator service began in 2005 and was developed by the Downtown Business Improvement District
(BID), the DC Department of Transportation (DDOT), and the National Capital Planning Commission
(NCPC) in collaboration with Washington Metropolitan Area Transit Authority (WMATA and/or Metro).
The DC Circulator has grown from the two original routes to six. In 2015, a route began service to the
National Mall, and subsequently, in 2018, changes were implemented to extend access to growing
centers of activity. Later, in 2019, the DC Circulator began a fare-free service. This was piloted for
nearly 9-months and despite support from Mayor Bowser for making fare-free service permanent, the
D.C. Council opposed, and fares were reintroduced.
Figure 5-1 DC Circulator Routes
Source: DC CIrculator
Nelson\Nygaard Consulting Associates, Inc. | 5-3Downtown Circulator Study | Existing and Emerging Conditions
DC Circulator Characteristics
Number of Routes 6
Fare $1.00
Operating Dupont Circle-Georgetown-Rosslyn, Georgetown-Union Station, and Woodley Park-Adams
Hours/Frequency Morgan-McPherson Square Metro
▪ Monday – Thursday: 6am-Midnight
▪ Friday: 6am-3am
▪ Saturday: 7am-3am
▪ Sunday: 7am-Midnight
Eastern Market – L’Enfant Plaza and Congress Heights – Union Station
▪ Weekdays: 6am-9pm
▪ Weekends: 7am-9pm
National Mall Route
▪ Winter (October – March) Weekdays: 7am–7pm
▪ Winter Saturday – Sunday: 9am–7pm
▪ Summer (April – September) Weekdays: 7am–8pm
▪ Summer Saturday – Sunday: 9am–8pm
Frequency (all routes) Every 10 minutes
Annual Ridership 4,645,318 (FY 2018)
Operating Costs 36,258,728 (FY 2018)
Operating Agency District of Columbia Department of Transportation (DC DOT)
Washington Metropolitan Area Transit Authority (WMATA)
Vehicle Type Bus
Figure 5-2 DC Circulator Vehicle on Georgetown Route
Source: DC CIrculator
Nelson\Nygaard Consulting Associates, Inc. | 5-4Downtown Circulator Study | Existing and Emerging Conditions
CBUS Downtown Circulator, Columbus, OH
Central Ohio Transit Authority’s (COTA) CBUS is a
circulator in Columbus, Ohio that provides access to CBUS is a fare-free circulator in
major attractions within Downtown between the city’s downtown Columbus that links City
Brewery and Short North districts. The CBUS is a fare- Center, the State House, and
free service, operating daily with vehicles coming Convention Center with popular
every 10 to 15-minutes the primary alignment runs districts at the edge of downtown.
bidirectional on High St for approximately 25 blocks
and loops at the ends around the Brewery District and north of Italian Village. During the National
Hockey League (NHL) season, when the Blue Jackets play weekday home games, the CBUS extends
operations until midnight. The CBUS is effective in transporting visitors, residents, and employees
throughout Downtown.
CBUS started service in 2014 as the result of a partnership between the Central Ohio Transit Authority
and downtown developers and employers. The circulator is largely funded by local organizations and
businesses, allowing CBUS to remain fare free. Throughout the life of the CBUS the City has engaged
business owners and local organizations who have provided input and support for the service. Marketing
has been crucial for the circulator: a survey conducted by COTA in 2016 revealed that half of riders
attribute knowledge of the service to the marketing efforts by COTA promoting CBUS–including
promotional advertisements and signage.
CBUS features several amenities that serve to draw and maintain ridership like free wi-fi. To serve
downtown tourists and visitors, all CBUS operators are also certified tourist ambassadors. CBUS directly
aided the increase in transit ridership in Columbus. CBUS has daily ridership averaging 2,000 to 3,000
and amounts a weekly ridership of 11,000 to 14,000. More than 80% of weekday users ride the CBUS for
work-related purposes.
Figure 5-3 CBUS Route
Nelson\Nygaard Consulting Associates, Inc. | 5-5Downtown Circulator Study | Existing and Emerging Conditions
CBUS Characteristics
Number of Routes 1
Fare Free
Operating Hours Monday-Thursday: 7 a.m.-10 p.m.
Friday: 7 a.m.-12 a.m.
Saturday: 9 a.m.-12 a.m.
Sunday: 10:30 a.m.-6 p.m.
Frequency Frequency: Every 10-15 minutes
Annual Ridership 692,221 (2018)
Operating Costs $1,345,717 (2018)
Operating Agency Central Ohio Transit Authority (COTA)
Vehicle Type Bus
Figure 5-4 CBUS Vehicle
Source: CBUS
Nelson\Nygaard Consulting Associates, Inc. | 5-6Downtown Circulator Study | Existing and Emerging Conditions
Greenlink Downtown Circulator, Houston, TX
GreenLink is a fare-free downtown Circulator in Houston, Texas
that has two routes: Green and Orange. The Green Route Houston’s Greenlink has
connects Main Street and the Avenida Houston entertainment two circulator routes in
district with office-heavy Southwest Downtown Houston,
the city’s downtown core
operating on weekdays every 7 to 10 minutes. Downtown workers
with short headways.
are the primary market of the Green Route. The Orange Route
connects major attractions around downtown, including Historic
Market Square, City Hall, and the Theater District. This route operates seven days a week, with 10-
minute headways.
Residents of Harris County have expressed a growing interest in visiting and living in more transit-
oriented, walkable, and urban areas. The GreenLink Circulator improves access to downtown for those
visitors who do not own a car and for those who want to park once and move about the area without a
car. In 2010, Representative Sheila Jackson-Lee obtained an earmark from the Federal Transportation
Appropriations Bill to purchase seven GreenLink buses. GreenLink vehicles run on natural gas, making
them a clean alternative to traditional diesel buses.
GreenLink service started in 2012, funded by Houston First Corporation and the Downtown District and
operated by the Metropolitan Transit Authority of Harris County (METRO). The Orange Route was
launched in 2016 with encouragement from downtown businesses and in response to the area’s growth.
Further route updates and service hour expansions took place in 2018 aimed at improving service to
better serve the communities of downtown Houston. GreenLink’s ridership has not been as strong in
recent years: the circulator service will need to adapt, considering a growing population and disruptive
transportation technologies in what has become a crowded market for mobility options.
Figure 5-5 Houston Greenlink Downtown Circulator Routes
Nelson\Nygaard Consulting Associates, Inc. | 5-7Downtown Circulator Study | Existing and Emerging Conditions
Greenlink Characteristics
Number of Routes 2
Fare Free
Operating Hours Green Route (412)
Monday-Friday: 6:30 a.m. - 6:30 p.m.
Orange Route (413)
Monday-Friday: 6:30 p.m. - midnight
Saturday: 9 a.m. – midnight
Sunday: 9 a.m. - 6 p.m.
Frequency Green Route (412)
Every 7 - 10 minutes
Orange Route (413)
Every 10 minutes
Annual Ridership 209,710 (2018)
Operating Costs $1,509,420 (2018)
Operating Agency METRO
Vehicle Type Bus
Figure 5-6 Greenlink Circulator
Source: Downtown Houston
Nelson\Nygaard Consulting Associates, Inc. | 5-8Downtown Circulator Study | Existing and Emerging Conditions
Portland Streetcar, Portland, OR
The Portland Streetcar serves Downtown Portland with
three different lines operating on over 16-miles of Portland Streetcar is widely
track. Portland’s streetcar the city’s long-term accepted as an example of a
commitment to intercity circulation. Between the
successful modern streetcar
three lines, the North/South, A-Loop, and B-Loop
network used by locals and visitors
streetcar routes have been trending upward towards a
ridership of nearly 5 million rides.
to connect downtown Portland and
surrounding districts.
The A & B Loops are circular routes that connect the
Pearl and Central Business districts—located west of the Willamette River—to the Central Eastside
Industrial and Lloyd districts east of the river. Though they run parallel, the A Loop moves clockwise,
and the B Loop moves counterclockwise. The A & B Loops cross the river by way of the Broadway Bridge
to the north and Tilikum Crossing to the south. The Tilikum Crossing is a long-span bridge that allows
access to public transit, pedestrians, and cyclists. Private vehicles are not permitted.
The Streetcar’s NS Line is entirely located west of the Willamette River, extending for eight miles from
the South Waterfront neighborhood to the Alphabet District providing service to both Portland State
University (PSU) and to the Pearl and Central Business Districts.
The Streetcar operates seven days a week, with headways ranging from 15 to 20 minutes. The vehicles
are ADA accessible, and are equipped with physical features such as low-floor sections, loading ramps,
overhead announcements, and live marquees to accommodate users with a wide range abilities.
The Portland Streetcar is owned by the city and operated by the Portland Bureau of Transportation
(PBOT) in partnership with Portland Streetcar, Inc. (PSI) and TriMet.
Figure 5-7 Portland Streetcar
Nelson\Nygaard Consulting Associates, Inc. | 5-9You can also read


