Otaki to North of Levin Transport Improvements - Prepared for: New Zealand Transport Agency - NZ Transport Agency
←
→
Page content transcription
If your browser does not render page correctly, please read the page content below
Otaki to North of Levin
Transport Improvements
Preliminary assessment of effects:
  - Economic impacts of construction activity
  - Levin retail centre effects

Prepared for: New Zealand Transport Agency

Date: August 2017
Status: Final Report

Document reference: NZTA004.16
  Date of this version: 15 August 2017
  Report author(s):         Derek Foy                  (09 915 5518
                            Lawrence McIlrath          (09) 915 5523

            Date               Version                             Changes
   17/03/2017                  First draft                         -
   10/04/2017                                         Report updated to reflect comments and questions from
                                                      Richard Peterson and Greg Lee. The main changes were
                                                      restructuring the report and addressing minor questions
                                                      for clarity.
   13/04/17                                           Address auto numbering and cross reference issues.
   19/06/2017                                         Include a minor request from NZTA.
   15/08/2017                  Final Report           Additional comments from NZTA.

  Disclaimer
  Although every effort has been made to ensure accuracy and reliability of the information contained in this report,
  neither Market Economics Limited nor any of its employees shall be held liable for the information, opinions and
  forecasts expressed in this report.

                                                                                              Market Economics Limited
                                                                                                 Level 5, 507 Lake Road
www.me.co.nz                                                                                  PO Box 331 297, Takapuna
                                                                                                     Auckland 0740, NZ
Contents
1     INTRODUCTION ................................................................................................................. 1
1.1   BACKGROUND .................................................................................................................................. 1
1.2   OBJECTIVE ....................................................................................................................................... 3
1.3   STRUCTURE ..................................................................................................................................... 3
2     ECONOMIC IMPACTS.......................................................................................................... 4
2.1   FACILITATED EFFECTS......................................................................................................................... 4
2.2   CONSTRUCTION EFFECTS .................................................................................................................... 6
2.3   ASSUMPTIONS ................................................................................................................................. 6
2.4   ECONOMIC IMPACTS ......................................................................................................................... 8
2.5   CONCLUSION ................................................................................................................................. 11
3     RETAIL IMPACTS METHODOLOGY ..................................................................................... 12
3.1   TOWN CENTRE FLOORSPACE AND SALES .............................................................................................. 12
3.2   CATCHMENTS................................................................................................................................. 13
3.3   DEMAND ....................................................................................................................................... 15
3.4   CUSTOMER ORIGINS ........................................................................................................................ 15
3.5   SCENARIO DEFINITION ..................................................................................................................... 17
3.6   TOWN CENTRE SALES PROJECTIONS .................................................................................................... 18
4     RETAIL ENVIRONMENT CONTEXT...................................................................................... 19
4.1   HOROWHENUA DEMOGRAPHY .......................................................................................................... 19
4.2   HOUSEHOLD PROJECTIONS ............................................................................................................... 19
4.3   LEVIN TOWN CENTRE COMPOSITION................................................................................................... 21
4.4   LEVIN TOWN CENTRE CUSTOMER ORIGINS ........................................................................................... 23
4.5   HOROWHENUA DISTRICT RETAIL SPEND FLOWS .................................................................................... 24
4.6   SPEND BY TRIP PURPOSE .................................................................................................................. 24
5     DEMAND ASSESSMENT .................................................................................................... 27
5.1   INTERPRETATION ............................................................................................................................ 27
5.2   RETAIL DEMAND PROJECTIONS .......................................................................................................... 27
5.3   LEVIN TOWN CENTRE SALES .............................................................................................................. 28
5.4   MITIGATING FACTORS ..................................................................................................................... 32
6     CONCLUSION ................................................................................................................... 34
6.1   RETAIL IMPACTS ............................................................................................................................. 34
6.2   CONSTRUCTION IMPACTS ................................................................................................................. 35
Figures
FIGURE 1.1: WELLINGTON NORTHERN CORRIDOR (FROM NZTA) ................................................................. 2
FIGURE 2.2: DISTRICT BASED SPENDING PROFILE........................................................................................ 8
FIGURE 2.1: WELLINGTON BASED SPENDING PROFILE ................................................................................. 8
FIGURE 2.3: WELLINGTON BASED SPENDING PROFILE ................................................................................. 9
FIGURE 2.4: DISTRICT BASED SPENDING PROFILE........................................................................................ 9
FIGURE 2.5: WELLINGTON BASED SPENDING PROFILE ............................................................................... 10
FIGURE 2.6: DISTRICT BASED SPENDING PROFILE...................................................................................... 10
FIGURE 3.1: STUDY CATCHMENTS ......................................................................................................... 14
FIGURE 3.2: SCENARIO DEFINITION: WITH BYPASS .................................................................................... 17
FIGURE 4.1: HOROWHENUA POPULATION (2016) ................................................................................... 19
FIGURE 4.2: STUDY AREA HOUSEHOLD PROJECTIONS (BY IMPACT AND GROWTH SCENARIO) ............................ 20
FIGURE 4.3: HOROWHENUA DISTRICT HOUSEHOLD PROJECTIONS ............................................................... 21
FIGURE 4.4: LEVIN TOWN CENTRE BUSINESS DEMOGRAPHY ...................................................................... 22
FIGURE 4.5: LEVIN TOWN CENTRE CUSTOMER ORIGINS BY STORETYPE ........................................................... 23
FIGURE 4.6: DESTINATION OF SPEND BY HDC RESIDENTS (2016) ............................................................... 24
FIGURE 4.7: LEVIN TOWN CENTRE SPENDING BY CUSTOMER SEGMENT .......................................................... 24
FIGURE 4.8: LEVIN TOWN CENTRE SPENDING BY CUSTOMER SEGMENT .......................................................... 25
FIGURE 4.9: LEVIN TOWN CENTRE SPEND BY KAPITI AND WELLINGTON CUSTOMERS ........................................ 25
FIGURE 4.10: LEVIN DESTINATION SPEND BY STORETYPE AND ORIGIN ........................................................... 26
FIGURE 5.1: TOTAL DEMAND RESIDENT IN EACH CATCHMENT ($M) ............................................................ 28
FIGURE 5.2: LEVIN TOWN CENTRE SALES WITHOUT TRANSPORT IMPROVEMENTS ($M) ................................... 29
FIGURE 5.3: LEVIN TOWN CENTRE SALES WITHOUT BYPASS BY IMPACT SCENARIO ($M) .................................. 29
FIGURE 5.4: LEVIN TOWN CENTRE SALES WITH TRANSPORT IMPROVEMENTS ($M)......................................... 30
FIGURE 5.5: LEVIN TOWN CENTRE IMPACTS AND RECOVERY PERIOD (MEDIUM SCENARIO) ................................ 31
FIGURE 5.6: PROJECTED ORIGIN OF LEVIN TOWN CENTRE RETAIL SALES ....................................................... 32
1 Introduction
Market Economics (M.E) was commissioned by New Zealand Transport Authority (NZTA) to
assess the economic effects of the proposed Otaki to North of Levin section of the Wellington
Northern Corridor Roads of National Significance (RONS). This project is part of a wider
assessment process and it is M.E‘s understanding that additional work covering other areas
will be undertaken. These other areas could include the wider economic benefits and
facilitated effects that the transport improvements would deliver to the Horowhenua District
economy and the potential effects of mitigation strategies. The scope of this investigations is
as follows:
The economic impacts of road construction activity,
The effect of the proposed transport investment on the Levin Town Centre (effects on
retail activity, including displacement effects),
This study has been undertaken ahead of selection of a preferred alignment / route option
and instead has been undertaken on the premise that the improvements will deliver a four
lane expressway, standard road to Levin and will include a bypass. Once the preferred
alignment has been selected, then the following aspects should be assessed (this is in line with
NZTA’s original brief):
The effect of the proposed transport investment on economic growth (diversification
and expansion) in Horowhenua,
Specific effects on proposed commercial development areas identified in the
Horowhenua District Plan, and
The effects of growth in population on the local economy and its relevance and
relationship to the proposed road.
1.1 Background
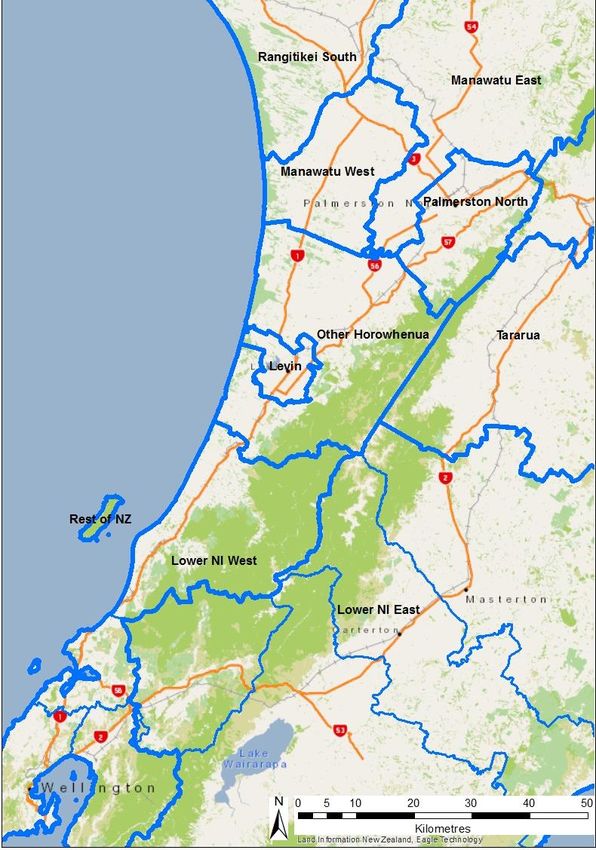
State Highway 1 (SH1) is the main road link running north to south through the North Island,
and currently passes through many towns and other urban areas. A redevelopment of a
110km stretch of SH1, from Wellington to north of Levin, is currently underway. The new road
is one of the government’s seven Roads of National Significance (RONS), and is made up of a
number of separate projects, as shown in Figure 1.1.
Several in Wellington, to improve inner-city traffic flows,
Transmission Gully,
Mackays to Peka Peka,
Peka Peka to Otaki, and
Otaki to North of Levin.
1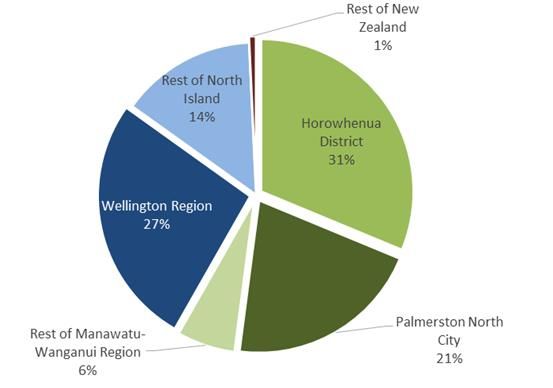
These projects are at different stages of planning, with the route selection and configuration
of the road, ramps and potential bypasses still to be determined in some areas, and
construction is underway in other areas so that by 2021 an expressway will extend from
Wellington to the            Figure 1.1: Wellington Northern Corridor (from NZTA)
north of Otaki. The
next section is the
Otaki to North of Levin
(O2NL) section, which
is planned to address
existing issues in this
section of the State
Highway and to meet
long-term transport
and       land      use
objectives.

The          transport
improvement
currently         being
considered     is     to
continue the four lane
expressway         from
Otaki to north of
Levin. The preferred
route configuration
option and presence
and position of any
ramps have not yet
been decided, and this
assessment           will
contribute to the
information base that
is relied on when
selecting a route
configuration option.

Currently SH1 is the main road through Levin, and passes through the Levin Town Centre. One
possibility that is being considered for the O2NL section is a bypass of the town. That bypass
would have both potential benefits (especially improving travel times) and costs (potentially
reducing visitation to the town centre and sales in businesses there). This report quantifies
the potential economic impacts of the transport improvements. Specifically, it provides an
indication of the potential adverse effects on the Levin town centre, and positive effects
arising from the construction activity. We provide high level commentary on the potential
facilitated (and ongoing) effects that might accrue to the Horowhenua economy.

                                                                                          2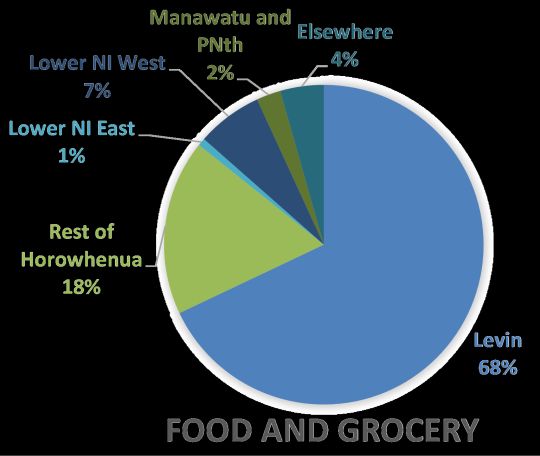
1.2 Objective
There are three objectives of this assessment:
i) To estimate the economic impacts of constructing the O2NL section of the RoNS,
ii) To provide a preliminary qualitative analysis of potential facilitated effects, and;
iii) To assess the effects of potential transport improvements on the Levin Town Centre.
It is important to note that these objectives (as defined for this study) form part of a wider
assessment programme (as mentioned earlier). This wider programme is interested in
understanding the potential effects of the transport improvement in terms of how it unlocks
other economic activities in the Horowhenua District, the flow on effects of enabling a greater
population base to live in the district as well as the consequential lift in economic activity.
1.3 Structure
The report is structured as follows:
Sections 2 describes the outcomes of our assessment of the economic impacts of the
construction and activity. This section concludes with high level comments on the
facilitated effects.
Sections 3 through 6 discuss the potential effects on the town centre.
3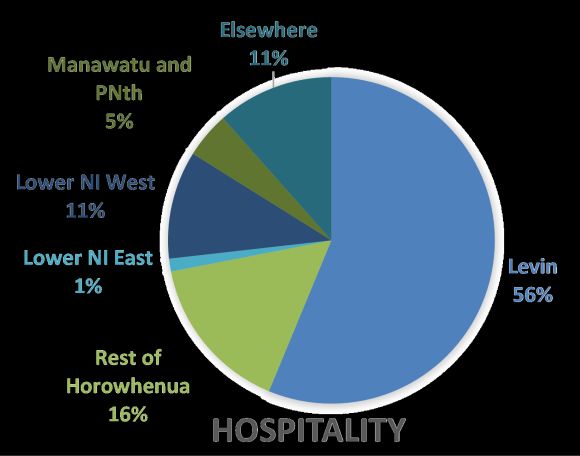
2 Economic Impacts
Investing in transport infrastructure can deliver one-off and ongoing effects. The ongoing, or
facilitated, effects are normally the reason or rationale for undertaken the investment
because they tend to span multiple years; they change cost structures, unlock markets and
stimulate growth. However, the short term economic effects associated with building
(constructing) the road infrastructure also delivers economic impacts.
Both the facilitated effects and construction effects are addressed in this section. With
reference to the facilitated effects, this report provides high level comments1.
2.1 Facilitated effects
In addition to the short term and once-off construction effects (discussed in the next section),
improving the transport connections between Levin and Wellington as well as northwards, is
expected to unlock or facilitate a range of other effects. Some of these effects have a sub-
regional scale and other will have a more localised (i.e. Horowhenua District) effect. In terms
of direction, the effects could be positive or negative. Further, in some cases the effects could
be positive in one area and negative in another (i.e. a distributional issue).
As mentioned, the effects arise due to an improved ability to ‘connect’ across space and this
then changes the local competitive landscape. The changes manifest through changing
businesses’ cost structures, their ability to access different markets and compete. In addition,
it has the ability to affect productivity (i.e. by changing transaction costs). The effects can be
grouped as follows:
Employment effects,
Productivity effects, and
Real estate effects.
A short commentary about these effects follows.
2.1.1 Employment effects
The improved accessibility may cause a growth impulse to the Horowhenua economy due to
it improving the linkages (and flow of goods and services) into, and out of, Levin and the
district. This stimulus is likely to lift the performance of existing sectors while stimulating
undeveloped and underdeveloped opportunities.
Existing businesses (in district) are expected to benefit from a lowering of transport costs
associated with trading with Wellington based businesses. Of course, lower transport costs
1It is our understanding that more detailed assessment of these effects would be undertaken as part of additional
and further work streams.
4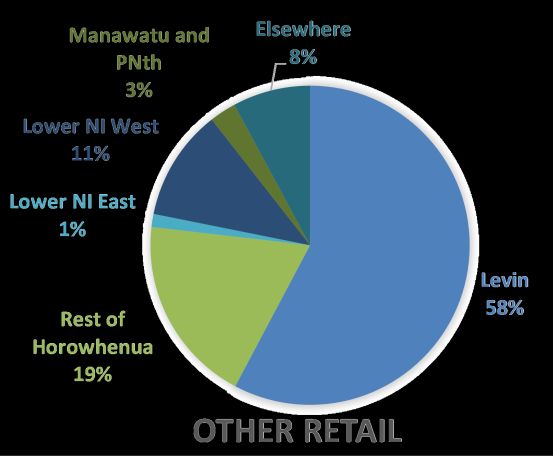
also benefit Wellington based business, enabling them to compete with local businesses (i.e.
        the effects can be both positive and negative). Increasing the size and frequency of the
        transactions will flow through into employment.

        Generally, improvements in connectivity (through transport investments) can support
        employment effects. In cases where commuting travel costs fall, it could lead to more people
        seeking to enter into employment. This results in more people in the labour force, working,
        generating economic value (GDP) and earning salaries and wages. In the context of this study,
        lowering commuting costs could also affect Horowhenua’s access to labour because local
        residents could now consider working in Wellington and in the wider region (i.e. Wellington;
        so reducing the local labour pool). Nevertheless, if the people work in Wellington but live in
        the district, then they are likely to spend a portion of their earnings in the district. In other
        words, the salaries and wages earned elsewhere would be spent locally (within the district),
        supporting local businesses, such as: retailers, hospitality businesses as well as the property
        market.

        Another effect is that the proposed project will make is easier to trade with Wellington,
        suggesting that it will make the size of the market that the local business can service, larger
        and also easier (less costly) to service. By making it easier to connect, it will assist local
        businesses to improve client relationships by lowering the cost of face-to-face meetings.
        Improving the level of service and lifting client satisfaction, will lead to additional sales. In
        turn, extra resource would be needed to deliver the growth translating into a lift in job
        numbers.

        The scale of these effects are likely to be small and would manifest over the medium to long
        term2.

2.1.2   Productivity effects
        Reducing overall transport cost, lowers the ‘effective’ distance between areas, promoting
        trade, increasing variety and facilitating specialisation. It expands the size of the market,
        making it more cost-effective to service the overall market ($ per unit of input cost). Clearly,
        improving the travel time (reducing it) is expected to have an impact on productivity
        outcomes. These effects are arise from time savings. In addition to these direct effects, lower
        transport cost can lead to a larger market being serviced (as already mentioned), leading to
        higher levels of competition. Competition will lead to knowledge spill overs (as staff move
        between businesses, sharing knowledge and know-how). This then contributes to lifting
        productivity. Over the longer term, increasing productivity leads to a lift in wages and salaries
        which then also increases the relative attractiveness of the location as a business location
        (especially for businesses that rely on household spending).

2.1.3   Real estate effects
        Another facilitated effect of the proposed investment relates to the real estate market.
        Essentially, it is anticipated that the investment will change the relative attractiveness of the
        district to households, businesses and investors. This will influence decisions to

        2   Based on commuting times.

                                                                                                     5
migrate/locate to Horowhenua. A lift in population has implications for the district’s
residential real estate markets in that it will create demand for housing. This extra demand
then flows through into the real estate market, lifting house prices, triggering construction
activity and housing turnover. The larger population also has implications and flow on effects
for retail and hospitality businesses. These effects relate to the additional demand for the
goods and services demanded by residents.
Over the longer term, the higher growth rate experienced by retailers and hospitality
translates into growth that then flows into investment in new (and/or larger) floor space to
service demand. Therefore it is important to have an appropriate planning framework in place
to guide development in a way that contributes to, and enhances urban efficiency.
2.2 Construction effects
The scale and direction of the economic effects associated with building the infrastructure are
influenced by a number of factors, including:
The total budget (cost)
The spatial distribution of the expenditure (i.e. where the spending takes place;
Levin, Wellington, Palmerston North or other).
The timing of spend.
There is considerable uncertainty around each of these points because the design, costs and
timeframes are yet to be finalised. Therefore, the economic impacts presented here should
be treated as indicative estimates only. We suggest refining the modelling3 at a later stage
once more details about the budget, spending profile and timelines are available.
In terms of methodology, we used a multi-regional Input-Output (MRIO) model, covering six
areas4. The model encapsulates 106 economic sectors and reflects the flows of goods and
services between sectors and between the mentioned regions. The economic impacts are
presented in terms of Value Added5 and Employment terms.
2.3 Assumptions
Before presenting the findings, the key assumptions used in the analysis, are outlined. As
already mentioned, the specific details around the costs, the spending profile (i.e. where the
spending takes place) and the timelines will be refined at a later stage. In light of this
uncertainty, we defined two scenarios around the spending profile and estimated the
economic impacts accordingly. With reference to total cost and timeframes, the following is
important:
3 This could then also include CGE modelling.
4
Horowhenua District, Palmerston North City, Rest of Manawatu-Wanganui Region, Wellington Region, Rest of
North Island, and Rest of NZ.
5 Value Added is similar to GDP but excludes tax of products. Therefore VA is slightly lower than GDP.
6 Total cost: We used $600m as cost. According to NZTA, this is an initial, high level
estimate of the cost. This cost is likely to change as the engineering designs and
geotechnical testing are undertaken. Therefore, the economic effects associated with
constructing the transport improvement is expected to differ from those presented in
this report. The purpose of the analysis is provide an indication of the potential scale
of the effects6.
In terms of the timeframes, again, there are a number of unknowns, specifically when
construction starts and its duration. Normally, the approach is to distribute costs out
over the construction period with adjustments for cost escalation, run through the
economic model with the results then discounted back to current terms7. The DCF
analysis is better suited to longer timeframes and is useful when assessing ongoing
effects. In this construction period (±3 years) the combined effect of inflation (price
increases going forward), discounting (the NPV calculation) and relatively short
timeframe mean that the overall usefulness of adjusting the results to account for the
time value of money is limited8.
With reference to the total expenditure, we defined two spending profiles:
1) A profile where the project is delivered by a contractor that is based within the area
(district) – this reflects a situation where a large portion of the spending goes directly into
the Horowhenua district economy, and
2) A spending profile that assumes that the project is delivered by a national (or
multinational) business based in Wellington and Auckland. This spending profile assumes
that the services is delivered from Wellington with some of the raw inputs purchased from
Horowhenua businesses.
The expenditure was apportioned to different sectors based on the input structures captured
in regional IO tables (as estimated by M.E). Essentially, the expenditure was mapped to the
sectors9 used on the IO model with adjustments for interregional imports and exports, salaries
and wages and operating surplus. The salaries and wages associated with the business
spending were allocated to the region where the spending is expected to occur (i.e. Wellington
or Horowhenua).
It is important to note that with the Horowhenua spending profile, a portion of the
expenditure is likely to flow out of the District via supply chain effects to the neighbouring
economies such as Palmerston North because not all the inputs required for the project are
available in the local economy. Figure 2.1 and Figure 2.2 show the relative distribution of the
spending.
6 For this study, we used M.E’s MRIO modelling capability. Using other modelling frameworks e.g. Computable
General Equilibrium or CGE, will return different economic impacts. Our experience has shown that CGE-model
results can be between 40% and 60% of those estimated using IO models.
7 Using Discounted Cash Flow (DCF) analysis i.e. expressed in NPV terms (or Net Present Value terms)
8 If more detail around the timing and the potential budget was known, then undertaking a NPV analysis would
provide a better indication of the likely scale of the effect. Nevertheless, in the context of this study, the effect on
the impacts (i.e. the results) are likely to be small.
9 The model has 106 economic sectors (excluding primary inputs).
7Figure 2.1: Wellington based spending profile Figure 2.2: District based spending profile
In terms of the project funding (how the project is funded), does not include this because the
focus is on understanding the potential effects on the local (district) economy. Once more
detail around the project costs are available, the funding streams should also be included in
an assessment. How a project is funded is important because it can have a direct influence on
the GDP effects.
2.4 Economic impacts
The economic impacts of two spending profiles are, as expected, markedly different when
viewed from a District perspective. Expressing the results of the two profiles as a range
suggests that the GDP impact on the Horowhenua economy will be between $27.8m - $58.5m.
This suggests that between 5.1% and 13.7% of the total GDP impacts will accrue to the
Horowhenua economy.
In addition to GDP, the activity will support employment and return income to households.
Similar proportions of the total effects for these indicators will be felt locally with between
4.4% and 14.5% of the income and 4.5% and 14.6% of the employment effects. This equates
to between $11.6m and $30.7m in income and between 260 and 690 jobs. Clearly, the scale
of the local effects are subject to where the spending takes places.
As mentioned, some of the economic effects will be felt in the wider region. Figure 2.3 and
Figure 2.4 show the distribution of the GDP effect across the different spatial areas.
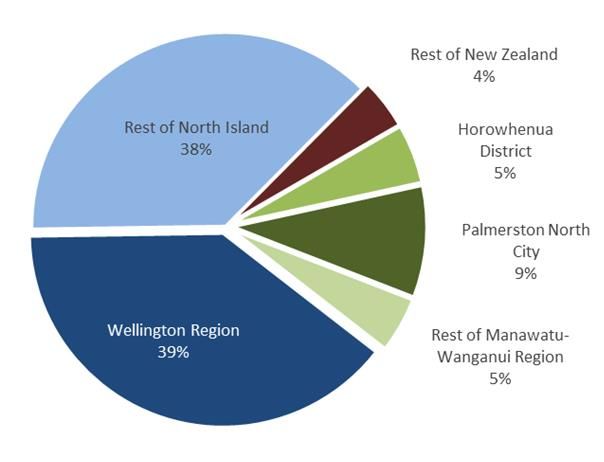
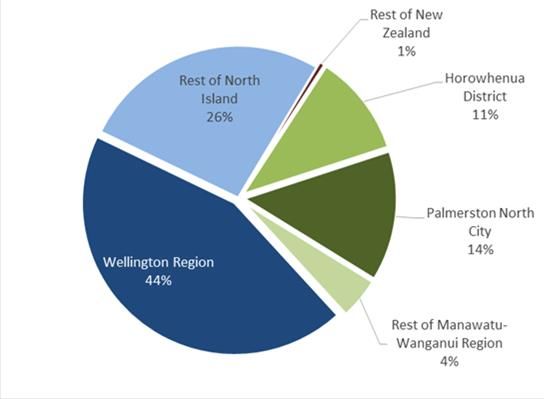
8Figure 2.3: Wellington based spending profile Figure 2.4: District based spending profile
The wider region (Horowhenua, Palmerston North and the Rest of Manawatu-Wanganui), will
capture a portion of the total effects. Under the Wellington based spending profile, the wider
region is expected to receive between twenty (20%) and forty per cent (40%) of the effects.
The specific values are:
% of effects felt in the region
Wellington based spending profile District based spending profile
GDP 19.0% 38.5%
Income 19.2% 39.5%
Employment 22.4% 44.0%
The reason for this is because the local economy is relatively small with linkages to the larger
regional economies i.e. Palmerston North and Wellington. In other words, the economic
effects associated with constructing the road will flow out to the wider region. Under both
spending profiles, most of the economic effects will be felt in the rest of NZ, particularly
Wellington and the Rest of the North Island.
Figure 2.5 and Figure 2.6 show the distribution of effects across the six regions used in our
modelling.
9Figure 2.5: Wellington based spending profile
Figure 2.6: District based spending profile
The concentration of the effects in Wellington and the Rest of the North Island is clear. The
total GDP effect (across NZ) is estimated to be between $426.0m and $549.4m. In the regional
context, most of the economic effects flow to Palmerston North with the City capturing
between 44.6% and 49.1% of the regional effects10 (in GDP terms). Of the GDP effects,
between $27.8m and $58.5m is expect to accrue to Horowhenua District. In terms of income
effects, the construction spending is expected to translate into household income of between
$11.6m and $30.7m in the form of salaries, wages and a portion of operating surplus11 to the
District’s households.
The above illustrates the difference between the two spending profiles. The relative
distribution of the effects, when measured using income or employment, shows a similar
pattern as in the above figures with the effects concentrated outside the immediate location.
10 This is the share of regional VA (Palmerston North VA divided by the sum of VA in Horowhenua, Palmerston
North and the rest of Manawatu-Wanganui)
11 Paid out in the form of dividends.
10One possible reason for this is could be that the Horowhenua economy is relatively small, so
it imports a large portion of its inputs from the larger economies, thereby lowering the local
effects and shifting them to the cities (i.e. Palmerston North, Wellington and Auckland).
2.5 Conclusion
Investing in transport infrastructure will have a number of economic effects, some of these
will be felt in the district and some it in the wider economy. With reference to the economic
impacts associated with building the infrastructure, where the impacts are felt is subject to
where the spending takes place. Irrespective of where the spending takes place, a portion of
the economic impacts are expected to manifest within the District.
The economic impacts reflect the GDP effects associated with the investment but given the
uncertainty around the budget and timing, the results presented in this report should be seen
as indicative only. Once a firmer budget is known, the impacts should be re-estimated and
the funding mechanisms (i.e. how the project is funded) should also be taken into
consideration. This funding is crucial because it provides an indication of the distribution of
the ‘who pays’ and ‘who benefit’ questions.
In addition to the one-off impacts associated with constructing the transport improvements,
the Wellington Northern Corridor is expected to facilitate a number of other effects, the
benefits of which will persist in the Horowhenua economy well beyond completion of the
project. At a high level, these effects can be grouped into three broad categories including:
productivity effects, employment effects and real estate effects. These facilitated effects arise
due to improved connectivity (i.e. making it easier to connect) and accessibility.
113 Retail Impacts Methodology
In this section we describe the methodology and data sources used in the retail impacts
assessment. By way of overview the methodology involved:
measuring Levin town centre floorspace and estimating sales made from that
floorspace;
defining consumer catchments;
quantifying total demand resident in each customer origin catchment;
understanding the origin of consumers that sales are made to;
defining scenarios to represent alternate futures with and without a potential bypass
of Levin
projecting growth in sales under each scenario, and;
comparing scenario sales to derive a measure of impact.
3.1 Town centre floorspace and sales
We digitised from aerial imagery all retail, services and hospitality floorspace (gross floor area,
or GFA) in the Levin town centre and coded space to an ANZSIC12 category. That information
is useful to provide context about the quantum and range of activities in those sectors in the
town centre, and also provides the one basis for one of the two approaches of estimating total
centre sales. By applying average floorspace productivity ratios ($ sales per m2) from our
proprietary retail models, we then estimated the total sales the measured quantum of
floorspace is likely to yield. The second method used to estimate those sales is a demand-side
assessment, and involves capturing specific shares of demand as described in the customer
origin assessment, as described later in this section.
Actual sales data is not available due to confidentiality constraints, and so this dual estimation
approach yields a reasonable approximation of current sales. In any case the accuracy of that
estimation is less important to the assessment than the relative change between scenarios, as
ultimately it is the percentage change as a result of any changed future environment (e.g. a
potential bypass) that measures the size of the impact.
Base year (2016) sales are then projected forward to establish future sales the town centre
would be expected to produce assuming current shopping patterns and therefore market
share remains the same from each catchment. The driver of that spend growth is growth in
12 Australian and New Zealand Standard Industrial Classification
12each catchment, and each consumer type, which is derived from the demand projections
(described later in this section).
A key driver of potential change in shopper spending is any reconfiguration of SH1 around
Levin (i.e. a possible bypass). A bypass might induce current shoppers to spend less in Levin
(by virtue of the town centre no longer being on their primary travel route) or more (if the
town centre becomes a more attractive place to visit due to less traffic passing through it).
Although the town centre’s attractiveness might increase as a result of a bypass, the scenarios
do not make any provision for this outcome because any such change is difficult to predict and
quantify. Any such outcome would mitigate the effects presented.
The effect of a realignment of SH1 through Levin would be different on various consumer
segments, with those visiting Levin as their destination likely to be much differently affected
than those travellers who are merely passing through Levin on their way to some other
destination. The modelling applies various assumptions to assess the potential impact of any
bypass, and tests the sensitivity of those different assumptions, taking into consideration the
current and future attractiveness of the Levin town centre to consumers from different
origins. The assumptions underlying each scenario are described in the body of the report.
3.2 Catchments
Key to assessing the potential effects on the Levin town centre is understanding where
consumers patronising stores in Levin live, and how likely they might be to change their
current shopping patterns in the event that a bypass is constructed. The proclivity of
consumers to change their shopping patterns will vary depending on where they live, and why
they visit the Levin town centre. Indicatively people living in Levin are unlikely to change their
shopping patterns as a result of any bypass, whereas a share of motorists passing through
Levin on SH1 now may cease to do so if SH1 bypasses the town. A catchment analysis provides
the framework to take this into account.
The catchments defined were delineated so as to group areas into those sharing similar travel
patterns and retail uses of Levin. The area from which Levin draws its retail customers is
constrained by the presence of other large retail centres, including at Palmerston North (40
minutes’ drive to the north-east) and on the Kapiti Coast to the south (Otaki is 20 minutes’
drive, Waikanae 30 and Paraparaumu nearly 40 minutes)13. Given the location of these other
centres, three main types of catchment were defined (Levin, Rest of Horowhenua, Outside
Horowhenua), each with a number of subcatchments14 (Figure 3.1). Areas inside Horowhenua
are defined at a higher level of spatial detail than non-Horowhenua areas. The subcatchments
outside of Horowhenua reflect the configuration of the main state highways coming into Levin,
and include:
SH1 northern approach, including Taranaki, Wanganui District, Rangitikei District and
the rest of the central and upper North Island,
13 Current pre-RoNS travel times, which will reduce somewhat on completion of each stage of the RoNS
14 Levin has six subcatchments, the Rest of Horowhenua has eight (Shannon, Foxton, Waitarere, five rural areas)
13 SH1 southern approach: Lower North Island West and East (all of the TAs in the
Wellington Region15),
Palmerston North approach, including Palmerston North, Manawatu East, Hawkes
Bay Region, Tararua District.
For the purposes of this assessment Levin and the rest of Horowhenua are referred to as
“local” catchments, and consumers from other origins are non-local spend. Non-local spend
can be either:
Destination spend: people staying in Levin, or visiting for a specific purpose, or;
Pass through spend: people travelling through Levin on the way to a destination
elsewhere, but stopping and making a transaction in Levin on the way.
Figure 3.1: Study Catchments
15 Kapiti Coast, Upper and Lower Hutt, Porirua, Wellington City, Masterton, South Wairarapa, Carterton, Masterton
143.3 Demand
A core dataset in the assessment is retail demand. Retail demand is the spending power that
consumers have, and which is available to be directed to any retail destination. The demand
projections used in this assessment have been sourced from M.E’s ‘Market Meter’ tool.
Market Meter is a proprietary tool that synthetises all of M.E’s retail demand data in a single
dataset, providing market demand estimates and projections for 42 retail store types at a
meshblock level, and accounts for all retail spending by households, businesses and
international and domestic tourists. Household spending is divided into components of total
spending power from home and from work.
Demand data in Market Meter is calculated based on:
The number of consumers (households, businesses, workers and tourists) resident in
each location. This data comes from Census 2013 and SNZ household projections (for
households) and SNZ’s Business Frame (businesses and workers). While residential
consumers are by far the most dominant component of total demand, it is important
that the other components are also included in the assessment. An alternative series
run for this assessment is from NZIER’s projections16 of Horowhenua District
population under a scenario where the RoNS stimulates higher growth.
Meshblocks’ socio-demographic composition. This socio-demography applies 210
segments defined by age (six segments), household composition (seven segments)
and income (five segments), from Census 2013 data, projected forwarded using SNZ’s
age projections.
The spending power of each consumer segment (households and non-household
consumers). The spending power of each segment is sourced from customised output
from Statistic’s NZ’s (SNZ) Household Economic Survey, and calibrated at a national
level to total retail spending identified in SNZ’s Retail Trade Survey.
Economic prospects and expected short to medium term spending trends (such as an
increase in spending per household). These trends are based on a range of
macroeconomic indicators and consensus forecasts of the economic outlook, and
drive the spend projections.
The output used in this assessment is a meshblock level dataset of total retail demand arising
from each meshblock from the base year (2016) and then five-yearly out to a 2043 horizon.
Demand is grouped to catchments, the composition of which is described in section 3.2.
3.4 Customer origins
The total demand resident in each catchment is established as described in section 3.3. The
next step is to understand how much of that demand is directed to the Levin town centre.
16 “Investment in transport infrastructure: Effects on economic and demographic outlook” NZIER, December 2015
15For this assessment a customised dataset was obtained from BNZ Marketview, to understand
the shares of spending in Levin town centre that originate from customers resident within
each catchment. It is non-Horowhenua residents that will be most likely to change the amount
they spend in Levin, given any reconfiguration of SH1 to bypass Levin.
Marketview data records all credit and debit card transactions made by BNZ customers,
including detail about the residential address of the cardholder, the location and type of
merchant involved in every transaction and the time and value of each transaction.
Marketview transactions account for approximately 15% of all spending in the NZ economy.
The major banks (ANZ, BNZ, Kiwibank, Westpac) all have branches in Levin, meaning the
transaction data is likely to be representative of the roader population.
Marketview data is only made available in an aggregated form that protects the confidentiality
of customers and the commercial sensitivity of merchants. The data only covers BNZ
cardholders, and excludes cash and cheque purchases, however because of its sheer volume,
Marketview data provides robust information on the geographic patterns of shopping. It is
also useful for identifying key parameters of shopping behaviour, particularly travel distance
and sequential visits by cardholders.
The data commissioned for this project identifies several things:
The place of residence of customers spending within Levin Town Centre. All origins
are grouped into catchments that reflect the likely nature of their presence in Levin,
whether Levin residents, those living in Horowhenua or people passing through Levin.
Consumer travel patterns. This data was analysed by Marketview and provided in
aggregated form to summarise the total number of transactions that were made by
non-locals (i.e. those living outside Horowhenua) on different sorts of trips. Trips
classified included:
Destination trips: those where the consumer visited Levin specifically, and not
in conjunction with other shopping. This was defined as trips where a
consumer’s only transaction either side of transactions in Levin were nearer
to their place of residence than Levin.
Pass-through trips: trips where the consumer undertook a transaction in Levin
on their way to somewhere else. These were defined as trips where a
consumer made a transaction near home, then in Levin, then one further
away from home than Levin (i.e. north of Levin if living to the south, and the
reverse).
Store types visited. A count of transaction numbers and values in each store type,
grouped to have sufficient merchants in each so as to satisfy Marketview privacy
requirements.
163.5 Scenario definition
The base scenario in the assessment is a status quo future, where traffic is not diverted around
the town centre. In all other scenarios a bypass is constructed, and so the difference is the
effect of the bypass on Levin town centre sales. Impacts on the town centre were assessed
for four scenarios:
Very low impact
Low impact
Medium impact
High impact.
There are three different assumptions applied to make up the four scenarios, and the
assumptions are shown in Figure 3.2. The pass by traffic stop rates are explained below the
table.
Figure 3.2: Scenario definition: with bypass
Population
Pass by traffic Destination
Scenario name growth
stop rates trips
projection
20% more than
Very low impact NZIER 10.2%
Marketview
Statistics NZ 20% more than
Low impact 10.2%
High Marketview
Statistics NZ
Medium impact 9.3% Per Marketview
Medium
Statistics NZ 20% less than
High impact 8.5%
Low Marketview
Market size, in terms of current and projected population, is sourced from Statistics NZ’s
population projections17 and NZIER. NZIER produced an alternate growth estimate in their
December 2015 report (referenced earlier), in which the RoNS stimulates high growth in
Horowhenua, resulting in an additional 10,000 people in the District in 20 years. This
assessment assumes that the growth NZIER anticipates would occur in a linear manner across
the next 20 years. In reality if the RoNS stimulates the growth NZIER expect, that stimulation
would be unlikely to have full effect for some time after the RoNS is finished, meaning that
additional growth (relative to Statistics NZ growth scenarios) would be concentrated in the
latter part of the 20 year period.
Pass-by traffic stop rates describe the proportion of all vehicles travelling past Levin (on a
bypass) that choose to divert their route to travel into the Levin town centre and stop there.
That data is based on modelling by QTP (for the O2NL project team) that is still being verified.
The outer bounds of those stop rates (8.5% and 10.2%) are used for the very low, low and high
17 Subnational Population Projections: 2013(base)–2043 update, released February 2015
17impact scenarios, with the average applied to the medium impact scenario. Those bounds
were applied as they represent the outer limits of the range produced by QTP, and are
therefore synonymous with the other outer edge estimates (for population growth etc.) which
together for the impact scenarios.
The share of all non-local spend that occurs on destination trips (as opposed to pass through
trips) was calculated from Marketview data. That share varies by customer origin. To account
for uncertainty the assessment applies that Marketview data to the medium impact scenario
and applies an interval either side (±20%).
In all cases the scenarios are defined by a combination of factors that all push in the same
direction: impacts under the low impact scenario are low because population growth is high,
stop rates are high and destination trips are high, all of which would make for more potential
consumers in the town centre. The low and very low impacts are defined the same, with the
exception of population growth. The difference in impacts between the low and very low
scenarios is therefore down solely to that different growth rate.
3.6 Town centre sales projections
Town centre sales are then assessed for each scenario. Sales change over time as the size of
the population in each catchment changes, and also as a result of the underlying growth in
real spend per household. The attractiveness of Levin town centre to each catchment is
assumed to remain unchanged over time, and so changes in Levin’s retail sales do not result
from any structural change in consumers. The long-term increase in spend per consumer is
assumed to be 1%, which is consistent with historical trends.
For each scenario a comparison (with a potential transport improvement (which is assumed
to include a bypass) versus the status quo roading configuration where SH1 passes through
the town centre) yields the impact of the transport improvements. That means that the
comparison is, for example, a high growth future with the transport improvement and a high
growth future without the transport improvement. The difference between Levin town centre
sales under each scenario is the impact of the transport improvements. We note that the very
high growth future (as derived from NZIER) will only occur if the transport improvements
occur, given that future is predicated on the improvements existing. The ‘with’ vs ‘without’
(transport improvements) comparison for that (Very Low impacts) scenario is provided for
indicative purposes only.
184 Retail environment context
4.1 Horowhenua demography
There are currently (2016) some 31,300 people resident in Horowhenua District. Levin is the
largest town and focal point for economic activity, with just over half the District’s population
(16,300 people living in 6,000 households). Levin is located on SH1 at the northern end of the
Wellington Northern Corridor, near where SH57, the main route to the north-east towards
Palmerston North and Hawkes Bay begins. Levin is something of a focal point for traffic
travelling in the lower North Island.
Nearly a quarter of Horowhenua’s population (7,200 people) lives in rural areas, with a quarter
spread across several small towns: Foxton (population 2,700), Foxton Beach (1,700), Shannon
(1,200), Tokomaru (600) and Manakau (200). There are also nearly 1,300 people living in and
around Ohau (to the south of Levin) in a loose grouping of rural residential lots.
Figure 4.1: Horowhenua Population (2016)
Share of
Town Population Households
Population
Levin 16,300 7,000 52%
Foxton 2,700 1,200 9%
Foxton Beach 1,700 800 5%
Shannon 1,200 500 4%
Tokomaru 600 200 2%
Manakau 200 100 1%
Around Ohau 1,300 500 4%
Rural 7,200 3,100 23%
HDC total 31,300 13,500 100%
The rest of this study refers to catchments, which do not necessarily align with the towns as
described above, and is based on household counts, not population, to drive the retail
assessment.
4.2 Household projections
Households are the key consumer unit that drives retail spend, and for that reason are the
main demographic variable focussed on for this assessment. Population size is important,
although this is accounted for in the model’s segmentation which includes household size,
family type and income. The NZIER impacts scenario is defined with reference to their
projected growth rate in population, which for the purposes of this assessment we have
translated into household counts, using Statistics NZ population per household data. For the
non-Horowhenua catchments, the high Statistics NZ growth scenario was applied to the NZIER
projections (which inform the very low impact scenario).
19The lower part of the North Island is not a high growth area in terms of population and
household numbers. The fastest growth parts of the country are Auckland and Waikato with
average annual household growth of 1.4-1.5% (under a medium growth future). Wellington
City, Upper Hutt, Kapiti Coast and Palmerston North are projected to be the fastest growing
parts of the lower North Island out to 2043, with average annual household growth of 0.7-
0.8%. Porirua, Manawatu and Lower Hutt will have slower growth at 0.3-0.5%, while
Horowhenua (-0.1%), Wanganui and Rangitikei are projected by Statistics NZ to experience a
decline in household numbers by 2043.
Levin is projected to experience slightly faster growth than the rest of Horowhenua under the
high growth scenario, although would have respectively no growth or a decline under the
medium and low growth scenarios (Figure 4.2). Compared to the Statistics NZ projections, the
NZIER projection (10,000 additional people in the next 20 years in Horowhenua) is rather more
aspirational, and would equate to a gain of 7,000 households by 2043, compared to the 1,700
extra households estimated under the most optimistic by Statistics NZ. The NZIER growth rate
would be 1.5% per year over the next decade, similar to the fastest growing parts of the
country around Auckland and Waikato.
Figure 4.2: Study Area Household Projections (by Impact and Growth Scenario)
Growth 2016-43
2016 2023 2033 2043
n % avg. ann
High Impact (Low Growth)
Levin 8,300 8,300 8,000 7,500 - 800 -0.4%
Rest of Horowhenua 5,100 5,100 4,800 4,300 - 800 -0.6%
HDC Total 13,400 13,400 12,800 11,800 - 1,600 -0.5%
Manawatu and PNth 48,000 49,100 49,900 49,400 1,400 0.1%
Lower NI East 36,900 37,900 37,900 36,600 - 300 0.0%
Lower NI West 154,200 157,900 159,700 157,000 2,800 0.1%
Medium Impact (and Growth)
Levin 8,400 8,700 8,700 8,400 - 0.0%
Rest of Horowhenua 5,100 5,300 5,200 4,900 - 200 -0.1%
HDC Total 13,500 14,000 13,900 13,300 - 200 -0.1%
Manawatu and PNth 48,700 51,500 54,800 57,100 8,400 0.6%
Lower NI East 37,500 39,700 41,500 42,200 4,700 0.4%
Lower NI West 156,600 166,000 176,600 183,900 27,300 0.6%
Low Impact (High Growth)
Levin 8,500 9,000 9,500 9,700 1,200 0.5%
Rest of Horowhenua 5,200 5,400 5,700 5,700 500 0.3%
HDC Total 13,700 14,400 15,200 15,400 1,700 0.4%
Manawatu and PNth 49,400 53,900 60,100 65,800 16,400 1.1%
Lower NI East 38,000 41,500 45,600 48,900 10,900 0.9%
Lower NI West 158,700 173,800 193,900 211,900 53,200 1.1%
Very Low Impact (NZIER Growth)
Levin 8,500 9,700 11,400 13,200 4,700 1.6%
Rest of Horowhenua 5,200 5,900 6,800 7,500 2,300 1.4%
HDC Total 13,700 15,600 18,200 20,700 7,000 1.5%
Manawatu and PNth 49,400 53,900 60,100 65,800 16,400 1.1%
Lower NI East 38,000 41,500 45,600 48,900 10,900 0.9%
Lower NI West 158,700 173,800 193,900 211,900 53,200 1.1%
Source: Statistics NZ (Low, Medium and High Impact scenarios) and derived from NZIER (Very Low Impact)
20Note that the projections are based on underlying projections which diverge from 2013, and
so even though 2016 is the base year for this assessment, different estimates for that 2016
base are provided, consistent with the differences in the underlying projections.
Figure 4.3: Horowhenua District Household Projections
50,000
45,000
40,000
35,000
30,000
25,000
20,000
15,000 Low SNZ
Medium SNZ
10,000 High SNZ
NZIER
5,000
0
2013 2016 2018 2023 2028 2033 2038 2043
4.3 Levin town centre composition
The Levin town centre has developed along SH1 (Oxford St), centred around the intersection
with Queen St. Development to the eastern side of Oxford St is constrained by the railway,
with only a small aggregation of commercial businesses to the east of the railway,
concentrated in a node around the Oxford/Cambridge roundabout. West of the railway
development extends along streets intersecting Oxford St, although in most cases only one or
two blocks deep.
The town centre has a broad range of activities, and in that respect is relatively typical of New
Zealand towns of a similar size. Some of the notable components of the town centre include:
Large format retailers: New World and Countdown supermarkets, The Warehouse and
Farmers department stores, Warehouse stationery, Mitre 10,
National chain retail brands: Avantiplus, Ballentynes, Beds R Us, Carpet Court, Noel
Leeming, OPD, Paper Plus, Repco, Supercheap Auto, T&T, Unichem, Vodafone,
National chain fast food outlets: Subway, Burger King, Dominos, Pizza Hut,
McDonalds, Noodle Canteen,
21 Community services: Horowhenua District Council’s offices, and Te Takere
(Horowhenua’s community centre and main library),
Household and professional services: banks, hairdressers, real estate, legal,
accounting, medical, travel agents etc.
Levin is the main retail and commercial node in Horowhenua District, and within Levin the
town centre is the dominant location. Most of the retail and services sectors have the Levin
town centre as their predominant location within Horowhenua, and overall 64% of that
activity (by employment) is located in the town centre, including:
68% of District food and liquor,
85% of comparison retail,
51% of hospitality,
50% of automotive,
62% of household services, and
78% of professional services.
There are nearly 2,000 people employed in the town centre employment. Just over half (930)
are engaged in some sort of service activity (household, professional, community or
recreation) while 840 employees work in retail and hospitality (Figure 4.4). There is an
estimated 72,000m2 of ground floor floorspace (Gross Floor Area, or GFA) in the town centre,
with the largest amounts in the department stores (within comparison retail) and the
supermarkets (in the food and liquor retail sector). Of that 72,200m2 GFA around 3,800m2 is
estimated to currently be vacant (5% by area, 11% by tenancy count).
Figure 4.4: Levin Town Centre Business Demography
Share of Share of
Sector Businesses Employment Floorspace
Employment Floorspace
Food & Liquor Retail 7 307 17% 10,200 14%
Comparison Retail 52 288 16% 24,000 33%
Hospitality 24 245 14% 10,600 15%
Automotive 9 70 4% 4,900 7%
Out of centre retail - - 0% 2,300 3%
Household Services 26 131 7% 7,800 11%
Community Services 15 457 26% 8,000 11%
Recreation Services 5 21 1% 600 1%
Professional Services 80 250 14% 3,700 5%
Centres-Type Sectors 218 1,769 100% 72,100 100%
Other 74 226
Total 292 1,995
* Businesses are Geographic Units, employment is MECs, floorspace is ground floor GFA (sqm)
224.4 Levin town centre customer origins
Overall 62% of the sales made in the Levin town centre are made to Levin residents, and 18%
are made to people living elsewhere in Horowhenua, so 80% of sales are made to locals (and
20% to non-locals). Food and grocery spending is most dominated by local consumers (86%
of food and grocery sales), while locals contribute 77% of the Other Retail category. Non-
local spend is more reliant on non-local consumers, with 72% of the category’s ssales made
to lcoals, and 28% ot non-locals (Figure 4.5). That distribution reflects both the localised
nature of food and grocery (predominantly supermarket) spend, and the greater influence
that traffic passing through on SH1 has on hospitality (and to a lesser extent other retail).
Figure 4.5: Levin town centre customer origins by storetype
Manawatu and Elsewhere
PNth 7%
3%
Lower NI West
9%
Lower NI East
1%
Rest of
Horowhenua Levin
18% 62%
TOTAL RETAIL
In addition to the 80% of local spend in the town centre, a further 13% of town centre sales
are made to non-local customers who have Levin as their destination. This destination spend
is defined as all spend made by non-locals on trips where there are no transactions recorded
beyond Levin, relative to the customer’s origin (as described in section 3.4). This destination
spend is defined so as to include non-locals visiting holiday homes (e.g. at Waitarere, Foxton
and Himatangi beaches), staying in commercial accommodation or with friends and family,
and day trip spend, although the reasons for destination spend are not identifiable from the
data.
23You can also read