Greater Manchester Local Economic Assessment: Summary & Conclusions - Association of Greater Manchester Authorities
←
→
Page content transcription
If your browser does not render page correctly, please read the page content below
Greater Manchester
Local Economic
Assessment:
Summary &
Conclusions

A report for

Association of Greater Manchester Authorities

Submitted
28 January 2011 (FINAL)

Dr Alexander Roy
Head of Economic Analysis
CONTENTS

 FOREWORD ............................................................................................................3
 1 INTRODUCTION...............................................................................................4
 2 THE CONTINUING IMPACTS OF THE RECESSION – AN UNCERTAIN
    RECOVERY .....................................................................................................5
 3 GREATER MANCHESTER...............................................................................6
 4 SERVICE-LED GROWTH .................................................................................9
 5 THE IMPACT OF THE RECESSION & FORECAST FUTURE GROWTH .....17
 6 PEOPLE ..........................................................................................................20
 7 PLACE.............................................................................................................26
 8 CONCLUSIONS AND IMPLICATIONS FOR FUTURE GROWTH..................32

Manchester’s Commission for the New Economy                                                                      02
FOREWORD It is now nearly two years since the groundbreaking Manchester Independent Economic Review (MIER) was published, the largest and most ambitious review of a conurbation’s economy ever undertaken in the UK. This Local Economic Assessment updates our intelligence on and understanding of the Greater Manchester economy gathered during the MIER and subsequently turned into the Greater Manchester Strategy. The Local Economic Assessment is not in itself a strategic document, but its findings reinforce the dual emphasis within the Greater Manchester Strategy upon boosting productivity so that the growth rate increases, whilst ensuring that all parts of the conurbation and all its people enjoy improved opportunities as a result of a stronger economy. The Local Economic Assessment, produced by New Economy in partnership with the ten local authorities of Greater Manchester – Bolton, Bury, Manchester, Oldham, Rochdale, Salford, Stockport, Tameside, Trafford, and Wigan – continues Greater Manchester’s long tradition of partnership working through the Association of Greater Manchester Authorities (AGMA). This partnership working is now moving to another level with the establishment of the Greater Manchester Combined Authority and Local Enterprise Partnership. These new tools will help Greater Manchester’s partners continue the strong growth of the largest functional economic area outside London and in rebalancing the economy towards private sector-led growth in those areas where the public sector has been an important employer. This is an exciting time for Greater Manchester and the Local Economic Assessment provides an up-to-date evidence base to inform these evolving initiatives. Mike Emmerich Chief Executive, New Economy Manchester’s Commission for the New Economy 03
1 INTRODUCTION
1.1      The ten local authorities of Greater Manchester – Bolton, Bury, Manchester,
         Oldham, Rochdale, Salford, Stockport, Tameside, Trafford, and Wigan –
         working in partnership through the Association of Greater Manchester
         Authorities (AGMA), represent the largest functional economic area outside
         London, with a population of 2.6 million and gross value added (GVA) of
         £46 billion. Working together with New Economy, the ten authorities have
         produced a single economic assessment of Greater Manchester to understand
         the priorities and challenges for the conurbation’s economy, and to provide a
         sound foundation for the new Greater Manchester Combined Authority and
         Local Enterprise Partnership (LEP).
1.2      This is not new territory for Greater Manchester: in 2009, the Manchester
         Independent Economic Review (MIER) was published, the largest and most
         ambitious review of a conurbation’s economy ever undertaken in the UK. This
         found that Greater Manchester was the best-placed conurbation outside
         London to increase its long-term growth rate, and therefore critical to raising
         overall economic growth in the North and the UK as a whole. However, the
         MIER also concluded that Greater Manchester does not perform as strongly
         as it should, with productivity and skills below the levels that would be
         expected for a conurbation of its size. Following-on from the findings and
         recommendations of the MIER, we produced the Greater Manchester Strategy
         (GMS), which was a forward-looking vision that set strategic priorities that
         Greater Manchester needed to invest in much more heavily to realise its
         potential and create a more prosperous conurbation.
1.3      This economic assessment revisits the findings of the MIER and GMS by
         considering the further impacts of the recession since they were published; the
         implications of new Government policy; and in particular developing in more
         detail the specific role played by each of Greater Manchester’s local
         authorities and the challenges they face in rebalancing the economy towards
         private sector-led growth.

 Manchester’s Commission for the New Economy                                       04
2 THE CONTINUING IMPACTS OF
THE RECESSION – AN
UNCERTAIN RECOVERY
2.1 The financial crisis that first erupted in the US sub-prime mortgage market in
2007 triggered the worst global recession since the 1930s. A sharp contraction
in global growth in 2009 was accompanied by steep rises in unemployment.
The UK economy was particularly hard hit during the recession, with output
falling 4.9 % during 2009, compared to a fall of 3.3 % in the OECD as a whole.
Whilst early assumptions were that this would be a ‘white collar’ recession
amongst financial and professional services in the South, in reality it has
followed the pattern of previous recessions and disproportionately affected the
North of England and manufacturing.
2.2 Whilst there has been clear economic recovery during 2010, uncertainty exists
over the extent to which the global recovery will be fully sustained. The Euro
area (Greater Manchester’s biggest export market) has weakened as
concerns grow over a number of EU countries’ performances, and the Federal
Reserve has also warned of an uncertain recovery in the USA.
2.3 Oxford Economics, authors of the Greater Manchester Forecasting Model
(GMFM), predict that nervousness over the global economy, fears over the
pace of public expenditure cuts, and the VAT increase will curtail growth to a
modest 1.7 % this year and 2.2 % in 2011, below the Office for Budget
Responsibilities’ expectation of 2.3 %.
2.4 The labour market looks extremely challenging, with peak levels of
employment achieved in 2008 not forecast to return until 2015, and job levels
only expected to begin to rise in 2012 as the private sector recovery gathers
pace.
2.5 Key to economic recovery are the fortunes of the private sector, with public
sector cuts likely to have a severe impact. Though the relatively weak
exchange rate supporting UK exports should provide some boost to the
private sector.
2.6 However, continued uncertainty over global growth prospects, feeding into
underlying worries about how the domestic economy will weather tighter fiscal
policy, suggest that the risks to economic growth stalling in the UK remain
high.
Manchester’s Commission for the New Economy 053 GREATER MANCHESTER
3.1 Greater Manchester is the UK’s largest city in both population and economic
terms after the capital, London. Following strong growth over the past decade,
the conurbation generated around £46 billion per annum of total GVA, almost
a fifth of the total economic output of the North of England, and created over
90,000 additional jobs (1998–2008).1 Within the conurbation, GM South has
been the only part of the UK to deliver growth rates matching those in London
and the Greater Southeast over the past decade, as shown in Figure 1.
3.2 Greater Manchester has also performed strongly in a European context, being
within the top 20 % largest economies (by GVA) in the European Union, with
GVA growth over the last decade behind only Dublin, Helsinki (both capital
cities) and Barcelona of selected benchmark cities.2
3.3 The MIER highlighted how Greater Manchester benefits from agglomeration
economies that have created a critical mass of skilled, knowledge-based jobs.
The conurbation has an extensive transport infrastructure that puts 5.2 million
people within an hour’s commute of the conurbation core.3 As the MIER
showed, Greater Manchester has the largest travel-to-work area (TTWA) of
any conurbation in the UK outside London, drawing in commuters from across
the historic counties of Cheshire and Lancashire plus the Peak District and
parts of Yorkshire, particularly at higher skills levels.
3.4 As a result of this growth in economic opportunity, Greater Manchester has
reversed a long-term trend of population decline. During the 1980s, Greater
Manchester had the fastest population decline in the UK, reflecting the
socioeconomic deprivation, a lack of economic opportunities in the
conurbation and large-scale industrial closures. By the early 1990s, the
northern districts of the conurbation were experiencing steady population
growth, and the overall population of Greater Manchester has been growing
since 2002, driven in particular by the sharp growth of the City of Manchester’s
population and the boom in city living in the conurbation core.
1
Office for National Statistics (ONS) (2009) Regional sub-regional and local gross value added,
http://www.statistics.gov.uk/pdfdir/gva1209.pdf
2
Eurostat 2010 data presented in Chapter 1
3
MIDAS data from www.investinmanchester.com
Manchester’s Commission for the New Economy 06Figure 1. UK Gross Value Added by NUTS3 Areas, 2007 (current prices) Change, 1997–2007 (current prices)
Source: ONS (2009) Regional, Sub-regional and Local Gross Value Added
Manchester’s Commission for the New Economy 073.5 The experience of the last decade has shown that Greater Manchester has an
economic influence that extends far beyond its administrative boundaries,
such that the conurbation has not only been the main driver for economic
growth in the North of England, but is also a significant contributor to overall
UK prosperity.
3.6 Since the MIER, Greater Manchester has developed the Greater Manchester
Strategy (GMS) to tackle the fact that, despite strong growth, the conurbation
suffers from a ‘productivity gap’ against other dynamic modern conurbations.
The MIER estimated that a quarter of this underperformance is caused by low
levels of economic activity in the conurbation, and three quarters is caused by
low productivity, the result of a weak skills base, together with relatively low
levels of enterprise and internationalisation in comparison with its peer cities.4
4
Sebnem Oguz and Jonathan Knight (2010). ‘Regional economic indicators’. Economic & Labour Market Review,
Vol. 4, No 2, February 2010
Manchester’s Commission for the New Economy 084 SERVICE-LED GROWTH
4.1 Greater Manchester’s economic growth has been driven by the large-scale
and rapid expansion of the service sector, particularly financial & professional
services. This sector accounts for a sixth of employment, a fifth of GVA and
businesses, and contributed 45 % of all GVA growth across Greater
Manchester over the decade prior to the recession, rising even higher in the
conurbation core, making the conurbation a centre for financial & professional
services of national, not just regional significance, as shown in Figures 2 & 3.
4.2 Although smaller in size and specialisation, Greater Manchester has also
developed its creative & digital industries to the stage where they represent
the UK’s biggest centre for the industries outside the Greater Southeast. This
specialisation is forecast to increase over the coming decade as MediaCity
and other assets develop and agglomeration economies increase.
4.3 The size, strength and importance of Greater Manchester’s universities mean
that Higher Education is another key service specialism for the conurbation,
though the changing funding environment facing the sector presents
significant challenges, but also some opportunities, over the coming decade.
4.4 Greater Manchester’s history means the conurbation still retains strengths in
manufacturing and logistics. Manufacturing as a whole has seen employment
decline by more than a third over the last decade, as manufacturers have
become more capital intensive and concentrated upon related activities, such
as design and after-sales services. This issue is explored further in a specific
study on Advanced Manufacturing in Greater Manchester conducted as part of
this Local Economic Assessment. Nevertheless, Greater Manchester retains
above average employment in its historically strong manufacturing sectors of
textiles and food & drink. Although much smaller employers in absolute terms,
Greater Manchester’s specialisation in logistics, and especially aviation, due to
the scale and importance of Manchester Airport, endures.
4.5 Construction is another large sector and employment specialism for Greater
Manchester, which has grown by a third over the last decade. Whilst the
sector has been hard hit by the recession, it is forecast to return to growth by
2012 and, if so, will make a strong contribution to employment growth over the
remainder of the coming decade.
4.6 Health and retail are the second and third largest employment sectors in
Greater Manchester, which is in line with national trends. Although the majority
of health employment and growth is within the public sector, the specialist and
high-value biotechnology and life sciences sub-sectors have also seen strong
growth. Whilst these are currently small in employment terms, they are highly
productive, with the highest GVA per employee of any sector in Greater
Manchester. The conurbation has particular niche strengths and a
concentration of assets along The Corridor Manchester around Manchester’s
Universities and main Hospitals, and these are forecast to deliver additional
high-value employment for the conurbation over the coming decade.
Manchester’s Commission for the New Economy 09Figure 2. Greater Manchester Sectors by Size & Employment Growth, 1998–2008
CONSTRUCTION: EDUCATION: 8.5 %
7.0 % (+33.0 %) (+2.9 %) HIGHER EDU: 1.9 % (-11.4 %)
HOSPITALITY
& TOURISM: TEXTILES: 0.8 % (-67.2 %)
6.1 %
(+14.3 %) FOOD AND
DRINK: 1.8 %
1 (-29.2 %)
PUBLIC
ADMIN: 5.2 % MANUFACTURING:
(+1.6 %) 10.3% (-37.6%)
CREATIVE:
4.7 %
(+1.9 %) SPORT: 1.2 %
(+44.7 %)
AVIATION: 1.3 % RETAIL: 10.3 %
(+14.2 %) (-3.5 %)
LOGISTICS:
4.1 % (+2.0 %)
AUTOMOTIVE:
2.0 % (-21.2 %)
ENGINEERING: ICT DIGITAL:
3.8 % (-36.0 %) 3.0 % (+2.0 %)
HEALTH: 13.0 %
(+26.0 %) BIOTECHNOLOGY: 0.1 %
(+10.6 %)
FINANCIAL AND PROFESSIONAL
SERVICES: 16.6% (+36.5%)
NON-HEALTH RELATED
LIFE SCIENCES: 0.8 %
(+18.4 %)
FINANCIAL SERVICES:
4.3 % (+17.3 %)
Source: ONS (2010) Annual Business Inquiry
KEY
High Growth Growth High Decline Decline
(>10 %, 98-08) (-10 %, 98-08) (Figure 3. Greater Manchester Employment Specialisation by Key Sub-Sectors against Great Britain, 2008
3.50
3.00
COMPARATIVE
ADVANTAGE VS. GB
QUOTIENT OF EMPLOYMENT, 1.00 = AVERA
2.50
COMPARATIVE
ADVANTAGE VS. GB EXC.
GREATER SOUTHEAST
2.00
1.50
1.00
0.50
0.00
S
S
N
M
G
G
N
H
ES
.
Y
)
L
K
S
IE
N
CE
S
VE
IN
Y
IO
L
LL
IN
L
T
H
IS
IN
N
O
C
A
G
IN
E
IA
IO
C
G
TI
R
R
LT
C
O
M
TE
TI
R
IT
AT
R
LO
R
IL
TI
(A
VI
TI
R
O
R
C
ST
EA
N
TI
AT
AD
TU
U
EE
C
IG
EA
XT
O
E
IS
D
R
AN
P
IE
C
O
G
L
TO
IA
U
U
R
EN
M
S
SE
C
D
U
G
TA
&
C
C
IN
N
TR
IN
TE
H
C
D
AV
N
U
TO
ED
FA
LO
H
S
T
LI
D
&
IN
G
R
FI
N
ED
AL
IC
NS
C
O
E
B
TU
EN
E
AU
Y
U
TE
ER
E
IF
FO
PU
N
M
IT
AN
O
V
C
IO
L
N
AL
O
H
C
TI
FA
M
O
BI
SS
IG
EA
IT
IR
NU
RE
H
SP
FE
R
V
O
EN
C
A
O
O
M
C
PR
H
GM vs. Great Britain average GM vs. GB average excluding GSE GB average
Source: ONS (2010) Annual Business Inquiry
Manchester’s Commission for the New Economy 0114.7 Whilst Greater Manchester, like the UK as a whole, has seen significant
growth in public sector employment over the last five years, this contributed
less than 30 % of the conurbation’s employment growth over the period. This
is in marked contrast to some other UK cities that have been heavily
dependent upon public sector employment growth. However, within the
conurbation there is a mixed picture, with four of the districts in GM North and
Tameside (in GM South) actually seeing private sector employment
contracting, in contrast to strong private sector growth elsewhere in the
conurbation, particularly GM South excluding Tameside, as shown in Figure 5.
4.8 The reasons for the differences between the districts are mixed – Bury and
Rochdale have suffered from weak overall employment growth, whereas
Wigan has seen reasonable growth but driven by the public sector. Oldham
and Tameside have seen declines in private sector employment and have
relied upon the public sector for new jobs.
4.9 However, public sector employment across Greater Manchester as a whole is
in line with the national average, and the conurbation is the least dependent
major UK city on public sector employment outside of London and Bristol, as
shown in Figure 4.
Figure 4. Public Sector Employment Rate in UK Conurbations, 2008
28.0
26.0 26.3%
% WORKING-AGE POPULATION
24.0
22.0
GB AVERAGE 20.4%
20.0 21.2% 21.2% 20.5%
19.7%
18.0
16.0 16.7%
14.0
12.0
10.0
AM
N
L
R
S
W
TO
ED
O
TE
O
H
D
SG
IS
ES
LE
G
N
BR
LO
IN
LA
H
M
C
G
AN
R
BI
M
R
TE
EA
R
G
Source: ONS (2010) Sub-Regional, Public and Private Sector Estimates
Manchester’s Commission for the New Economy 012Figure 5. Private & Public Sector Job Creation, 2003 to 2008
14.00
12.00
PERCENTAGE EMPLOYMENT CHANGE, 2003 TO 2008
10.00
8.00
6.00
4.00
2.00
0.00
rd
N
rd
le
L
M
r
de
m
r
an
n
DS
r th
ry
W
h
t
te
te
or
TO
lto
DO
ut
fo
da
HA
ha
lfo
Bu
O
i
es
ig
es
No
kp
es
E
af
So
Bo
SG
IS
Sa
ch
W
ld
LE
ch
G
N
ch
-2.00
oc
Tr
m
O
BR
M
LO
Ro
IN
M
Ta
an
LA
an
St
G
G
M
M
M
G
R
er
BI
at
-4.00 re
G
PRIVATE SECTOR PUBLIC SECTOR
DRIVEN GROWTH DRIVEN GROWTH
-6.00
PRIVATE SECTOR PUBLIC SECTOR
Source: ONS (2010) Sub-Regional, Public and Private Sector Estimates
Manchester’s Commission for the New Economy 0134.10 There is also a significant divergence in Greater Manchester between the
location of public sector jobs and where public sector workers actually live, as
shown in Figure 6. For example, Trafford has a very low proportion of
workplace jobs within the public sector but the highest proportion of public
sector workers amongst its own residents, suggesting high levels of
commuting to public sector jobs outside the district. Similar, though less
extreme, scenarios appear to exists in Stockport and Wigan.
Figure 6. GM Public Sector Workplace and Residence-based Employment
40.0
35.0
GM RESIDENT
AVERAGE
PERCENTAGE EMPLOYMEN
30.0
GM WORKPLACE
25.0
AVERAGE
20.0
15.0
10.0
E
RT
RD
N
R
AN
M
RD
E
RY
AL
O
TE
ID
HA
O
BU
FO
IG
O
LT
ES
D
KP
ES
LF
LD
W
CH
BO
AF
M
CO
SA
CH
O
TA
RO
TR
AN
ST
M
WORKPLACE BASED RESIDENCE BASED GM AVERAGE WORKPLACE GM AVERAGE RESIDENT
2008 2010
Source: ONS (2010) Sub-Regional, Public and Private Sector Estimates
4.11 There are also marked differences in terms of the types of public sector
employment across Greater Manchester, as illustrated in Figure 7. Bury has a
particularly high relative proportion of employment in health and social care.
Manchester has the largest relative proportions of employment in public
administration – reflecting its position as a centre for regional and national as
well as local public administrative functions – and education, almost half of
which is due to higher education.
Manchester’s Commission for the New Economy 014Figure 7. Public Sector Employment in Greater Manchester’s Local Authorities, by Sub
Sector, 2008
1.80
1.60
1.40
LOCATION QUOTIENT (AGAINST GB)
1.20
GB AVERAGE
1.00
0.80
0.60
0.40
0.20
0.00
Y
AM
E
D
D
N
R
E
T
AN
R
R
AL
ID
R
R
O
TE
O
BU
IG
O
FO
H
LT
ES
D
ES
KP
LF
LD
W
H
BO
AF
M
C
H
SA
C
O
TA
O
C
TR
O
AN
R
ST
M
PUBLIC ADMINISTRATION AND DEFENCE; COMPULSORY SOCIAL SECURITY
EDUCATION
HEALTH AND SOCIAL WORK
Source: ONS, Sub-Regional Public and Private Sector Estimates, 2010
4.12 Whilst the overall size and structure of an economy’s business base has clear
implications for growth, recent research by NESTA found that just 6 % of
companies accounted for over half of new jobs created within the UK economy
between 2002 and 2008.5
4.13 Separate research undertaken by Business Link NW, provides an analysis of
high-growth firms across the conurbation. These high-growth firms – or
‘gazelles’ – are defined by high employment or profitability growth over a
number of years (a stricter definition than the one employed by NESTA). The
analysis finds that there are over 2,500 such high-growth firms across Greater
Manchester – representing over 40 % of the Northwest’s high-growth firms, by
far the largest proportion within the region. Furthermore, these firms represent
1.82 % of Greater Manchester’s business base, a higher proportion of the total
business base than in regional comparators.6 Whilst most of these firms
(88 %) are small businesses, employing between 10 and 49 people, they
employ 94,500 people across Greater Manchester – approximately 8.5 % of
the total workforce.
4.14 And whilst these high-growth firms inevitably reflect current economic
strengths, with absolute concentrations in the southern districts of Manchester,
Trafford, Stockport and Salford, and within the financial & professional
services sector, other patterns are also apparent. As a proportion of the
5
NESTA (October 2009), The Vital 6 per cent: How high-growth innovative businesses generate prosperity and jobs,
http://www.nesta.org.uk/library/documents/Vital-six-per-cent-Nov2010-v3.pdf
6
Data produced by Business Link NW from Experian databases
Manchester’s Commission for the New Economy 015business base, both Rochdale and Wigan have an above average presence of
‘gazelles’, as illustrated in Figure 8, boding well for future growth. The sectoral
breakdown of these high-growth firms is also extremely diverse, with a sixth in
manufacturing, and construction (13 %), hospitality & tourism (9 %), logistics
(6 %) and health (5 %) also having significant numbers of high-growth firms.
Figure 8. Percentage of High-growth Businesses within GM districts, 2009
2.50% 2.42%
2.02% 2.02% 1.99%
2.00% 1.90%
HIGH-GROWTH AS PERCENTAGE OF BUSINESS BA
GM AVERAGE 1.82%
1.67% 1.63%
NW AVERAGE 1.73%
1.48%
1.50%
1.28% 1.26%
1.00%
0.50%
0.00%
R
T
E
D
E
D
N
M
N
Y
R
TE
AL
R
R
ID
O
R
A
A
O
O
FO
U
IG
LT
H
S
D
ES
P
FF
B
LD
E
H
W
K
O
AL
M
C
H
C
A
B
O
TA
C
TO
O
TR
S
N
R
A
S
M
Source: Business Link NW (2010)
4.15 Despite strong numbers of high-growth firms, however, the remainder of the
Greater Manchester economy suffers from relatively low levels of new start-
ups, weak business density, and poor business survival rates. It is for these
reasons that closing the ‘enterprise gap’ that exists in Greater Manchester in
comparison with the UK’s most dynamic cities, such as Bristol, has been taken
forward as a key priority of the Greater Manchester Strategy.7
4.16 The MIER found that Greater Manchester has had a successful experience of
international and indigenous inward investment in recent decades – with
investment creating employment (especially skilled employment) without
crowding out the investment of domestic firms, as has likely been the case in
some parts of the UK.8
4.17 This strong performance has been maintained in the conurbation even during
the recession, with the latest available data from Greater Manchester’s inward
investment agency MIDAS showing an increase in successful inward
investment projects over the last three years, particularly in advanced
engineering/manufacturing, highlighting the continued potential of this sector
for the conurbation.
7
Prosperity for all: The Greater Manchester Strategy (GMS) – August 2009,
http://neweconomymanchester.com/stories/842-greater_manchester_strategy
8
MIER Inward and Indigenous Investment, p50, http://www.manchester-review.org.uk/projects/view/?id=721
Manchester’s Commission for the New Economy 0165 THE IMPACT OF THE
RECESSION & FORECAST
FUTURE GROWTH
5.1 After a decade of growth, Greater Manchester was hit hard by the recession,
with GMFM estimating the conurbation will have lost 34,100 jobs and £1.5bn.
of GVA between 2008 and 2010. However, these declines are slightly less
than for the UK as a whole, and GMFM forecasts that Greater Manchester will
match UK growth rates in the medium term. This means that Greater
Manchester will maintain its relative advantage, although GMFM forecasts that
the productivity gap is unlikely to change significantly over the forecast period
up to 2020, even with faster employment growth.
5.2 The positive forecast for Greater Manchester is a result of the sectoral pattern
of the recession, which is showing a particularly severe impact on the
industrial and construction sectors, whereas the sectors with key
concentrations in the conurbation, particularly professional services, have a
stronger outlook in GMFM’s medium-term forecasts. This is based upon the
assumption that professional services’ exports continue to expand rapidly as
they have done in the recent past, and that some of the activities of the public
sector will move into the private sector as the spending cuts are implemented.
5.3 The resilience of the private service sector is an important factor in this
forecast as the public sector cuts filter through. Those areas more reliant upon
the public sector will be more severely impacted by the squeeze. According to
GMFM, 11,800 jobs will be lost in the public sector between 2010 and 2015,
as shown in Figure 9. While the private sector is forecast to lose jobs between
2010 and 2012, by 2015 GMFM forecasts the conurbation will benefit from
faster employment growth than the national average, leading to a quicker
recovery from public sector job losses.
Manchester’s Commission for the New Economy 017Figure 9. Forecast Public & Private Sector Growth, GM and UK, 2009–20
115
110
105
GM Public
GM Private
UK Public
UK Private
100
95
90
2009 2010 2011 2012 2013 2014 2015 2016 2017 2018 2019 2020
Source: Oxford Economics (2010) GMFM
5.4 However, these sectoral patterns have also seen the recession hitting parts of
Greater Manchester harder than others, as shown in Figure 10. Manchester,
Salford, Stockport and Bury have seen lower falls in output9 and employment
than the rest of the conurbation, whilst the impact has been harder upon the
remaining GM North districts and Tameside, but also Trafford.
Table 10. GVA and Employment Impact of Recession, 2008–09
9
GVA EMPLOYMENT
RECESSION RECESSION
PERCENTAGE PERCENTAGE
2008 TO 2009 2008 TO 2009
2008 to 2009 2008 to 2009
THOUSANDS THOUSANDS
BOLTON -157.6 -4.3 % -2.2 -1.8 %
BURY -98.5 -4.2 % -0.9 -1.2 %
MANCHESTER -510.4 -3.8 % -4.3 -1.3 %
OLDHAM -124.3 -4.8 % -2.2 -2.5 %
ROCHDALE -179.4 -6.4 % -2.8 -3.3 %
SALFORD -170.5 -3.9 % -1.6 -1.3 %
STOCKPORT -161.0 -3.1 % -0.8 -0.5 %
TAMESIDE -123.3 -4.7 % -2.2 -2.7 %
TRAFFORD -294.0 -5.6 % -4.2 -3.1 %
WIGAN -171.5 -4.6 % -2.7 -2.4 %
GREATER MANCHESTER -1990.6 -4.3 % -23.9 -1.8 %
Source: Oxford Economics (2010) GMFM
9
It should be noted that official GVA statistics are not available at local authority level, with GMFM providing
estimates derived from GM North and GM South GVA data. Employment data by contrast is derived from official ABI
statistics at local authority level and therefore is more reliable.
Manchester’s Commission for the New Economy 0185.5 This differential impact is also forecast to leave a very different legacy across Greater Manchester, as shown in Figure 11. The districts
hit least by the recession – Manchester, Stockport, Salford and Bury – are expected to experience relatively short contractions, with
returns to pre-recession GVA and employment within the next two years and peak employment within the next 2–4 years. For
Manchester and Salford, this is due to their economic strength as a result of the size and scale of the conurbation core. For Stockport
and particularly Bury, because many of their residents work in the conurbation core, the comparatively low impact of the recession is
partly because local spending has not declined as sharply as elsewhere, though also reflects their relatively smaller economies.
Trafford’s forecast is partly distorted by an earlier spike in employment, which will take longer to regain, and discounting this employment
spike suggests that Trafford’s prospects for recovery are similar to those in Manchester, Bury, Salford and Stockport.
5.6 Bolton saw employment peak in 2003, but as a result is forecast to return to this level by 2014. By contrast, the other GM North districts
and Tameside are not forecast by GMFM to return to their previous peak employment for 18 years or more.
Figure 11. Forecast Peak-to-Peak Employment (workplace-based), GM 2000–32
MANCHESTER
BURY
SALFORD
STOCKPORT
BOLTON
TRAFFORD
WIGAN
ROCHDALE
TAMESIDE
OLDHAM
2002 2003 2004 2005 2006 2007 2008 2009 2010 2011 2012 2013 2014 2015 2016 2017 2018 2019 2020 2021 2022 2023 2024 2025 2026 2027 2028 2029 2030 2031 2032
Source: Oxford Economics (2010) GMFM
Manchester’s Commission for the New Economy 0196 PEOPLE
6.1 The recent growth in Greater Manchester’s population has seen it overtake
Birmingham as the UK’s second city behind London, with a population of
nearly 2.6 million, 4.2 % of the UK population. Of these, 62.9 % are of working
age, giving Greater Manchester the largest resident labour market outside
London, of 1.6 million people.
6.2 GMFM forecasts population to continue growing over the next decade,
particularly within Manchester, Salford, and Trafford, where double-digit
growth is forecast. Natural increase (i.e. births greater than deaths) continues
to be the primary factor driving this population growth. However, uncertainty
remains regarding how migration will react to the recession and sluggish
labour market recovery. There has thus far been less out-migration as a result
of the recession than originally anticipated, and as a result the population
forecast has been revised upwards, but if economic growth is worse than
forecast and/or migration returns to past trends, then this may prove to be too
optimistic.
6.3 Greater Manchester has seen strong growth in employment since 1998. This
dropped significantly in 2008 as a result of the recession, although the impact
upon Greater Manchester has been slightly less than the UK as a whole, and
by matching UK growth rates in the medium term it is forecast by GMFM to
maintain its relative advantage.
6.4 Nevertheless, the recovery of Greater Manchester’s labour market is forecast
to be slower than that for economic output, with employment levels only
expected to begin to rise in 2012 as the private sector recovery gathers pace.
The forecasts suggest that employment will not recover its recession job
losses until 2014 at the earliest, and the longer-term rate of employment
growth is slower than that of the recent boom.
6.5 As a result, unemployment in Greater Manchester is forecast to be 20,000
higher in the decade ahead than it was in 2008, remaining above 65,000 over
the medium term, at a level similar to the late 1990s. This reflects the longer-
term legacy of the recession and the sectoral nature of the recovery – driven
by business & professional services – with the unemployed, particularly those
with lower skills, struggling to return to work as recovery is expected to be
driven by higher skilled activities.
6.6 The impact of unemployment is not felt equally across the conurbation, with
Manchester, Salford and Rochdale suffering particularly high levels. More
locally, benefit claimants are largely clustered in and around the central urban
core and the main towns of Greater Manchester, with the lowest rates found in
the affluent suburban areas and rural hinterland of the conurbation, as shown
in Figure 12.
Manchester’s Commission for the New Economy 020Figure 12. Total Benefit Claimant Rate, Greater Manchester May 2010
Source: DWP (2010) Longitudinal Survey
NOTE: Total benefit claimants references all benefits supplied by DWP, including JSA, IB/ESA, income
support, carer’s allowance etc. It does not include claimants of tax credits, which are administered by
HMRC.
6.7 This legacy of unemployment from the recession will exacerbate existing
weaknesses in the labour market around worklessness10 and skills. The
employment rate in Greater Manchester is only 68.9 % of the working-age
population, giving the conurbation the highest worklessness rate amongst its
comparator cities, apart from Birmingham, and significantly higher than the
national average. Despite the economic strength of the conurbation core,
worklessness is particularly acute in Manchester, as shown in Figure 13,
reaching two-fifths of the working-age population, with only Stockport, Wigan
and Trafford having rates below the national average.
6.8 Although worklessness has risen over the past four years because of the near
doubling of unemployment, the biggest contributor to worklessness remains
economic inactivity, affecting nearly a quarter of the working-age population.
Whilst there are positive reasons for some residents to be economically
inactive – such as studying (with students comprising 4.8 % of Greater
Manchester’s inactive population) and early retirees – for many others
inactivity is due to a lack of employment opportunities and/or ill health. For
example, long-term sickness results in inactivity for 8.5 % of Greater
Manchester residents wanting to work, one percentage point higher than the
national average.
10
Worklessness is defined by the Office of National Statistics as the total population that is either unemployed or
economically inactive. The unemployed “are people who are without a job, want a job, have actively sought work in
the last four weeks and are available to start work in the next two weeks or are out of work, have found a job and are
waiting to start it in the next two weeks”. The economically inactive are ‘those without a job who have not actively
sought work in the last four weeks, and/or are not available to start work in the next two weeks” (ONS (December
2009) A Profile of Worklessness).
Manchester’s Commission for the New Economy 021Figure 13. Workless residents in Greater Manchester, June 2010
45.0%
40.0%
PROPORTION OF WORKING AGE (%)
35.0%
30.0%
25.0% 32.9%
27.8%
26.4% 27.9%
20.0% 25.6%
22.6% 22.7% 24.1% 24.7%
15.0% 20.0%
10.0%
5.0% 8.8% 8.7% 7.7% 7.4% 6.9% 6.7% 6.1% 6.1% 5.9% 5.3%
0.0%
T
R
AM
Y
E
N
D
E
D
AN
R
ID
AL
R
TE
O
R
R
O
BU
O
O
IG
H
LT
ES
D
ES
KP
LD
LF
F
W
H
BO
AF
M
H
C
SA
C
O
TA
C
O
TR
O
AN
R
ST
M
UNEMPLOYMENT ECONOMIC INACTIVITY
Source: Calculations by New Economy from ONS (2009) Annual Population Survey
6.9 Given the high levels of worklessness in Greater Manchester, the
Government’s plans to merge all out-of-work benefits into a single Work
Programme will have a big impact upon the conurbation. In particular, nearly
half (48 %) of benefits in Greater Manchester go on Employment Support
Allowance (ESA – the replacement for Incapacity Benefit), which was subject
to significant cuts in the recent Spending Review.
6.10 Worklessness is especially acute amongst Greater Manchester’s black &
minority ethnic (BME) community, with unemployment (16.8 %) and economic
inactivity rates (37.7 %) nearly double that of white residents and much higher
than the national average. Levels of worklessness are higher for females than
males, particularly due to economic inactivity, but these gaps increase further
within the BME community, particularly the Pakistani/Bangladeshi group,
where females make up 86 % of the difference between white and BME
inactivity rates.
6.11 The key determinant of worklessness however is low or inappropriate skills.
Across the UK, residents with no or lower-level qualifications are more likely to
be workless than those with Level 3 or 4+ qualifications,11 as shown in Figure
14. This pattern is even stronger in Greater Manchester than nationally, with
nearly 20 % more workless residents having no qualifications than the national
average, and above levels in Bristol, Leeds and London. Moreover, just
12.0 % of economically inactive residents have level 4+ skills (compared to
29.3 % of economically active residents). A lack of skills is particularly
associated with residents not participating in the labour market, with nearly a
11
Level 3 qualifications are equivalent to A-Levels, whilst Level 4+ are equivalent to degrees and higher postgraduate
qualifications.
Manchester’s Commission for the New Economy 022third of economically inactive residents having no qualifications, compared to
just over a fifth of unemployed residents.
6.12 Greater Manchester’s weak skills base is not confined to the workless
population, however, with fewer Greater Manchester residents than the
national average qualified to Level 4+ and more residents holding no
qualifications, even when just looking at residents in employment. Across
Greater Manchester, only Trafford and Stockport have more residents than the
national average with Level 4+ qualifications.
Figure 14. Skills Breakdown by Employment, 2009
GM UK
INDICATOR
NUMBER PERCENT NUMBER PERCENT
LEVEL 4+ 450,200 26.7 % 11,835,600 29.8 %
ALL RESIDENTS
LEVEL 3 317,350 18.8 % 7,298,610 18.4 %
LEVEL 2 361,825 21.4 % 8,394,410 21.1 %
LEVEL 1 316,125 18.7 % 7,232,880 18.2 %
NO QUALS 243,000 14.4 % 5,012,400 12.6 %
LEVEL 4+ 395,400 31.4 % 10,329,900 33.9 %
ECONOMICALLY
RESIDENTS
LEVEL 3 249,830 19.9 % 5,813,600 19.1 %
ACTIVE
LEVEL 2 278,805 22.2 % 6,438,475 21.1 %
LEVEL 1 221,165 17.6 % 5,377,625 17.7 %
NO QUALS 112,000 8.9 % 2,493,900 8.2 %
LEVEL 4+ 374,900 33.1 % 9,891,600 35.2 %
EMPLOYED
RESIDENT
LEVEL 3 228,400 20.2 % 5,410,410 19.3 %
LEVEL 2 245,750 21.7 % 5,870,935 20.9 %
LEVEL 1 189,050 16.7 % 4,795,155 17.1 %
NO QUALS 93,400 8.3 % 2,117,800 7.5 %
LEVEL 4+ 20,500 16.3 % 438,300 18.5 %
UNEMPLOYED
RESIDENTS
LEVEL 3 21,430 17.0 % 403,190 17.0 %
LEVEL 2 33,055 26.3 % 567,540 24.0 %
LEVEL 1 32,115 25.5 % 582,470 24.6 %
NO QUALS 18,600 14.8 % 376,100 15.9 %
LEVEL 4+ 54,800 12.7 % 1,505,700 16.2 %
ECONOMICALLY
RESIDENTS
LEVEL 3 67,520 15.7 % 1,485,010 15.9 %
INACTIVE
LEVEL 2 83,020 19.3 % 1,955,935 21.0 %
LEVEL 1 94,960 22.0 % 1,855,255 19.9 %
NO QUALS 131,000 30.4 % 2,518,500 27.0 %
Source: Calculations by New Economy from ONS (2009) Annual Population Survey
6.13 Whilst the MIER found that the smaller proportion of higher-level skills has not
prevented businesses within the conurbation accessing the higher-level skills
they need, this has largely been achieved by importing skills from Greater
Manchester’s neighbouring authorities. As Figure 15 shows, many of the
conurbation’s neighbouring authorities are able to offer significantly higher
proportions of graduates than the majority of Greater Manchester.
Manchester’s Commission for the New Economy 023Figure 15. Level 4+ Qualifications in Greater Manchester and Environs, June 2010
Source: Annual Population Survey, 2010
6.14 Whilst this has facilitated strong economic growth for Greater Manchester, it
has not reduced worklessness amongst residents. Reducing this skills gap will
not only give residents better access to the labour market, but will also create
the basis upon which other new areas of growth can develop elsewhere in the
conurbation.
6.15 As the MIER argued, improving the skills of the conurbation is a long-term
process that must lay foundations from the early years if it is to be successful.
Nonetheless, there are clear signs of improvement, with substantial
improvements in GCSE attainment in the conurbation, far outstretching
national increases, such that Greater Manchester now has a higher GCSE
attainment rate (five GCSEs at grades A*–C) than the national average,
though still remains slightly behind when Mathematics and English are
included.
6.16 However, progression rates onto higher-level qualifications remain lower in
Greater Manchester than national averages – 73.9 % of 19 year olds have
obtained a level 2 qualification in Greater Manchester, compared to 75.9 %
nationally, whilst 45.7 % have achieved a level 3 qualification, compared to
49.4 % nationally. This advancement must also be improved if the resident
labour market is to deliver the higher-level skills that are needed to support
economic recovery and the long-term competitiveness of the conurbation.
6.17 Greater Manchester’s weak skills base is at the heart of the productivity gap
identified by the MIER. Weak skills are the key cause of Greater Manchester’s
low productivity rate.12 Weak skills are also a key component of economic
12
Sebnem Oguz and Jonathan Knight (2010). ‘Regional economic indicators’. Economic & Labour Market Review,
Vol. 4, No 2
Manchester’s Commission for the New Economy 024inactivity – which the MIER identified as the other major contributor to the
productivity gap – since low activity rates reduce the available workforce,
constrain output levels, and reinforce concentrations of deprivation. As such,
breaking out of this low skills trap – and providing the residential offer
necessary to retained skilled workers within Greater Manchester – is essential
if the productivity gap is to be closed and all residents are to realise the
benefits of economic growth.
6.18 Despite the overall economic success of Greater Manchester, significant
proportions of its residents still suffer from socioeconomic deprivation levels
that are amongst the worst in the UK. Although the latest Index of Multiple
Deprivation (IMD2007) shows noticeable improvement since 2004, over 30 %
of Lower Super Output Areas (LSOAs) in Greater Manchester are within the
worst 10 % nationally. As Figure 16 shows, whilst every district has some
areas of deprivation, it tends to cluster in inner city areas around the
conurbation core and the main town centres. Deprivation is particularly acute
in the Manchester, Salford, Rochdale and Oldham, with 19 LSOAs within the
worst 100 nationally – an LSOA in Harpurhey, Manchester is ranked second
most deprived in the country. The absolute extent of deprivation is strongly
focused around the conurbation core, with nearly two-thirds of Manchester’s
LSOAs and over two-fifths of Salford’s in the 10 % most deprived nationally.
The overall extent of deprivation is significantly lower in Trafford, Stockport
and Bury than the rest of the conurbation, with less than half the number of
deprived LSOAs than the next most deprived districts.
Figure 16. Most Deprived Neighbourhoods, Greater Manchester 2007
Source: CLG (2007) Index of Multiple Deprivation
Manchester’s Commission for the New Economy 0257 PLACE
7.1 As with any large metropolitan area, different parts of the conurbation
contribute to the functional geography in different ways. The conurbation core
is the focus of economic restructuring and growth, offering the largest office
market outside London and an environment that is attractive to financial &
professional services, with the connectivity and infrastructure to attract the
skilled labour needed by these sectors from across Greater Manchester and
beyond. The conurbation core extends from city centre of Manchester into
Salford Central, and onto the adjacent development of Salford Quays/Trafford
Wharfside – which has a mixed office, industrial and logistics offer, and
includes MediacityUK, with a specific focus upon the creative & digital
industries. The conurbation core also extends out along Oxford Road, where
the Corridor Manchester comprises Europe’s largest concentration of
knowledge assets, including Universities, hospitals, and Manchester Science
Park. The conurbation core also includes two of the UK’s top ranked retail
offers in Manchester City Centre and, at the edge of Trafford Park, the Trafford
Centre.
7.2 The conurbation core has dominated take-up within Greater Manchester’s
office market and competes successfully on a national scale with Birmingham,
Bristol, Glasgow and Leeds. Office development elsewhere in the conurbation
has focused on out-of-town business parks, particularly to the south of the
conurbation, though Middlebrook (in Bolton) and Central Park (in New East
Manchester) have also enjoyed notable success. However, these out-of-town
developments have in some circumstances resulted in a loss of activity in
Greater Manchester’s town centres, which has exacerbated the overall poor
performance of these centres over the last decade in employment and retail
terms, despite high levels of economic growth.
7.3 The presence of Trafford Park between the conurbation core and the
motorway network even means that the broad core area of Greater
Manchester dominates the industrial market, with Trafford Park remaining the
most attractive location for industrial and logistics activities within the
conurbation. With distribution and warehousing requirements now dominating
the industrial sector, and with Greater Manchester’s market characterised by
average to poor quality stock and a shortage of large, modern, units (100,000+
sq ft), Heywood Distribution Park and Kingsway in Rochdale to the north,
along with Ashton Moss in Tameside to the east, have also been successful
attracting logistics occupiers.
Manchester’s Commission for the New Economy 026Figure 17. Net Commuting Flows within Greater Manchester, 2008 Please note: this is a graphical representation of selected larger net travel-to-work flows and not all travel-to-work flows are depicted here. Source: ONS (2010) Annual Population Survey Manchester’s Commission for the New Economy 027
7.4      Analysis of official travel-to-work area (TTWA) data (of all flows of 1 % or
         more, from ONS’ 2008 Annual Population Survey) supports the idea that the
         10 Greater Manchester districts represent a natural economic geography, with
         every district having higher commuting flows to other Greater Manchester
         districts than flows out of the conurbation. And whilst there are strong linkages
         with the neighbouring authorities, these are rightly considered as separate
         economic geographies, with greater degrees of internal retention and
         movements to areas outside Greater Manchester than into the conurbation.
7.5      Within Greater Manchester itself:
             •     The City of Manchester is the main importer of labour and the primary
                   destination for all other districts in the conurbation – though this
                   connection is weaker with Bolton and Wigan, the only two Greater
                   Manchester districts that do not border Manchester

             •     All Greater Manchester districts have more flows to the rest of the
                   conurbation than to districts outside Greater Manchester

             •     Manchester, Salford and Trafford are the most connected districts, with
                   labour flows with all other Greater Manchester districts

             •     Across Greater Manchester there is a general pattern in the TTWA of
                   each district of strong interconnectivity with its 2–3 neighbouring
                   districts plus Manchester
7.6      Taken together, Manchester and Salford form the economic core and driver of
         the conurbation, around which the rest of Greater Manchester coalesces.
         Around this core, all of Greater Manchester’s districts provide flows of labour,
         but these are particularly strong from Trafford, Stockport and Bury, where
         skills levels are highest, and which also offer an attractive housing stock and
         high-quality transport connections. Trafford and Stockport have an
         interdependent relationship with the conurbation core, since they also have
         their own strong economies. Trafford Park in particular, extending from the
         Trafford Centre through to Trafford Wharfside, is the largest and most
         important employment area in Greater Manchester outside the city centre.
         Stockport’s town centre is also a large mixed-use employment centre that has
         begun to regenerate following an early period of decline. Bury has recently
         seen large investment in its town centre, which has reinvigorated the district’s
         economy, but overall Bury has a smaller local economy, with lower
         employment growth over the last decade, all of which has come from the
         public sector, leaving the district with a more dependent relationship upon the
         conurbation core.13
7.7      Bolton and Wigan, in the northwest of Greater Manchester, are relatively more
         independent from the conurbation core, with relatively lower commuting flows
         into the Cities of Manchester and Salford (though still higher than to areas

13
 Northern Way (2009) City Relationships: Economic Linkages in Northern city regions –
Manchester City Region

 Manchester’s Commission for the New Economy                                            028
outside Greater Manchester). Bolton’s town centre benefits from a scale and
diversity of functions that provide critical mass, which is complemented by
continued strength in manufacturing and logistics activities. However, over the
last decade, Bolton has seen minimal employment growth, and exclusively
from the public sector, suggesting that economic restructuring is still
underway, and that Bolton currently remains reliant upon the conurbation core
for new employment opportunities. Wigan, partly because its coalmining
heritage meant that it was forced as pits were closed to undergo a sudden,
rather than more gradual economic restructuring, meaning it could not
continue to rely on traditional sources of employment and had to look to new
economic activities. As a result, the borough has some of the strongest
business indicators in GM North, with private sector employment growth, and
a strong presence of high-growth firms. However, overall the Wigan economy
lacks scale and critical mass, and suffers from poor connectivity into the
conurbation core. Wigan also has the strongest links to districts outside
Greater Manchester, particularly St Helens, though it remains more reliant
upon the conurbation core than areas outside Greater Manchester for new
employment opportunities.
7.8 Rochdale, Oldham and Tameside to the northeast of Greater Manchester
have a dependent relationship with the conurbation core. These areas have a
legacy of traditional manufacturing that is continuing to restructure, leaving a
relatively weak economic base that has been badly hit by the recession.
However, these areas also lack the resident skills to take full advantage of
opportunities within the conurbation core. Moreover, the living preferences of
those in the highest level occupations (see Figure 18 below) shows that large
areas of these districts have housing stock, connectivity, and amenity that is
not currently able to attract and retain significant numbers of skilled residents.
However, these areas all benefit from some significant assets, particularly in
terms of their location on the edge of the Peak District, good rail connections,
and the forthcoming expansion of Metrolink, that will significantly improve the
connectivity and offer that these areas have as a location of choice for skilled
residents.
7.9 A comprehensive multimodal transport network interconnects the conurbation
and provides national and international linkages, supporting both the
movement of skills and the flow of goods. The conurbation has an orbital
motorway, sits on the West Coast Main Line, trans-Pennine motorway and
railway linkages underpinning the North European Trade Axis running from the
Mersey to the Humber ports, the largest heavy rail network outside of London,
and the UK’s largest light rail system in Metrolink. These light and heavy rail
links have been instrumental in facilitating the flow of skills into the
conurbation core to drive economic growth, and the current and planned
expansion of this network will further improve the connectivity of Greater
Manchester residents to economic opportunities.
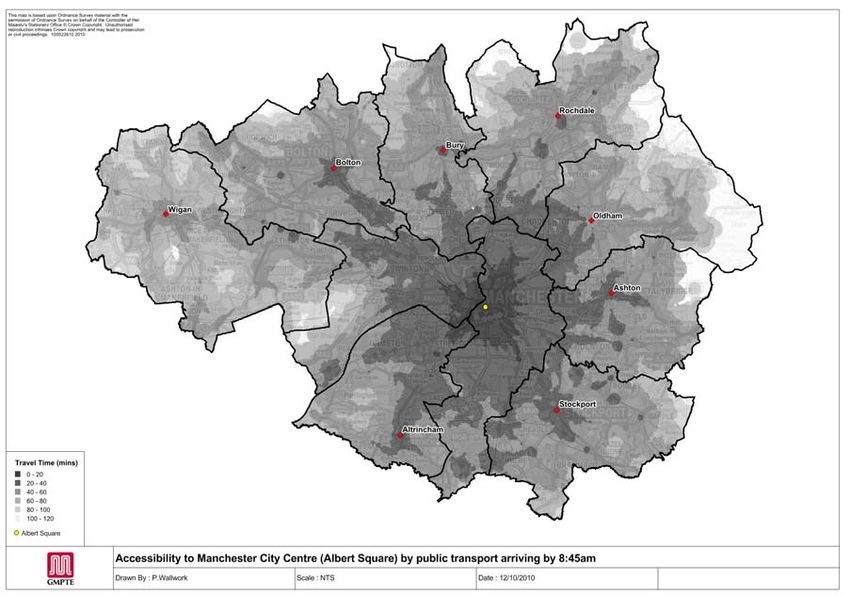
Manchester’s Commission for the New Economy 0297.10 Nevertheless, transport connectivity across Greater Manchester is uneven,
with Figure 18 clearly showing the variability in transport times using public
transport from different parts of the conurbation, influencing the levels of
commuting into the conurbation core.
Figure 18. Accessibility to Manchester City Centre by Public Transport
Source: Mapping by GMPTE (2010)
7.11 Manchester Airport is the major international gateway for the whole of the
North of England. The airport is by far the largest UK airport outside the
London airports carrying around nearly 19million passengers per annum to
190 destinations, including a substantial network of long-haul scheduled
services, and the only UK airport other than Heathrow to have two full-length
runways. The airport is also an important freight hub, with the World Freight
Terminal being the largest in the UK outside London. As such, Manchester
Airport is a strategic asset of national as well as North of England importance,
that helps to attract and retain international businesses and talent into the
conurbation.
7.12 Greater Manchester hosts a wealth of nationally and internationally significant
cultural, sporting and visitor infrastructure assets, including a number of new
iconic developments. The 2002 Commonwealth Games left a legacy of new
world-class sporting facilities, with SportCity the focus for new investment
around Manchester City, alongside existing assets such as Old Trafford cricket
and football grounds. Across the whole of Greater Manchester are a wide
range of sporting assets, museums, galleries, theatres, concert halls,
conference facilities and outdoor attractions, including the MEN Arena and
Manchester’s Commission for the New Economy 030keynote developments such as Urbis, The Lowry, and Imperial War Museum
North. Collectively these assets and the rapidly improving image of the
“Manchester” brand have seen the conurbation become England’s most
popular destination for overseas visitors after London.
7.13 The provision of a suitable housing supply is key to attracting and retaining
people in Greater Manchester to support economic growth. The Greater
Manchester Strategic Housing Market Assessment (SHMA) 2008 identified
key long-term issues including meeting the need for additional housing and a
better housing mix, which would support the growth of the area and bridging
the affordability gap.
7.14 The imbalances in Greater Manchester’s current housing market are well
illustrated by the living choices of those in the highest-level (managerial &
professional) occupations. As Figure 19 shows, these groups are
concentrated around the edge of the conurbation – which tends to offer a
more attractive living environment – and along major transport corridors,
particularly Metrolink, the West Coast Main Line, and the motorway network,
reflecting the important combination of good connectivity with an appealing
residential offer.
Figure 19. ACORN Categories in Greater Manchester by Output Area, 2010
Source: CACI, ACORN 2010
Manchester’s Commission for the New Economy 031You can also read