Sectoral Labour Market Effects of the 2006 FIFA World Cup
←
→
Page content transcription
If your browser does not render page correctly, please read the page content below
Arne Feddersen & Wolfgang Maennig

Sectoral Labour Market Effects of the 2006
FIFA World Cup

Abstract: Using the case of the 2006 FIFA World Cup, this study is the first to test the employment ef-
fects of a mega-sporting event on the basis of data that are both regional and sectoral. It is also the
first study of sporting events to use a non-parametric test method. Earlier studies on the World Cup
could not identify any employment effects. In contrast, we find a small but significant positive em-
ployment effect on the hospitality sector and a negative effect on the construction sector. To our
knowledge, this is the first time that such a crowding-out effect of public investment on the occasion of
a mega-sporting event has been found in an empirical analysis.
Keywords: FIFA, World Cup, Economic Impact, Ex-post Analysis, Sectoral Employment
JEL classification: H54; R12; L83
Version: February 2010

1 Introduction

“And the winner is … Deutschland!” On June 6th, 2000, these were the words of
FIFA President Joseph Blatter as he announced the host of the 2006 FIFA World
Cup. The related investment costs for new construction or major renovations to-
talled nearly €1.6 billion for the twelve stadiums (FIFA, 2006). An additional €1.6
billion was invested in stadium-related infrastructure in the host cities. In some
other cities that had unsuccessfully participated in a national competition, each
hoping to become a World Cup host city, another €515 million had been spent on
stadium construction.

Before the 2006 World Cup in Germany, a series of analyses was published indi-
cating that the investments related to staging the World Cup and the expendi-
tures of the expected one to two million foreign visitors would markedly affect
income and employment. The estimates fluctuated, indicating a €2 billion to €10
billion increase in income or up to 10,000 additional jobs (see e.g., DEUTSCHE
INDUSTRIE- UND HANDELSKAMMER, 2006; DEUTSCHE POSTBANK AG, 2005a,
2005b, 2006).
Sectoral Labour Market Effects of the 2006 FIFA World Cup                        2

The evidence from the few existing ex-post studies of the 2006 FIFA World Cup is
less optimistic. Using poll data, KURSCHEIDT, PREUß, & SCHÜTTE (2008) calcu-
lated World Cup-induced (substitution-adjusted) consumer spending of €3.2 bil-
lion. This seems to be an impressive figure at first glance, but if one compares it
to Germany's GDP in 2006, which totalled €2,325 billion, then there was only a
small income impact of 0.14%. Thus, it is not surprising that scholarly researchers
using aggregated macroeconomic time series hardly succeeded in identifying any
significant economic impact from the event. BRENKE & WAGNER (2007) and
MAENNIG (2007) found no significant impact of the World Cup on economic indi-
cators (e.g., GDP) at the country level. On such an aggregated level, any positive
impact of a mega-event would almost certainly be subsumed by normal fluctua-
tions in the economy and would, from a statistical point of view, disappear into
the noise. There are three studies that used more disaggregated data. HAGN &
MAENNIG (2009) analysed monthly unemployment data for the 75 largest urban
districts (“kreisfreie Städte”) in Germany, including the 12 World Cup venues.
Their focus is on the effects of staging the event. FEDDERSEN, GRÖTZINGER, &
MAENNIG (2009) examined whether the investment in stadiums and related in-
frastructure led to greater economic development in the host cities. Neither study
demonstrated any significant impact on regional economies. ALLMERS & MAEN-
NIG (2009), however, did identify some 700,000 additional overnight stays by
non-residents and €570 million in net national tourism income.

The general failure to identify tangible mesoeconomic or macroeconomic effects
does not mean that such events have no economic benefit. Potential intangible
effects like a “feel-good” effect and/or an improvement in the international repu-
tation of a country (ALLMERS & MAENNIG, 2009) must be acknowledged.

This paper takes up the argument that the impact of even a mega-event like the
FIFA World Cup, organised in a large economy, is too small to be measured with
aggregated data as was done previously. We consider reports from media com-
panies indicating that there were considerable increases in viewer ratings for the
World Cup (N.N. 2007a) and reports of increased turnover for manufacturers of
table-football equipment and for breweries. We use such reports to establish the
Sectoral Labour Market Effects of the 2006 FIFA World Cup                          3

economic hypothesis that any economic impact of a mega-sporting event might
be spatially and temporally localised and, thus, that more disaggregated data
must be analysed. The aim of this paper is to test economic impact on the basis of
regionally and sectorally differentiated employment figures.

The remainder of the paper is organised as follows: Section 2 gives a brief litera-
ture review, while Section 3 describes the data and the empirical strategy. Section
4 presents the econometric results and, finally, Section 5 presents the conclu-
sions.

2 Literature Review

Since the studies by BAADE (1987) and BAADE & DYE (1988, 1990), a growing
body of literature on the economic impact of professional sports franchises, facili-
ties, and mega-events on the (local) economy has developed. The results pre-
sented in this literature are strikingly consistent (COATES & HUMPHREYS, 2008).
No matter which geographical units (e.g., cities, counties, Metropolitan Statistical
Areas, states) are examined, no matter which model specifications, estimation
methods and dependent variables (e.g., employment, wages, taxable sales) are
used, and no matter which part of the world is under study (e.g., the USA, Europe)
scholarly analyses provide almost no evidence that professional franchises, sports
facilities, or mega-events have a measurable impact on the economy (COATES &
HUMPHREYS, 2008, p. 302).

To our knowledge, very few studies have found significant positive effects from
sports facilities and sports events ex post. BAIM (1994) found positive employ-
ment effects from MLB and NFL teams for 15 cities in the USA. HOTCHKISS,
MOORE, & ZOBAY (2003) found significant positive employment effects on re-
gions in Georgia (USA) that were affiliated with or close to the activities of the
1996 Atlanta Olympic Games, but they found no significant wage effects. BAADE
& MATHESON (2002) found that the 1996 Olympics had a much smaller impact.
JASMAND & MAENNIG (2008) found positive income effects for the German re-
gions that hosted the 1972 Olympic Games. TU (2005) found significant positive
Sectoral Labour Market Effects of the 2006 FIFA World Cup                                       4

effects from the FedEx Field (Washington) on real estate prices in the surrounding
neighbourhood, as did AHLFELDT & MAENNIG (2008) for three arenas in Berlin,
Germany. Finally, CARLINO & COULSON (2004) examined the 60 largest Metro-
politan Statistical Areas (MSA) in the USA and found that having a National Foot-
ball League (NFL) team allowed the cities to enjoy rents that were eight per cent
higher but not higher wages.1 Other studies, particularly those by COATES &
HUMPHREYS (1999, 2000, 2001, 2003a, 2003b) and TEIGLAND (1999), have even
indicated significant negative effects.

Among the studies that analyse mega-sporting events such as the Olympic
Games, the FIFA World Cup, or the Super Bowl (in contrast to other studies on the
effects of team sports or franchises), PORTER (1999), COATES & HUMPHREYS
(2002), BAADE, BAUMANN, & MATHESON (2008a), COATES (2006), and MATHE-
SON (2005) analysed the economic impact of the Super Bowl. The Olympic Games
have been examined by BAADE & MATHESON (2002), HOTCHKISS, MOORE, & ZO-
BAY (2003), BAADE, BAUMANN, & MATHESON (2008b), and LEEDS (2008).
MATHESON (2006) and COATES & HUMPHREYS (2008) provide an overview.

Only a few scholarly studies have analysed the economic impact of the FIFA World
Cup. SZYMANSKI (2002) collected data on the twenty largest economies meas-
ured by current GDP over the last thirty years. Many of these countries have
hosted the Olympic Games or the World Cup at least once in the past 30 years.
Using a simple regression, he concluded that the growth of these countries was
                                           2
significantly lower during World Cup years. STERKEN (2006) found that World
Cups have a positive effect but that this effect is quite limited. HAGN & MAENNIG
(2008) showed that the 1974 World Cup, which was held in Germany, did not
generate significant short- or long-term employment effects in that country.
BAADE & MATHESON (2004) showed that, caused by the 1994 World Cup in the

1
    In a comment, COATES, HUMPHREYS, & ZIMBALIST (2006) showed that these results are not
    robust, for example, to the exclusion of extreme outliers. However, see also the reply to this
    comment by CARLINO & COULSON (2006).
2
    No significant effects at all were registered for the Olympic Games.
Sectoral Labour Market Effects of the 2006 FIFA World Cup 5 USA, nine of the 13 host cities suffered decreased growth. Overall, the 13 loca- tions suffered losses of over US$9 billion. According to BAADE (1996), it would seem that long-term employment related to mega-sporting events is likely to be part-time, casual, low-skilled, and low-wage, thus not leading to an increase in full- time jobs. KAVETSOS & SZYMANSKI (2009) suggest that the construction phase may generate some employment. In an ex-post analysis, FEDDERSEN, GRÖTZINGER, & MAENNIG (2009) and HAGN & MAENNIG (2009) showed that the 2006 FIFA World Cup had no short-term employment effects. The majority of studies thus only find insignificant or even negative effects from sports franchises, stadiums, and mega-events. After categorising the literature according to the degree of data disaggregation, one important methodological challenge should be discussed. First, one might ask what would have happened if the (public) money involved had been used for an alternative investment. Second, one might ask whether the observed impact is really caused by the treatment or whether one is really only detecting a coincidental macroeconomic shock. In the sports impact field, two main bodies of literature have been established to deal with these issues. Considering the first kind of counterfactual, amongst others, BAADE & MATHESON (2001), COATES & HUMPHREYS (2002) and MATHESON (2005) used panel data to compare predicted and observed values of economic indicators. Employing a growth model, for example, these studies used as a coun- terfactual the predicted economic growth for the treatment time using past de- velopment, which was then compared to the observed growth rate. The second body of impact analyses, including studies by FEDDERSEN, GRÖTZINGER, & MAENNIG (2009), HAGN & MAENNIG (2008, 2009), HOTCHKISS, MOORE, & ZO- BAY (2003), and JASMAND & MAENNIG (2008), uses Difference-in-Difference (DD) approaches to isolate the impact of sports stadiums and events from pure macro- economic shocks using additional geographic units as a control group. Here, de- velopment in host regions is compared to that in other regions. Both approaches depend on the assumption that a stable relationship between the predicted counterfactual and the true (not observable) counterfactual exists. However, even if this assumption does not apply completely, these approaches are preferable
Sectoral Labour Market Effects of the 2006 FIFA World Cup                        6

because the bias in ignoring counterfactuals altogether is definitely stronger than
if the predicted counterfactual is not matched exactly.

The research design of the present study is based on an extended and flexible DD
approach using employment data for Germany. This study is the first to analyse a
sporting event outside the USA using regionalised and sectoralised data.

3 Empirical Strategy

3.1 Data

Quarterly data on employment for each county in Germany were obtained from
the Federal Labour Agency (“Bundesagentur für Arbeit”). The data used are based
on place of employment rather than place of residence. The Federal Labour
Agency provides employment figures at the “Landkreise und kreisfreie Städte”
level, which is the NUTS3 level in Germany and is comparable to the county-level
in the USA. Furthermore, quarterly employment figures are provided for 60 dif-
ferent industries. On this spatially and temporally disaggregated level, data are
available from the second quarter of 1999 to the fourth quarter of 2008. Thus, the
observation period consists of 38 quarters.

No data are available for some quarters and counties either because there were
no people employed in the specific industry or because the data are subject to
disclosure restrictions. Because continuous data are required for the DD analysis,
only counties without any missing data were included in the empirical analysis.
Additionally, due to some rare changes in county definitions, a few corrections
were necessary. For example, a reformation of counties and county boundaries
occurred in the federal state of Saxony in 2001. To guarantee continuous se-
quences, data for the old county definitions were applied to the new definitions.
In the case of a change of boundary, the affected employment figures were
Sectoral Labour Market Effects of the 2006 FIFA World Cup 7
summed to the lowest common spatial denominator even if this resulted in the
“loss” of some geographical units.3
From the available 60 industries, eight were selected for analysis. The industries
were chosen based on how plausible it was that they might be strongly affected
by a mega-sporting event. The selected industry classifications are: Publishing,
Communications Engineering, Construction, Wholesale Trade, Retail Trade, Hos-
pitality, Land Transportation, and Culture, Sports, and Entertainment.
As the data used in this study are reported with quarterly frequency, they must be
corrected for seasonal effects. The seasonally adjusted data were calculated using
a quarterly dummy variable regression (BAUM, 2006, pp. 174-176; WOOLDRIDGE,
2009, p. 269). After conducting these regressions, the predicted residuals were
taken as a seasonally adjusted time series.
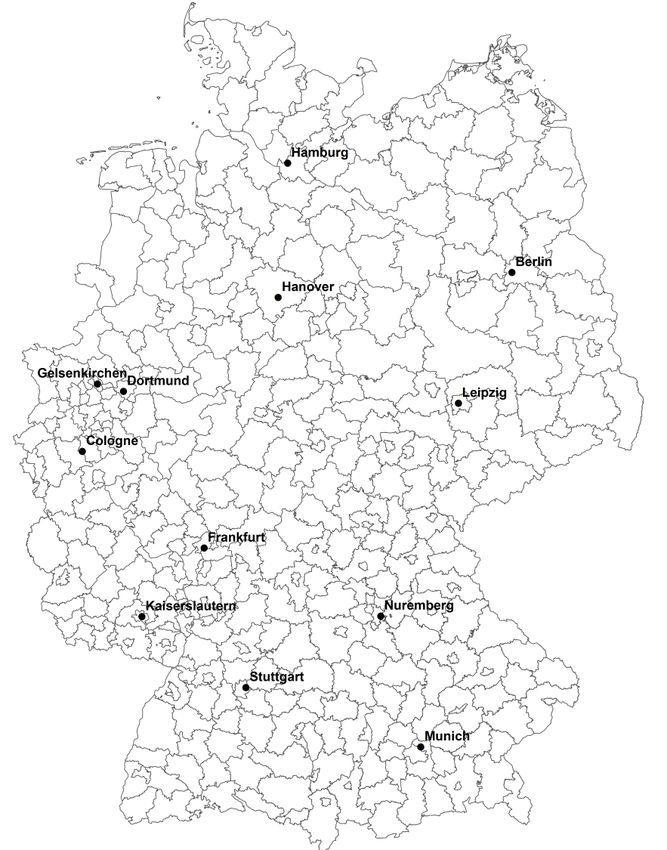
Figure 1 indicates the geographical dimensions of German counties and the re-
spective locations of World Cup venues. Figure 2(a) shows the development of
overall seasonally adjusted employment in Germany, indexed to 1 in 1999Q2 (the
first available data point), separately for a) the group of venue counties and b) the
control group, which consisted of the remaining counties in Germany. Figure 2(b)
depicts the difference between the group averages (difference-in-mean).4 The
data were averaged among the groups for every quarter and then normalised to
the starting value in 1999Q2. The two groups showed fairly similar relative devel-
opment, although the venue group seemed to perform better until early 2002. No
visual evidence regarding the employment effect of the 2006 FIFA World Cup can
be drawn. There is no short-term employment peak in the treatment group se-
quence. Also, no long-term effect can be identified based on visual inspection. No
3
Due to boundary changes in the course of the county re-divisions in the federal state of Saxony-
Anhalt on July 1st, 2007, six counties had to be merged into two superordinate geographical
units. Thus, the counties of “Dessau-Roßlau”, “Anhalt-Bitterfeld”, “Jerichower Land”, and “Wit-
tenberg” were merged into “Region 1”, and the counties of “Harz” and “Salzlandkreis” were
combined into “Region 2”.
4
Here, a smoothed trend line is included to represent a locally weighted regression (lowess).Sectoral Labour Market Effects of the 2006 FIFA World Cup 8
obvious shift can be seen either after the staging of the World Cup or after the
announcement of Germany as the host country.
Fig. 1 Venues of the 2006 FIFA World Cup
Notes: World Cup venues were geo-referenced according to their street addresses and marked
by black dots. The regional units correspond to German counties according to their defi-
nition on December 31st, 2008 or to their lowest common spatial denominator.Sectoral Labour Market Effects of the 2006 FIFA World Cup 9
Fig. 2 Development of Seasonally Adjusted Employment (All Industries)
1.06
Relative Seasonally Adjusted Employment
World Cup Venues
1.04
1.02
1.00
(a)
0.98
Control Group
0.96
00 01 02 03 04 05 06 07 08
Year
Difference in Mean of Seasonally Adjusted Employment
0.04
0.03
0.02
(b)
0.01
0.00
99 00 01 02 03 04 05 06 07 08 09
Year
400,000
Absolut Seasonally Adjusted Employment
World Cup Venues
300,000
200,000
(c)
100,000
Control Group
0
99 00 01 02 03 04 05 06 07 08 09
Year
Notes: Quarterly employment was seasonally adjusted using a dummy variable regression.
Employment figures are arithmetic means for both groups. The vertical line marks the
quarter in which the 2006 FIFA World Cup was staged, i.e., 2006Q2.Sectoral Labour Market Effects of the 2006 FIFA World Cup 10
3.2 Econometric Model
The aim of this paper is to examine the effect of the 2006 FIFA World Cup on sec-
toral employment in Germany. Difference-in-difference analysis (BERTRAND,
DUFLO, & MULLAINATHAN, 2004) or regression discontinuity designs (IMBENS &
LEMIEUX, 2008) are established approaches for the identification of treatment
effects that occur at particular locations after a specific intervention. Common to
both approaches is that one must compare the differences in outcome before and
after an intervention for groups affected by the intervention to the difference for
unaffected groups. Such analysis works best if the shock can be modelled discre-
tionarily both with respect to location (treatment vs. control) and with respect to
time (before and after the shock).
For our analysis, we employed a method introduced by DACHIS, DURANTON, &
TURNER (2010, pp. 9-13) in another research context. Let t denote time, with t =
2006Q2 as the intervention point, t < 2006Q2 before the staging of the World
Cup, and t > 2006Q2 afterwards. Let i denote county-equivalent regional units
(“Landkreise und kreisfreie Städte”). Then, two indicators based on time dimension
t and spatial dimension i can be defined:
1 if 2006 2
(1)
0 else
1 if
(2)
0 else
changes from zero to one for the quarter when the World Cup was held, and
is one if a county belongs to the treatment group . Here, the vector is com-
prised of the counties of the 12 World Cup venues (Berlin, Cologne, Dortmund,
Frankfurt, Gelsenkirchen, Hamburg, Hannover, Kaiserslautern, Leipzig, Munich,
Nuremberg, and Stuttgart).
Let , denote total employment at a particular location and time. Then, ac-
cording to DACHIS, DURANTON, & TURNER (2010), this function can be decom-
posed into five parts: (1) the function , , a latent employment surface that is
continuous in i and t; (2) a jump in the employment surface that occurs in the
quarter when the World Cup began: ; (3) a jump in the employment surfaceSectoral Labour Market Effects of the 2006 FIFA World Cup 11
that takes place in the venue counties only: ; (4) an interaction effect for the
former jumps: ; (5) a mean zero error term.
Based on this notation, employment at location i and time t can be written as fol-
lows:
, , , (3)
Using the case of , 0,0 , one can demonstrate how this strategy identifies
the treatment effect of the 2006 FIFA World Cup. Here, all the variation in re-
sults from the discontinuities created by and .
, 0,0 , (4)
Equation (4) is similar to the regression equation used by HOTCHKISS, MOORE, &
ZOBAY (2003) in analysing the 1996 Olympic Games. Apparently, two main prob-
lems arise in estimating equation (4). First, the assumption that is constant with
respect to i and t seems to be restrictive, and it might be correct only for a small
region around 0,0 . If a larger variation in the surface , should be analysed,
then variation in the latent employment surface can no longer be ignored. Conse-
quently, equation (4) must be re-formulated as:
, 0,0 , (5)
The difference between the two equations is that, in equation (5), the variation in
the latent employment surface is assigned to , . Consequently, the error term is
, , , 0,0 . Assigning the variation to the error term is somewhat
problematic if , is correlated with either of the two indicators, or . Thus, to
obtain unbiased estimates, the following constraints must hold:
, , 0 and , , 0. (6)
Figure 2 shows that both the venue county group and the control group exhibited
comparable employment trends. This suggests a positive correlation between
and , . Furthermore, the bottom panel of Figure 2 shows a large difference be-
tween the employment levels of the venue county group and the control group.
This observation leads to the suggestion that a positive correlation betweenSectoral Labour Market Effects of the 2006 FIFA World Cup 12
and , exists. As is obvious and was also pointed out by DACHIS, DURANTON, &
TURNER (2010, p. 12), correlations between the two indicator variables ( , )
and the error term could bias estimates of , , and, most importantly, . To ad-
dress this problem, county fixed effects and time fixed effects were included in
equation (3).
, ∑ , , (7)
where denotes a dummy variable for each single regional unit, i.e., county fixed
effects, and is defined as a set of dummy variables for each quarter from
1999Q2 to 2008Q4 (i.e., time fixed effects). DACHIS, DURANTON, & TURNER
(2010, p. 12) use the Taylor series expansion of to explain how the specification
of equation (4) helps to resolve problems caused by unobserved variation in the
employment surface.
0,0 3 (8)
In equation (4), the county fixed effects ( ) non-parametrically capture the pro-
portion of variation in the employment surface that is solely attributable to re-
gion . Hence,
∑ , (9)
!
where k is the order of the Taylor series expansion. Analogously, the time fixed
effect (∑ ) controls non-parametrically for all variation that depends solely on
time , and hence,
∑ . (10)
!
Therefore, in equation (4), the error term , consists purely of noise and terms
involving both and or, formally, , 3 , , . Thus, 3 ,
denotes third- and higher-order terms in the Taylor series expansion that involve
both and .
Even if county fixed effects and time fixed effects capture all the variation that is
purely attributable to temporal and spatial variation, estimates of equation (4)Sectoral Labour Market Effects of the 2006 FIFA World Cup 13
may be biased. In particular, if there are different employment trends for the
venue counties and non-venue counties, confounded estimates of the impact of
the World Cup might result if these trends are correlated with the indicator vari-
ables. To obtain unbiased estimates of using equation (4), the following con-
straint must hold:
, , 0. (11)
A glance at the middle panel of Figure 2 suggests that, in fact, condition (8) does
not hold for the data used. It is obvious that the two groups show different
growth rates, such that divergence in the development of employment figures
can be observed. To resolve this problem, spatially differentiated linear trends
were considered. Accordingly, the augmented estimation equation that includes
group-specific trends can be written as
, ∑ , . (12)
Here, is a trend for the treatment group consisting of the World Cup venue
counties.
3.3 Identifying the Treatment Group
A common problem with all empirical analyses of a treatment, no matter
whether they use Difference-in-Difference (DD) or Regression Discontinuity De-
sign (RDD), is the exact definition of this treatment with respect to several inher-
ent dimensions. It is rare that the analysed intervention is completely exogenous
and can be distinguished clearly based on those dimensions. In the case of the
2006 FIFA World Cup, the treatment must be defined with regard to two dimen-
sions: time and space.
Regarding the time dimension, the start of the treatment effect might be gradual
because the intended (infrastructural) measures were introduced step by step, or
it might be preceded by a kind of anticipation effect. Analogously, the duration of
the effect might not be derived from theoretical considerations. Additionally,
from a spatial point of view, the treatment might generate spillover effects for
adjacent geographical units.Sectoral Labour Market Effects of the 2006 FIFA World Cup 14
Our empirical strategy takes these factors into account. With respect to the time
dimension of the treatment, the intervention function was modelled in several
ways.5 First, the intervention can be the result of a pure jump, i.e., a level shift oc-
curring within the treatment group right after the event, to be captured by an
effect as in equation (1). In this case, the estimation equation will be equation (4).
Secondly, because such a sustainable effect is truly not supported by the empiri-
cal sports economics literature, the treatment effect should also be modelled as
an impulse function, in which case it is assumed that the effect is only active dur-
ing the staging of the World Cup. Thus, the impulse intervention is defined as
1 if 2006 2
. (13)
0 else
Third and finally, the intervention should be modelled more flexibly to capture
adjustment and/or anticipation effects. Thus, the treatment effect can be identi-
fied non-parametrically for a period starting with the announcement of the host
of the 2006 World Cup (AHLFELDT, 2010).
, , (14)
Here, separate time dummies are made to interact with the respective treatment
group dummy. This specification allows the treatment effect to vary freely over
time.
Concerning the space dimension, surrounding areas might gain from the mega-
event due to (1) avoidance strategies, e.g., tourists staying in hotels in the sur-
rounding areas to avoid overcrowded and perhaps extremely expensive World
Cup venue regions; and (2) spillover effects, i.e., the positive effects originally oc-
curring in the main venue regions extending into surrounding regions. In this
case, the effect occurring at a host city is transmitted into space and is thereby
discounted according to the distance from the origin of the primary impact. Thus,
one would expect that the effect would decay with growing distance from the
5
See, for example, ENDERS (1995, p. 273) for different intervention functions.Sectoral Labour Market Effects of the 2006 FIFA World Cup 15
World Cup venue counties. Figure 3 plots the absolute employment difference
(top row) as well as the employment growth rate (bottom panel) and the distance
to the closest venue county. No decaying relationship between employment and
distance emerges, either for absolute employment differences or for employment
growth. The lack of relationship also holds with one-year differences and growth
rates instead of quarterly ones. World Cup spillover effects seem to have no im-
pact on employment in Germany.
Fig. 3 Absolute Employment Difference and Growth Rates for Counties in Ger-
many and Distance to the Closest World Cup Venue, 2005 and 2006
15000
8000
Difference in Employment (2006Q1 to 2006Q2)
Difference in Employment (2005Q2 to 2006Q2)
6000
10000
4000
5000
2000
0
0
-2000
-5000
0 50 100 150 200 0 50 100 150 200
Distance to Nearest Venue (km) Distance to Nearest Venue (km)
.04
.1
Growth Rate (2006Q1 to 2006Q2)
Growth Rate (2005Q2 to 2006Q2)
.02
.05
0
-.02
0
-.04
-.06
-.05
0 50 100 150 200 0 50 100 150 200
Distance to Nearest Venue (km) Distance to Nearest Venue (km)
Notes: Employment differences (first row) and growth rates (second row) are based on the
change from 2006Q1 to 2006Q2 (left column) and from 2005Q2 to 2006Q2 (right col-
umn). Dark grey dots represent the World Cup venue counties, whereas other German
counties are marked by light grey dots. The solid line is a lowess (smoothed) trend line
that is calculated based on the non-venue counties only.Sectoral Labour Market Effects of the 2006 FIFA World Cup 16 4 Results 4.1 Flexible Treatment First, the results for the most flexible approach according to equation (14) should be presented. This specification is characterised by interactions of the treatment group and time dummies. The results illustrated in Figure 4 show indices of the “treatment group”-“time dummy” interactives, i.e., the relative performance of the treatment group in a given month as revealed by the regression coefficients (solid black line). Additionally, the corresponding 90% confidence intervals are presented (dashed black lines), as are a linear (dashed grey line) and a smoothed lowess (solid grey line) trend. Figure 5 shows the results for the eight different sectors that were presumed to be most heavily affected by the World Cup. One of the aims of this approach is to allow for different effects throughout the observation period. The period beginning with the announcement of Germany as host of the 2006 FIFA World Cup in the second quarter of 2000 is particularly in- teresting. From the announcement date until the beginning of the World Cup, potential anticipation and adjustment processes could occur. The results for the aggregated employment data are ambiguous (Figure 4). For the entire observa- tion period, the treatment group counties show superior performance relative to the control group. Starting in 2000, according to the lowess smoothed trend, an increase in relative performance can be seen. After reaching a kind of plateau, the lowess trend turns negative while relative performance remains positive. In the direct run-up to the World Cup and also in its aftermath, a reduction in positive treatment performance can be observed. Figure 5 indicates a negative trend in employment in World Cup venues relative to the remaining counties in Germany. Neither a positive persistent shift in the aftermath of the event nor a positive ad- justment process in preparation for it can be observed from the flexible DD re- gressions for most of the industries examined. Overall, two exceptions may be pointed out. First, the “Hospitality” industry was the only one showing a positive trend. The corresponding indicator series in Figure 5 also provides evidence of a
Sectoral Labour Market Effects of the 2006 FIFA World Cup                                                       17

short-term effect. Besides a weak but clearly positive trend between 2002 and
2006, a peak can be observed in the second quarter of 2006, the month of the
FIFA World Cup, indicating an additional employment boost that lasted only as
long as the World Cup quarter. The construction industry might have also been
affected by the World Cup. From early 2001 until 2004, the corresponding indica-
tor series shows a weak but positive smoothed trend and the relative perform-
ance became positive. The trend then turns negative. This behaviour of the index
series can be weakly interpreted as a consequence of the FIFA World Cup. Most of
the stadium construction work induced by the World Cup was undertaken be-
tween early 2002 and early 2005 so the construction industry might have been
stimulated by public subsidies. On the other hand, the public infrastructure in-
vestments might have been forwarded to some extent. In the aftermath of the
main portion of the stadium construction work, there may have been a lack of
public orders in the construction sector in World Cup areas, resulting in weaker
performance for this sector. To our knowledge, this is the first time that this sort
of theoretically assumed public order displacement effect of a mega-sporting
event has been identified in an empirical analysis.

Fig. 4 Quarterly Treatment Effects

                                                                         All Industries
                                                   .05
             Treatment Effect on log(employment)
                                                   .04
                                                   .03
                                                   .02
                                                   .01
                                                   0

                                                    2000Q1   2002Q1       2004Q1         2006Q1        2008Q1
                                                                                  Time

                                                                Treatment Index           90% Conf. Interval
                                                                Lowess Trend              Linear Trend

Notes: The treatment index is based on the corresponding interactive between quarterly fixed
       effects and the treatment group dummy. The treatment group is defined as all World
       Cup venues. The vertical line marks the quarter of the FIFA World Cup (2006Q2).
Sectoral Labour Market Effects of the 2006 FIFA World Cup 18
Fig. 5 Quarterly Treatment Effects by Sector
Publishing Communications Engineering
.05
.2
Treatment Effect on log(employment)
Treatment Effect on log(employment)
0
0
-.05
-.2
-.1
-.4
-.15
-.2
-.6
2000Q1 2002Q1 2004Q1 2006Q1 2008Q1 2000Q1 2002Q1 2004Q1 2006Q1 2008Q1
Time Time
Construction Wholesale Trade
.1
0
Treatment Effect on log(employment)
Treatment Effect on log(employment)
.05
-.05
0
-.1
-.05
-.1
-.15
2000Q1 2002Q1 2004Q1 2006Q1 2008Q1 2000Q1 2002Q1 2004Q1 2006Q1 2008Q1
Time Time
Retail Trade Hospitality
.05
.15
Treatment Effect on log(employment)
Treatment Effect on log(employment)
.1
0
.05
-.05
0
-.1
-.05
2000Q1 2002Q1 2004Q1 2006Q1 2008Q1 2000Q1 2002Q1 2004Q1 2006Q1 2008Q1
Time Time
Land Transportation Culture, Sports, and Entertainment
.05
.1
Treatment Effect on log(employment)
Treatment Effect on log(employment)
0
.05
-.05
0
-.05
-.1
-.15
-.1
-.15
-.2
2000Q1 2002Q1 2004Q1 2006Q1 2008Q1 2000Q1 2002Q1 2004Q1 2006Q1 2008Q1
Time Time
Treatment Index 90% Conf. Interval
Lowess Trend Linear Trend
Notes: The treatment index is based on the corresponding interactive between quarterly fixed
effects and the treatment group dummy. The treatment group is defined as all World
Cup venues. The vertical line marks the quarter of the FIFA World Cup (2006Q2).Sectoral Labour Market Effects of the 2006 FIFA World Cup 19
4.2 Persistent Treatment vs. Single Impulse
Tables 2 to 4 display the results of the more traditional DD approach, applying a
persistent level shift. The tables contain the estimates for the aggregated data as
well as for the above-mentioned eight sectors. For each industry, two columns are
presented. The first column refers to equation (7) and the second column is based
on equation (12). As shown by BERTRAND, DUFLO, & MULLAINATHAN (2004), DD
models are frequently subject to serial correlation, which might cause overesti-
mation of the significance of the “intervention” dummy. To check for such prob-
lems, we performed a LM test for serial correlations in a fixed-effects model, as
suggested by BALTAGI (2001, pp. 94-95).6 Note that the test clearly rejects the null
hypothesis of there being no serial correlation and thus the standard errors are
corrected using an arbitrary variance-covariance matrix as recommended by BER-
TRAND, DUFLO, & MULLAINATHAN (2004) in all estimations.
The variable of interest is . The hypothesis of the World Cup having no bene-
ficial effect must be rejected in the case of a significant positive coefficient. The
regressions for the aggregated employment data (“All”) display a similar structure
that is also typical of many of the regressions based on sector-differentiated data.
The persistent level shift dummy is significant in the first column for each spe-
cific sector. However, as mentioned above, different spatial trends between the
two groups might hurt condition (11). If a treatment group-specific trend is in-
cluded in the regression, becomes insignificant (second column for each sector)
and no persistent effect of the World Cup can be detected. There are only two
sectors for which the hypothesis of there being no beneficial effect must be re-
jected. The first is the hospitality sector, for which a significantly positive effect of
the World Cup can be found in the regression without a trend. Including a trend
leads to an insignificant shift dummy, but the trend coefficient is insignificant
itself. In the case of the construction industry, is significantly negative, and the
coefficient remains significant after the inclusion of a (insignificant) trend, imply-
6
The LM test statistic is ⁄ 1 ⁄ , which is asymptotically distributed as
0,1 .Sectoral Labour Market Effects of the 2006 FIFA World Cup 20
ing that a persistent negative level shift occurred in the construction industry in
the aftermath of the 2006 World Cup. This corroborates the evidence of a dis-
placement effect of public orders in the venue counties, as was suggested by the
results indicated in the previous section.
Tab. 1 Treatment Effect: Persistent Level Shift
Communications
Industry All Publishing
Engineering
10.768*** 10.764*** 6.095*** 6.111*** 5.779*** 5.828***
Constant
(0.003) (0.002) (0.010) (0.010) (0.036) (0.038)
-0.023*** -0.003 -0.082*** -0.002 -0.087 0.069
(0.008) (0.008) (0.031) (0.017) (0.096) (0.100)
0.001*** -0.004*** -0.008*
– -4 – –
(2.00e ) (0.002) (0.005)
R² 0.998 0.998 0.983 0.983 0.902 0.902
adj. R² 0.998 0.998 0.983 0.983 0.899 0.899
N×T 13,494 13,494 13,494 13,494 6,970 6,970
LM5 106.848 106.841 104.493 104.494 69.684 69.678
% Effect 2.3% no 8.6% no no no
*** ** *
Notes: pSectoral Labour Market Effects of the 2006 FIFA World Cup 21
Tab. 2 Treatment Effect: Persistent Level Shift (cont. I)
Industry Construction Wholesale Trade Retail Trade
8.270*** 8.266*** 7.627*** 7.636*** 8.226*** 8.236***
Constant
(0.007) (0.009) (0.007) (0.008) (0.004) (0.003)
-0.055*** -0.077*** -0.057 -0.012 -0.054*** -0.006
(0.021) (0.017) (0.018) (0.024) (0.016) (0.018)
0.001 -0.002* -0.002***
– – – -4
(0.001) (0.001) (3.84e )
R² 0.985 0.985 0.991 0.991 0.994 0.994
adj. R² 0.985 0.985 0.991 0.991 0.994 0.994
N×T 13,494 13,494 13,494 13,494 13,494 13,494
LM5 103.355 103.335 103.971 103.988 105.461 105.477
% Effect 5.7% 8.0% no no 5.5% no
*** ** *
Notes: pSectoral Labour Market Effects of the 2006 FIFA World Cup 22
In summary, the tests for persistent level shifts hardly showed any impact of the
2006 FIFA World Cup on disaggregated employment, with the minor exception of
the hospitality sector.
To test for a short-term impact, we use equation (13). Table 4 summarises these
results. The treatment dummy, which takes the value of one during the World
Cup (2006Q2) and zero otherwise, is insignificant for most of the regressions, in-
dicating no common short-term effect. In the regressions without a trend, three
sectors (publishing, retail trade, and hospitality) display a significant coefficient.
Including a trend implies insignificant coefficients for all sectors except the hospi-
tality sector. This result confirms the insights generated using the flexible ap-
proach. In conclusion, a significant peak in hospitality employment can be at-
tested to for the quarter during which the 2006 World Cup was held. Because the
DD approach controls for counterfactuals, this peak can be associated with the
World Cup.
Tab. 4 Treatment Effect: Single Impulse
Communications
Industry All Publishing
Engineering
10.768*** 10.767*** 6.095*** 6.112*** 5.779*** 5.815***
Constant
(0.003) (0.003) (0.010) (0.010) (0.036) (0.036)
0.001 -0.002 -0.046** -0.008 -0.041 0.014
(0.005) (0.003) (0.021) (0.011) (0.147) (0.156)
-4
3.08e -0.004*** -0.006
– -4 – –
(2.89e ) (0.002) (0.004)
R² 0.998 0.998 0.983 0.983 0.902 0.902
adj. R² 0.998 0.998 0.983 0.983 0.899 0.899
N×T 13,494 13,494 13,494 13,494 6,970 6,970
LM5 106.841 106.849 104.512 104.494 69.688 69.682
% Effect no no 4.7% no No no
***
Notes: pSectoral Labour Market Effects of the 2006 FIFA World Cup 23
Tab. 5 Treatment Effect: Single Impulse (cont. I)
Industry Construction Wholesale Trade Retail Trade
8.270*** 8.275*** 7.627*** 7.638*** 8.226*** 8.237***
Constant
(0.007) (0.008) (0.007) (0.007) (0.004) (0.004)
-0.039 -0.027 -0.022 0.003 -0.033*** -0.009
(0.023) (0.019) (0.021) (0.016) (0.011) (0.009)
-0.001 -0.003*** -0.003***
– – –
(0.001) (0.001) (0.001)
R² 0.985 0.985 0.991 0.991 0.994 0.994
adj. R² 0.985 0.985 0.991 0.991 0.994 0.994
N×T 13,494 13,494 13,494 13,494 13,494 13,494
LM5 103.377 103.382 103.994 103.988 105.526 105.475
% Effect no no no no 3.4% no
*** ** *
Notes: pSectoral Labour Market Effects of the 2006 FIFA World Cup 24 5 Conclusion This study is the first to test for employment effects of the 2006 World Cup on the basis of data that are regionalised and sectoralised. To our knowledge, it is also the first study to operate on this basis for a sports event outside the USA. Studies of the 2006 World Cup that used regionalised data on a macro level could not identify any employment effects (HAGN & MAENNIG (2009) and FEDDERSEN, GRÖTZINGER, & MAENNIG (2009)). Two different DD approaches were employed: a flexible partially non-parametric model and a more traditional DD model. Both approaches reject the hypothesis of a long-term and persistent employment boost caused by the 2006 World Cup. Even a short-term effect lasting only one quarter cannot be generally confirmed. Only the hospitality sector, which is one of the industries predestined to be af- fected by a mega-sporting event, showed a significantly positive short-term ef- fect. In this sector, in the second quarter of 2006, an employment increase of 3.2% was observed. This effect can be translated into about 2,000 additional jobs within the German hospitality industries (hotels, food services, and drinking es- tablishments), a far cry from the five-digit employment effects predicted in most ex-ante studies. With regard to the construction sector, both DD approaches sug- gest that the venue counties’ construction industry gained in the run-up phase of the event. However, beginning with the end of the infrastructural measures in the pre-event period, an employment decrease was observed. Combining these two findings, one might suggest that a displacement effect of public (infrastruc- ture) investment occurred. In summary, it appears that even the sectorally, temporally and geographically localised positive employment effects of the 2006 World Cup were small. This conclusion is in line with most of the scholarly ex-post analyses that have used macro data, sectoral data, and/or regional data.
Sectoral Labour Market Effects of the 2006 FIFA World Cup                               25

Literature
AHLFELDT, G. M. (2010). Blessing or Curse? Appreciation, Amenities and Resistance around
  the Berlin "Mediaspree". Hamburg Contemporary Economic Discussions, 32.
ALLMERS, S., & MAENNIG, W. (2009). Economic Impacts of the FIFA Soccer World Cups in
   France 1998, Germany 2006, and Outlook for South Africa 2010. Eastern Economic
   Journal, 35(4), 500-519.
BAADE, R. A. (1987). Is There an Economic Rationale for Subsidizing Sports Stadiums?
  Heartland Policy Study 13.
BAADE, R. A. (1996). Professional Sports as Catalysts for Metropolitan Economic
  Development. Journal of Urban Affairs, 18(1), 1-17.
BAADE, R. A., BAUMANN, R. W., & MATHESON, V. A. (2008a). Selling the Game:
  Estimating the Economic Impact of Professional Sports through Taxable Sales.
  Southern Economic Journal, 74(3), 794-810.
BAADE, R. A., BAUMANN, R. W., & MATHESON, V. A. (2008b). Slippery Slope? Assessing
  the Economic Impact of the 2002 Winter Olympic Games in Salt Lake City, Utah.
  Région & Développement, 31, 79-89.
BAADE, R. A., & DYE, R. F. (1988). An Analysis of the Economic Rational for Public
  Subsidization of Sports Stadiums. Annals of Regional Science, 22(2), 37-47.
BAADE, R. A., & DYE, R. F. (1990). The Impact of Stadiums and Professional Sports on
  Metropolitan Area Development. Growth and Change, 21(2), 1-14.
BAADE, R. A., & MATHESON, V. A. (2001). Home Run or Wild Pitch? Assessing the
  Economic Impact of Major League Baseball's All-Star Game. Journal of Sports
  Economics, 2(4), 307-327.
BAADE, R. A., & MATHESON, V. A. (2002). Bidding for the Olympics: Fool's Gold? In C. P.
  Barros, M. Ibrahimo, & S. Szymanski (Eds.), Transatlantic Sport: The Comparative
  Economics of North American and European Sports (pp. 127-151). Cheltenham, U.K.
  and Northampton, Mass.: Edward Elgar.
BAADE, R. A., & MATHESON, V. A. (2004). The Quest for the Cup: Assessing the Economic
  Impact of the World Cup. Regional Studies, 38(4), 343-354.
BALTAGI, B. H. (2001). Econometric Analysis of Panel Data (2 ed.). New York: Wiley & Sons.
BAUM, C. F. (2006). An Introduction to Modern Econometrics Using Stata. College Station:
  Stata Press.
BERTRAND, M., DUFLO, E., & MULLAINATHAN, S. (2004). How Much Should We Trust
  Differences-in-Differences Estimates? Quarterly Journal of Economics, 119(1), 249-275.
BRENKE, K., & WAGNER, G. G. (2007). Zum volkswirtschaftlichen Wert der Fußball-
  Weltmeisterschaft 2006 in Deutschland. DIW Berlin Research Notes, 19.
CARLINO, G., & COULSON, N. E. (2004). Compensating Differentials and the Social
  Benefits of the NFL. Journal of Urban Economics, 56(1), 25-50.
CARLINO, G., & COULSON, N. E. (2006). Compensating Differentials and the Social Benefit
  of the NFL: Reply. Journal of Urban Economics, 60(1), 132-138.
COATES, D. (2006). The Tax Benefits of Hosting the Super Bowl and the MLB All-Star
  Game: The Houston Experience. International Journal of Sport Finance, 1(4), 239-252.
Sectoral Labour Market Effects of the 2006 FIFA World Cup                            26

COATES, D., & HUMPHREYS, B. R. (1999). The Growth Effects of Sport Franchises, Stadia,
  and Arenas. Journal of Policy Analysis and Management, 18(4), 601-624.
COATES, D., & HUMPHREYS, B. R. (2000). The Stadium Gambit and Local Economic
  Development. The Cato Review of Business and Government, 23(2), 15-20.
COATES, D., & HUMPHREYS, B. R. (2001). The Economic Consequences of Professional
  Sports Strikes and Lockouts. Southern Economic Journal, 67(3), 737-747.
COATES, D., & HUMPHREYS, B. R. (2002). The Economic Impact of Postseason Play in
  Professional Sports. Journal of Sports Economics, 3(3), 291-299.
COATES, D., & HUMPHREYS, B. R. (2003a). The Effect of Professional Sports on Earnings
  and Employment in the Services and Retail Sectors in US Cities. Regional Science and
  Urban Economics, 33(2), 175-198.
COATES, D., & HUMPHREYS, B. R. (2003b). Professional Sports Facilities, Franchises and
  Urban Economic Development. Public Finance and Management, 3(3), 335-357.
COATES, D., & HUMPHREYS, B. R. (2008). Do Economists Reach a Conclusion on Subsidies
  for Sports Franchises, Stadiums, and Mega-Events? Econ Journal Watch, 5(3), 294-315.
COATES, D., HUMPHREYS, B. R., & ZIMBALIST, A. (2006). Compensating Differentials and
  the Social Benefits of the NFL: A Comment. Journal of Urban Economics, 60(1), 124-
  131.
DACHIS, B., DURANTON, G., & TURNER, M. A. (2010). The Effect of Land Transfer Txes on
  Real Estate Markets: Evidence from a Natural Experiment in Toronto. Working Paper,
  Univertsity of Toronto (forthcoming in Journal of Urban Economics).
DEUTSCHE INDUSTRIE- UND HANDELSKAMMER (2006). Fußball-WM 2006, Auswirkungen
  auf die Unternehmen. Retrieved 21 November 2006, from http://www.dihk.de/
  index.html?/inhalt/themen/branchen/tourismus/fussball/wirtschaft.html.
DEUTSCHE POSTBANK AG (2005a). FIFA Fußball-Weltmeisterschaft 2006 – Deutsche
  Wirtschaft steht als Gewinner bereits fest. Retrieved 18 November 2006, from
  http://www.postbank.de/Datei/RSpezialFebruar05.pdf.
DEUTSCHE POSTBANK AG (2005b). FIFA Fußball-Weltmeisterschaft 2006 – Signifikante
  Arbeitsplatz- und Beschäftigungszuwächse in einzelnen Branchen. Retrieved 18
  November 2006, from http://www.postbank.de/Datei/RSpezialJuli05.pdf.
DEUTSCHE POSTBANK AG (2006). FIFA Fußball-Weltmeisterschaft 2006 – Kleine und
  "ärmere" Austragungsorte profitieren am Meisten. Retrieved 18 November 2006, from
  http://postbank.de/Datei/RSpezialJanuar06.pdf.
ENDERS, W. (1995). Applied Econometric Time Series. New York: Wiley & Sons.
FEDDERSEN, A., GRÖTZINGER, A. L., & MAENNIG, W. (2009). Investment in Stadia and
  Regional Economic Development – Evidence from FIFA World Cup 2006. International
  Journal of Sport Finance, 4(4), 221-239.
FIFA. (2006). World Cup 2006 in Germany, Stadia [Electronic Version]. Retrieved 12th May
   2006 from http://fifaworldcup.yahoo.com/06/de/d/stadium/index.html.
HAGN, F., & MAENNIG, W. (2008). Employment Effects of the Football World Cup 1974 in
  Germany. Labour Economics, 15(5), 1062-1075.
HAGN, F., & MAENNIG, W. (2009). Labour Market Effects of the 2006 Soccer World Cup in
  Germany. Applied Economics, 41(25), 3295-3302.
Sectoral Labour Market Effects of the 2006 FIFA World Cup                                 27

HALVORSEN, R., & PALMQUIST, R. (1980). The Interpretation of Dummy Variables in
  Semilogarithmic Equations. American Economics Review, 70(3), 474-475.
HOTCHKISS, J. L., MOORE, R. E., & ZOBAY, S. M. (2003). Impact of the 1996 Summer
  Olympic Games on Employment and Wages in Georgia. Southern Economic Journal,
  69(3), 691-704.
IMBENS, G. W., & LEMIEUX, T. (2008). Regression Discontinuity Designs: A Guide to
  Practice. Journal of Econometrics, 142(2), 615-635.
JASMAND, S., & MAENNIG, W. (2008). Regional Income and Employment Effects of the
   1972 Munich Summer Olympic Games. Regional Studies, 42(7), 991-1002.
KAVETSOS, G., & SZYMANSKI, S. (2009). National Well-Being and International Sports
  Events. Journal of Economic Psychology, DOI:10.1016/j.joep.2009.1011.1005.
KURSCHEIDT, M., PREUß, H., & SCHÜTTE, N. (2008). Konsuminduzierter Impakt von
  Sportgroßevents am Beispiel der Fußball-WM 2006 – Befragungsergebnisse und
  Implikationen für die Euro 2008 [Consumption Induced Impact of Major Sport Events
  for the Case of the Football World Cup 2006: Survey Results and Implications for Euro
  2008]. Wirtschaftspolitische Blätter, 55(1), 79-94.
LEEDS, M. A. (2008). Do Good Olympics Make Good Neighbors? Contemporary Economic
   Policy, 26(3), 460-467.
MAENNIG, W. (2007). One Year Later: A Re-Appraisal of the Economics of the 2006 Soccer
  World Cup. Hamburg Contemporary Economic Discussions, No. 10.
MATHESON, V. (2006). Mega-Events: The Effect of the World’s Biggest Sporting Events on
  Local, Regional, and National Economies, Working Paper NO. 60-10. Worcester, MA:
  Department of Economics, College of the Holy Cross.
MATHESON, V. A. (2005). Contrary Evidence on the Economic Effect of the Super Bowl on
  the Victorious City. Journal of Sports Economics, 6(4), 420-428.
PORTER, P. K. (1999). Mega-Sports Events as Municipal Investments: A Critique of Impact
  Analysis. In J. Fizel, E. Gustafson, & L. Hadley (Eds.), Sports Economics: Current Research
  (pp. 61-74). Westport, CT: Praeger Publishers.
STERKEN, E. (2006). Growth Impact of Major Sporting Events. European Sport
   Management Quarterly, 6(4), 375-389.
SZYMANSKI, S. (2002). The Economic Impact of the World Cup. World Economics, 3(1),
  169-177.
TEIGLAND, J. (1999). Mega-Events and Impacts on Tourism; the Predictions and Realities
   of the Lillehammer Olympics. Impact Assessment and Project Appraisal, 17(4), 305-317.
WOOLDRIDGE, J. M. (2009). Introductory Econometrics: A Modern Approach (4th ed.).
 Mason, OH: South-Western Cengage Learning.
You can also read