The Federal Earned Income Tax Credit and The Minnesota Working Family Credit
←
→
Page content transcription
If your browser does not render page correctly, please read the page content below
INFORMATION BRIEF
       Research Department
       Minnesota House of Representatives
       600 State Office Building
       St. Paul, MN 55155

       Nina Manzi, Legislative Analyst, 651-296-5204
       Joel Michael, Legislative Analyst, 651-296-5057                                                             Updated: March 2013

                The Federal Earned Income Tax Credit
                                and
                The Minnesota Working Family Credit
                 The federal earned income tax credit (EITC) provides a wage supplement equal to
                 a percentage of the earnings of low-income individuals. The credit is fully
                 refundable; if the credit exceeds a filer’s tax liability, the rest is paid as a refund.

                 The Minnesota working family credit (WFC) is also a tax credit that is a
                 percentage of earnings. Before 1998, the WFC was set as a percentage of the
                 federal EITC. Legislation enacted in 1998 restructured the WFC as a percentage
                 of earnings. This restructuring reduced work disincentives caused by interactions
                 with income and payroll taxes and the state’s welfare program. Like the EITC,
                 the WFC is refundable. This information brief describes the credits.

       Contents
       Executive Summary .........................................................................................................................3
       How the Federal Earned Income Tax Credit Works ........................................................................5
       The Minnesota Working Family Credit ...........................................................................................9
       The Tax Credits and Poverty .........................................................................................................17
       The Tax Credits and Work Effort ..................................................................................................19
       Tax Credits and Compliance ..........................................................................................................27
       Appendix: Earned Income Tax Credits in Other States, 2012 .......................................................30

Copies of this publication may be obtained by calling 651-296-6753. This document can be made available in
alternative formats for people with disabilities by calling 651-296-6753 or the Minnesota State Relay Service at
711 or 1-800-627-3529 (TTY). Many House Research Department publications are also available on the
Internet at: www.house.mn/hrd/.
House Research Department Updated: March 2013
The Federal Earned Income Tax Credit and the Minnesota Working Family Credit Page 2
List of Tables and Figures
Tables
Table 1: Maximum Federal Earned Income Tax Credit, 2013 ........................................................5
Table 2: Federal Earned Income Tax Credit Phaseout, 2013 ..........................................................6
Table 3: Minnesota Working Family Credit Calculation, 2013 ....................................................10
Table 4: Minnesota Working Family Credit, 1991 to 2015 ...........................................................13
Table 5: Effect of WFC Restructuring on Net Annual Resources, Single Parent with Two
Children, 1998....................................................................................................................25
Table 6: Effect of WFC Restructuring on Net Annual Resources, Single Parent with Two
Children, 2012....................................................................................................................26
Graphics and Maps
Figure 1: Minnesota Working Family Credit Recipients, 2010 .................................................... 11
Figure 2: Percentage of Returns Claiming Minnesota Working Family Credit, 2010 ................. 12
Figure 3: Refundability of Working Family Credit, 2010 ............................................................ 15
Figure 4: WFC Recipients by Number of Qualifying Children and Marital Status, 2010 ........... 16
Figure 5: Effect of EITC and WFC on Income: Single Parent and Married Couple Families, One
Full-Time Minimum Wage Worker, 2012 ........................................................................ 18
Figure 6: EITC and WFC Ranges, Filers with One Qualifying Child, 2012 ................................ 20House Research Department Updated: March 2013 The Federal Earned Income Tax Credit and the Minnesota Working Family Credit Page 3 Executive Summary How the Federal Earned Income Tax Credit Works The federal earned income tax credit (EITC) and Minnesota working family credit (WFC) equal a percentage of the earnings of low-income individuals, up to a maximum amount. The credits are phased out for filers with incomes above dollar limits. Different maximum amounts, credit percentages and phaseout rates apply for people with zero, one, two, or three or more dependents. The credits are refundable; if the credit exceeds a filer’s tax liability, the rest is paid as a refund. Eligible individuals claim the credits when they file their federal and state income tax returns. In 2010, about 350,000 Minnesota filers claimed federal EITCs totaling $666 million, and state WFCs totaling $193.6 million. About 13 percent of all filers claimed the credits. The average EITC was $1,906; the average WFC was $586. Most credit recipients had one or more qualifying children. Twenty-four other states offer earned income tax credits. Most of these equal a percentage of the federal credit and are refundable, but a handful of states provide nonrefundable credits. These programs are listed in the appendix. The Tax Credits and Poverty The EITC was designed to provide financial assistance to families who would otherwise be living in poverty. Since the EITC took effect in 1975, the federal government has expanded the program significantly, and the current credit parameters are indexed annually to keep pace with inflation. Nationwide, the EITC has an estimated participation rate of 75 percent, a rate that is higher than other traditional income assistance programs. The 2012 EITC and WFC combined will be large enough to lift single parents and married couples with one child above the poverty level. But they are not enough to raise the income of full-time working single parents of two or more children above the federal poverty guidelines. The Tax Credits and Work Effort Because the credits phase out when income increases, their effect on work incentive varies depending on where an individual is on the income scale. If an individual is in the phase-in range, the credits reward individuals with a higher return on work; if an individual is on the phaseout range, the credits reduce the return on work. This provides a work incentive for those in the phase-in range, and a work disincentive for those in the phaseout range; such a disincentive is inevitable for a credit that phases out as income increases. Most research suggests that the EITC increases total work effort by a small amount.
House Research Department Updated: March 2013
The Federal Earned Income Tax Credit and the Minnesota Working Family Credit Page 4
The Tax Credits and Compliance
The growth of the EITC program has led to concerns about compliance and payments to
ineligible recipients. The IRS has conducted three pilot compliance tests or studies to better
understand how to reduce overclaims for the EITC:
The Qualifying Child Residency Study had the objective of reducing erroneous claims for
children who don’t meet the definition of a qualifying child by requiring precertification
of children
The Filing Status Study had the goal of reducing the number of taxpayers filing as head
of household in order to claim larger credits than they would be eligible for as married
joint filers
The Automated Underreporter Study (AUR) sought to reduce income underreporting that
results in larger credit claims
The IRS determined that neither precertifying qualifying children nor requiring documentation of
filing status were cost-effective; while both reduced the number of erroneous claims, the
administrative costs exceeded the savings realized by reducing erroneous claims. Third-party
income matching developed in AUR proved to be cost-effective and has been incorporated into
IRS methodology used in annually reviewing a subset of all EITC claims.House Research Department Updated: March 2013
The Federal Earned Income Tax Credit and the Minnesota Working Family Credit Page 5
How the Federal Earned Income Tax Credit Works
The federal earned income tax credit (EITC) equals a percentage of earned income, up to a
maximum amount. The credit increases as earnings increase, up to the maximum amount. The
credit then remains constant until earnings reach the phaseout threshold. It phases out as income
increases above the threshold.
This section describes how the credit is calculated. Filers do not have to perform these
calculations to obtain the credit; instead they enter relevant information in a worksheet and look
up their credit in a table keyed to income and number of qualifying children.
Earned income, up to a maximum amount, is multiplied by a credit percentage to calculate
the credit.
Earned income generally consists of income from wages, salary, and self-employment. Different
maximum amounts and credit percentages apply for individuals with zero, one, two, and three or
more dependents. The maximum amount of earned income that qualifies for the credit is
indexed each year for inflation. Table 1 shows the credit percentages, maximum amounts, and
maximum credits for tax year 2013.
Table 1:
Maximum Federal Earned Income Tax Credit, 2013
Maximum Earned Credit Maximum
Income x Percentage = Credit
No Qualifying Children $6,370 x 7.65% = $487
1 Qualifying Child 9,560 x 34.00 = 3,250
2 Qualifying Children 13,430 x 40.00 = 5,372
3 or More Qualifying Children 13,430 x 45.00 = 6,043
House Research Department
The EITC is phased out for filers with incomes above set dollar thresholds.
The credit provides separate phaseout thresholds and phaseout rates for filers with zero, one, and
two or more qualifying children. The thresholds are indexed annually for inflation. Although
the credit is a percentage of earned income, the phaseout is based on the greater of earned
income or adjusted gross income. Use of adjusted gross income as an alternative limit is
intended to adjust the amount of credit for other sources of income (such as investment income,
unemployment compensation, and so forth).
The Economic Growth and Tax Relief Reconciliation Act (EGTRRA) of 2001 provided for
higher phaseout thresholds for married couples filing joint returns than for other taxpayers. This
change was intended to alleviate the marriage penalty imposed under the earned income tax
credit. The American Recovery and Reinvestment Act (ARRA) of 2009 further increased the
threshold for married joint filers. The Tax Relief, Unemployment Insurance Reauthorization,
and Job Creation Act (TRUIRJCA) of 2010 extended the increased threshold for two years,House Research Department Updated: March 2013
The Federal Earned Income Tax Credit and the Minnesota Working Family Credit Page 6
through tax year 2012. The American Taxpayer Relief Act (ATRA) of 2012 extended the higher
thresholds put in place under ARRA through 2017, and made the EGTRRA thresholds
permanent in following years.1 Table 2 shows the phaseout thresholds, rates, and income at
which the credit is fully phased out in 2013, for married couples and for all other filers.
Table 2:
Federal Earned Income Tax Credit Phaseout, 2013
Income at which
credit is fully
Phaseout Rate Phaseout Threshold
phased out
Married couples
No Qualifying Children 7.65% of income over $13,310 $19,680
1 Qualifying Child 15.98 of income over 22,870 43,210
2 Qualifying Children 21.06 of income over 22,870 48,378
3 or More Qualifying Children 21.06 of income over 22,870 51,567
All other filers
No Qualifying Children 7.65% of income over $7,970 $14,340
1 Qualifying Child 15.98 of income over 17,530 37,870
2 Qualifying Children 21.06 of income over 17,530 43,038
3 or More Qualifying Children 21.06 of income over 17,530 46,227
House Research Department
A marriage penalty may occur under the earned income credit when a single parent eligible for
the credit marries.2 The couple’s combined income is likely to be higher than the single parent’s
income was, resulting in a reduction or complete loss of the credit due to more income being in
the phaseout range. For example, a single parent with one qualifying child and earned income of
$10,000 qualifies for the maximum credit of $3,250. If this individual marries a single filer who
also has $10,000 of earned income, the couple has a combined earned income of $20,000.
Before the phaseout was extended for married couples, this couple would have qualified for a
credit of $2,856 (the $3,250 maximum credit, minus 15.98 percent of income over the phaseout
1
Under the provisions of EGTRRA 2001, the income level at which the credit begins to phase out was
increased for married couples filing joint returns by $1,000 in tax years 2002-2004, $2,000 in tax years 2005-2007,
and by $3,000 in tax year 2008 and indexed for inflation in following years. ARRA 2009 further increased the
threshold to $5,000 in 2009 and provided for it to be indexed for inflation in 2010. Like most provisions of
EGTRRA 2001, the increased phaseout threshold for married filers was scheduled to expire after tax year 2010, but
was extended through tax year 2012 under TRUIRJCA 2010. ATRA extended the $5,000 increased threshold,
indexed from 2009, through 2017 and made the $3,000 increased threshold, indexed from 2008, permanent
beginning in 2018.
2
Conversely, some couples receive a marriage bonus. This generally occurs for lower income couples, where
an individual with modest earnings marries an individual who has one or more dependents and low or no earnings.
In such a case, marriage results in more earnings qualifying for the credit and a marriage bonus. Marriage penalties
tend to occur among couples with higher incomes, while couples with lower incomes tend to have bonuses. One
study has estimated that the EITC causes about 10 percent of federal income tax marriage penalties. Janet Holtzblatt
and Robert Rebelein, “Measuring the Effect of the EITC on Marriage Penalties and Bonuses,” National Tax Journal
52 (2000): 1107, 1131 (assumption that couples continue to live together). This study does not reflect the EGTRRA
changes.House Research Department Updated: March 2013
The Federal Earned Income Tax Credit and the Minnesota Working Family Credit Page 7
threshold of $17,530). The couple would have experienced a marriage penalty of $394, since the
credit is $394 smaller than what the single parent qualified for before marriage. Increasing the
phaseout threshold by $5,340 for married couples increases this couple’s credit to $3,250 (the
maximum credit) and eliminates the marriage penalty.
Filers with more than $3,300 in disqualified income are not eligible for the EITC in tax
year 2013.
“Disqualified income” consists of the following:
taxable and nontaxable interest
dividends
rent and royalty income if greater than zero
capital gain income if greater than zero
net passive income that is not self-employment income, if greater than zero
In 1995, Congress limited claimants to $2,350 in disqualified income, effective in tax year 1996.
In 1996, Congress lowered the $2,350 limit to $2,200 before the original limit took effect and
indexed the $2,200 annually for inflation. The implementation of a disqualified income limit,
along with using adjusted gross income for the phaseout, is intended to stop individuals with
significant assets but low income in a particular year from claiming the EITC.
The credit is fully refundable.
If a filer is eligible for a credit that exceeds his or her tax liability, that filer receives the amount
of credit that exceeds liability as a refund. Many credit recipients have little or no tax liability.
In 2013, the standard deduction and exemption amounts ensure that a married couple with two
dependents will owe no federal income tax until gross income exceeds $27,800; the federal child
credit of $1,000 per child further increases the income level at which a married couple with two
children first owes tax to $47,083. A head of household filer with one dependent will owe no tax
until gross income exceeds $16,750; with the child credit this increases to $26,750. Many EITC
recipients have gross incomes below these levels; they receive the full credit amount for which
they qualify as a refund.
In 2010, 349,510 Minnesotans claimed $666 million in earned income tax credits.
Of this amount, $84 million offset liability, and the remaining $582 million was paid as refunds.
The 349,510 claims represented 13.6 percent of all federal returns filed by Minnesotans. The
average EITC claimed by Minnesotans was $1,906. Nationwide, 19.1 percent of all returns
claimed an average EITC of $2,202. The percent of returns claiming the credit ranged from 12.1
percent in Connecticut to 32.8 percent in Mississippi, and the average credit claimed ranged from
$1,740 in Vermont to $2,559 in Mississippi.
Filers claim the credit when they file their income tax returns.
Filers eligible for the EITC must file either form 1040 or 1040A. Taxpayers who want to have
the IRS calculate the credit amount for them do so by also completing Schedule EIC; taxpayersHouse Research Department Updated: March 2013
The Federal Earned Income Tax Credit and the Minnesota Working Family Credit Page 8
who want to calculate the credit themselves complete a worksheet included in the instructions for
form 1040.
Prior to tax year 2011, taxpayers had the option of claiming all or part of the credit as an advance
payment from their employer.3 Very few people used the advance payment options. It imposed
an administrative burden on employers, who had to adjust their payrolls and forward a
supplement to the taxpayer’s W-4 to the IRS. It also posed compliance issues and presented
opportunities for abuse, since individuals could potentially receive a larger credit during the year
than they were ultimately entitled to. A 2007 Government Accountability Office report4
recommended that the IRS consider options to reduce noncompliance among the small number
of claimants who received advance payments. If those options were found to be impractical, the
GAO recommended that the U.S. Treasury secretary make a recommendation to Congress on
retention or repeal of the advance payment option.
The President’s Budget for Fiscal Year 2010 proposed eliminating the advanced payment option.
The press briefing materials indicated that the elimination was based on the high error rates
associated with the option. Office of Management and Budget Director Peter Orszag said the
program “does not work well.”5 The budget for fiscal year 2011 contained a similar provision,6
and elimination of the option was enacted and signed into law in August 2010.
3
Public Law Nunber 111-226 repealed the advance payment option, effective in tax year 2011.
4
U.S. Government Accountability Office, Advance Earned Income Credit (August 2007).
5
White House, Press Briefing by OMB Director Peter Orszag and CEA Chair Christina Romer, February 26,
2009, http://www.whitehouse.gov/the_press_office/Press-Briefing-by-OMB-Director-Peter-Orszag-and-CEA-Chair-
Christina-Romer/ (accessed May 26, 2010).
6
U.S. Department of the Treasury, “General Explanation of the Administration’s Fiscal Year 2011 Revenue
Provisions,” February 2010, 94, http://www.wipfli.com/resources/images/11984.pdf (accessed May 26, 2010).House Research Department Updated: March 2013
The Federal Earned Income Tax Credit and the Minnesota Working Family Credit Page 9
The Minnesota Working Family Credit
Minnesota, as well as 24 History of the EITC and WFC
other states, offers a state
version of the EITC.7 Like 1975 Federal Earned Income Tax Credit (EITC) enacted
the federal credit, it is fully 1979 EITC increased; advance payments made available
refundable. Most state 1985 EITC increased
credits simply equal a
1987 EITC increased and indexed for inflation
percentage of the federal
credit. Minnesota’s credit 1988 EITC phaseout floor increased
initially followed that 1991 EITC increased; filers with two or more children receive larger
pattern. In 1998 the credit than those with one; supplemental credits for health
insurance and young children added
legislature restructured
Minnesota’s credit so that it Minnesota implements the refundable Working Family Credit
(WFC), equal to 10 percent of the EITC
equals a percentage of
earned income, rather than a 1993 WFC increased to 15 percent of the EITC
percentage of the federal 1994 EITC increased; supplemental credits eliminated; EITC
credit. The 1999 Legislature extended to claimants without dependents
increased the percentage of 1995 EITC increased; qualifying income decreased for filers with
the first tier of income that one child
qualifies for the credit. 1996 EITC rate increased for filers with two or more children;
Claimants must continue to claimants limited to $2,200 in “disqualified investment
income”
meet federal eligibility
requirements. 1997 WFC increased to 25 percent of the EITC for filers with
dependents, effective tax year 1998
The WFC equaled 10 1998 WFC restructured as a percentage of earnings rather than a
percentage of EITC; change intended to decrease high
percent of the federal credit marginal rates imposed during phaseout
when it was first
1999 WFC percentage increased for first tier of earned income
implemented in 1991. The
legislature increased it to 15 2001 EITC and WFC phaseout thresholds increased for married
percent of the federal EITC joint filers to reduce marriage penalties, effective tax year
2002
for tax years 1993 to 1997.
In tax year 1998 the WFC 2009 EITC rate increased for claimants with three or more children,
phaseout threshold further increased for married joint filers
was scheduled to increase to
25 percent of the federal 2010 EITC increased rate for three or more children and increased
phaseout threshold for married claimants extended through tax
credit. However, the 1998 year 2012
Legislature restructured the
2011 WFC phaseout threshold for married claimants increased for
state credit, effective in tax tax year 2011 only
year 1998, in order to reduce
2012 EITC increased rate for three or more children extended
high marginal rates faced by through tax year 2017, increased phaseout thresholds for
low-income taxpayers. married claimants made permanent
7
The appendix provides a table listing state earned income tax credits; Colorado is listed in the table but
excluded from the count of states offering state EITCs since its credit has been suspended since 2001.House Research Department Updated: March 2013
The Federal Earned Income Tax Credit and the Minnesota Working Family Credit Page 10
The 1998 restructuring did not change the maximum credit for filers with no qualifying children
and those with one qualifying child, but increased the maximum credit for tax year 1998 from
$939 to $1,127 for those with two or more qualifying children. The 1999 Legislature increased
the maximum credit for all filers, and the 2000 Legislature increased the credit rates to ensure
that all claimants received at least 25 percent of the federal credit. In 2001, the legislature
conformed to new federal marriage penalty relief provisions that provided for the phaseout
threshold to be higher for married couples than for single and head of household filers. When
Congress further increased the married couple phaseout thresholds for tax years 2009 and 2010
in ARRA 2009, Minnesota did not conform but instead retained the smaller increases that had
been previously enacted. When Congress extended and indexed the ARRA increases to tax year
2011 and 2012, Minnesota conformed for tax year 2011 only. In tax year 2012 there is no
increase in the phaseout threshold at the state level for married joint filers.8 Table 3 shows the
credit calculation for tax year 2013 for single and head of household filers, and for married
couples filing joint returns.
Table 3:
Minnesota Working Family Credit Calculation, 2013
One qualifying child Two or more qualifying children
Credit calculation 8.5% of first $9,560 of earnings, 10% of first $13,430 of earnings,
plus 8.5% of earnings between plus 20% of earnings between
$16,690 and $18,580 $20,530 and $23,210
Maximum credit $973 $1,879
Credit phaseout 5.73% of income over $20,830 10.3% of income over $24,720
Maximum income
$37,815 $42,963
eligible
House Research Department
8
The income level at which the phaseout begins and ends was increased for married filers by $1,000 in 2002-
2004, $2,000 in 2005-2007, and $3,000 in 2008. It was adjusted in following years for inflation and equaled $3,130
in tax years 2009 and 2010. When the corresponding federal provision was extended through tax year 2012,
Minnesota enacted a matching increase for tax year 2011 only, with an increase of $5,080 at the state level.House Research Department Updated: March 2013
The Federal Earned Income Tax Credit and the Minnesota Working Family Credit Page 11
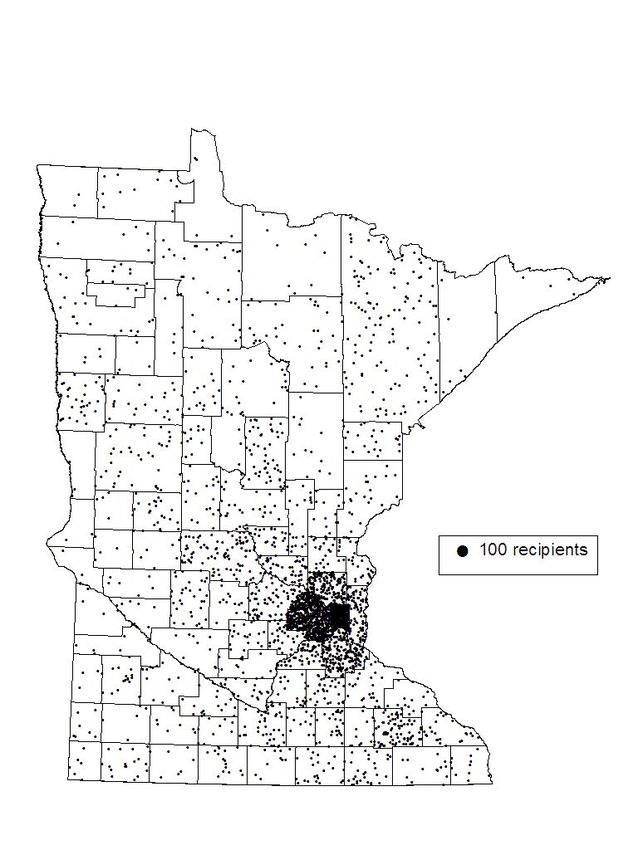
In 2010, 330,040 filers claimed the WFC for a total of $193.6 million.
When the credit was restructured in 1997, there was concern that fewer families would claim the
credit because the calculation had become more complicated. However, the number of claimants
declined by only 4 percent from 1997 (the last year before restructuring) to 1998, the first year
the restructured credit was implemented. Figure 1 shows the distribution of returns by county for
2010.
Figure 1:
Minnesota Working Family Credit Recipients, 2010
While over 48 percent of the returns
claiming credits came from the Twin
Cities metropolitan area, these seven
counties generated about 51 percent of all
returns filed. Put another way, in 2010
metro filers were slightly less likely to
claim the credit than were nonmetro area
filersHouse Research Department Updated: March 2013
The Federal Earned Income Tax Credit and the Minnesota Working Family Credit Page 12
Figure 2 shows the percent of returns on which the credit was claimed by county; this ranged
from 7.1 percent of all returns in Carver County in the metropolitan area, to 20.8 percent of all
returns in Wadena County in north central Minnesota.
Figure 2:
Percentage of Returns Claiming Minnesota Working Family Credit, 2010
Over 16.5 percent of all tax returns filed in many
north central Minnesota counties claimed the WFC,
while fewer than 11.5 percent of returns filed in
most suburban Twin Cities metropolitan counties
claimed the credit. Generally higher incomes in the
metro area make it less likely for filers to qualify
for the credit.
Statewide, about 13 percent of all tax returns
claimed the EITC and WFC in 2010.
The number of returns claiming the credit increased
by about 34 percent over the last ten years, from
about 203,500 in 2000 to about 330,000 in 2010.
The number of returns filed increased just over 1
percent over the same time period. The credit has
changed in two ways in that time period, both of
which contributed to the increase in the number of
claimants. The credit rate increased in 1998 and
again in 2000, and the extended phaseout range for
married joint filers took effect in 2002, and was increased in 2009.
Nationwide, 19 percent of all returns filed claimed the federal credit in 2010. A smaller
percentage of Minnesota returns claimed the federal credit—13.6 percent—probably due to
Minnesota’s higher than average personal income. The lowest percentage of returns claiming the
credit was 12.1 percent in Connecticut and the highest was 32.8 percent in Mississippi.9
Both the average working family credit and the total credit amount per year have
increased dramatically since the credit took effect in 1991.
The average WFC was $78 in 1991, when the credit rate was 10 percent, and $142 in 1993, when
the rate increased to 15 percent. The increases since 1993 resulted from significant expansion of
the federal credit, which took effect in 1994, the increases in the state credit rates in 1998 and
2000, and the extended phaseout range for married joint filers, beginning in 2002.
9
U.S. Department of the Treasury, Internal Revenue Service, Statistics of Income Division.House Research Department Updated: March 2013
The Federal Earned Income Tax Credit and the Minnesota Working Family Credit Page 13
Table 4 shows the total amount of credit claimed, number of claimants, average amount claimed
from 1991 through 2010, and projected amounts for 2011 to 2015.
Table 4:
Minnesota Working Family Credit, 1991 to 2015
Tax year $ claimed (millions) Number of claimants Average credit
1991 $9.7 123,774 $78
1992 $11.5 134,746 $86
1993 $20.5 145,161 $142
1994 $29.6 187,155 $158
1995 $36.9 206,387 $179
1996 $42.5 214,581 $198
1997 $43.5 212,658 $205
1998 $79.6 204,675 $389
1999 $88.6 203,032 $437
2000 $100.7 203,500 $495
2001 $102.7 202,266 $508
2002 $128.3 245,967 $522
2003 $127.4 247,068 $516
2004 $130.3 249,841 $522
2005 $138.8 258,672 $537
2006 $147.2 267,603 $550
2007 $163.3 289,293 $565
2008 $172.6 297,107 $581
2009 $193.8 325,673 $595
2010 $193.6 330,040 $586
2011 (projected) $208.6 344,000 $606
2012 (projected) $196.2 330,600 $593
2013 (projected) $200.1 333,900 $599
2014 (projected) $204.1 337,200 $605
2015 (projected) $208.2 340,600 $611
Source: Minnesota Department of Revenue
The Minnesota working family credit cost $193.6 million in tax year 2010, with the cost
projected to increase to over $200 million in tax year 2011.
The total for 2011 is over five times the $43.5 million paid in 1997, with the increase due to the
1998 restructuring of the credit, the rate increases in 1998 and 2000, and changes to the phaseout
for married joint filers in 2002 and 2009. The decrease in the overall credit amount from 2011 to
2012 reflects the sunset of the extended phaseout range for married joint filers, which is only in
effect through tax year 2011 at the state level.House Research Department Updated: March 2013
The Federal Earned Income Tax Credit and the Minnesota Working Family Credit Page 14
The average EITC claimed in Minnesota in 2010 was $1,906;10 the average WFC was $586.
In 2010, the average EITC nationwide was worth $2,202. The state with the highest average was
Mississippi at $2,559, and the lowest was Vermont at $1,740.11
About 57 percent of WFC recipients have no tax liability, but file a tax return to receive the
credit as a refund.
As Figure 3 shows, another 25 percent of the 2010 recipients owe some tax but receive a credit
that exceeds their liability, so a total of 82 percent of claimants receive at least part of their WFC
as a refund. The remaining recipients—18 percent—have tax liability that equals or exceeds
their credit. This means that a total of 43 percent of claimants use at least part of their WFC to
offset tax liability.
Nationwide, 87 percent of all EITC recipients receive at least part of their credit as a refund. In
Minnesota, 87.4 percent of recipients received a full or partial refund of their EITC compared
with a low of 83.1 percent in New York and a high of 90.6 percent in West Virginia.12
In 1997, the Department of Revenue calculated the WFC for filers who had claimed the federal
credit but not the state credit in tax years 1995 and 1996. It issued over $750,000 in refund
checks to 8,380 eligible filers. The restructuring of the credit in 1998 prevents the department
from repeating this project. Prior to 1998, the state credit was a percentage of the federal credit,
and the federal credit was available electronically to the department, as coded from Form 1040.
The earned income figures needed to calculate the restructured state credit are on a federal
worksheet, not the 1040, and are not available electronically. Data from the 2010 income tax
sample indicates that about 96 percent of Minnesota EITC recipients also claimed the WFC.
This figure has remained fairly constant in recent years.
10
Ibid.
11
Ibid.
12
Ibid.House Research Department Updated: March 2013
The Federal Earned Income Tax Credit and the Minnesota Working Family Credit Page 15
Figure 3:
Refundability of Working Family Credit, 2010
Number of Recipients Dollars of Credit
Credit
42.4% 17.9%
Offsets Tax
Credit
82.0% 82.1%
Refunded
Note: 25.4% of claimants qualify for a credit that exceeds their tax liability. For this 25.4%, part of the credit
offsets liability, and the rest is paid as a refund. This 25.4% is shown in white in both bars on the left.
About one-fifth—17.9 percent—of the total amount paid in WFC offsets tax liability, while
four-fifths—82.1 percent—of the total is distributed as refunds.
In 2010, $158.9 million of the WFC offset tax liability and the remaining $34.7 million was paid
as refunds. At the national level, just under 87 percent of EITC dollars were distributed as
refunds in 2010, with only 13 percent offsetting the federal income tax. In Minnesota, 87.4
percent of the EITC was refunded compared to a high of 90.6 percent in West Virginia, and a
low of 83.1 percent in New York.13
While nationwide the percent of claimants receiving at least part of the credit as a refund (87
percent) happens to equal the percent of the total amount paid in credits, in Minnesota 85.4
percent of EITC recipients receive a full or partial refund, and 87.4 percent of the total paid in
EITCs is paid as a refund.
Most WFC recipients have one or more qualifying children.
Figure 4 shows that in 2010,14 38.7 percent of recipients had two or more qualifying children and
35.1 percent had one qualifying child. About 64 percent of the dollars paid in credits went to the
38.7 percent of claimants who had two or more qualifying children. This group received a
disproportionate share of credit dollars because of higher credit rates and a higher income at
which the credit phases out for parents with two or more qualifying children than for those with
one or no qualifying children.
13
Ibid.
14
Data on the total amount and refundability of the credit is from the Department of Revenue’s 2010
processing report, and data on the number of qualifying children claimed by recipients is from the 2010 income tax
sample, also prepared by the Department of Revenue.House Research Department Updated: March 2013
The Federal Earned Income Tax Credit and the Minnesota Working Family Credit Page 16
Figure 4:
WFC Recipients by Number of Qualifying Children and Marital Status, 2010
House Research Graphics
Single parents who received the credit were slightly more likely to have only one child than to
have two or more; 28.8 percent of all recipients were single parents with one child, while 24.6
percent were single parents with two or more qualifying children. Married parents, however,
were more likely to have at least two children; 14.1 percent of recipients were married with two
or more qualifying children, and only 6.3 percent were married with one qualifying child.
Over 26 percent of all recipients had no qualifying children. This group, however, received only
about 3 percent of credit dollars. In 2010, claimants without children received credits equal to
1.1925 percent of their first $5,990 of earnings. The credit is fully phased out at a relatively low
income for filers without qualifying children—$13,470 in 2010, compared to a maximum
income of $35,487 for parents of one qualifying child, and $40,287 for those with two or more
qualifying children.15
15
The maximum incomes shown are for single and head of household filers. In 2010, the maximum income
eligible for the working family credit was $3,130 higher for married couples filing joint returns.House Research Department Updated: March 2013
The Federal Earned Income Tax Credit and the Minnesota Working Family Credit Page 17
The Tax Credits and Poverty
The EITC has long been viewed as a way to provide financial assistance to families who would
otherwise be living in poverty. In 1975, when the EITC took effect, the federal poverty
guideline for a family of four was around $4,000, the income amount at which the EITC
phaseout began. Since then, the poverty guidelines have risen with inflation to reach $20,650 for
a family of four in 2007. Many view the EITC as a way to raise working families above the
poverty level; to this end the federal government has expanded and revised the EITC to keep
pace with inflation.
The 1993 changes to the EITC provided a significantly larger credit for families with two
dependents than for those with one. This recognizes that two-child families face higher costs for
basic needs than one-child families. The 1995 and 1996 changes sought to ensure that the credit
was reaching its target population of low-income workers and not those who simply had low
income in any one year. The 1998 WFC restructuring sought to alleviate high marginal tax rates
imposed on low-income families. (The box on page 9 summarizes the credit’s history.)
The EITC has an estimated overall participation rate of 75 percent nationwide,16 a higher
rate than most nontax assistance programs such as food stamps.
The earned income and working family tax credits are relatively effective at reaching the low-
income population, due in part to an ongoing outreach campaign authorized by the legislature in
1991 and conducted annually by the Minnesota Department of Revenue. The high participation
rate compares favorably with an estimated 54 percent to 66 percent participation rate for the food
stamp program,17 which targets a similar population. There are several reasons for the higher
rate of participation in the EITC. First, unlike the food stamp program, the EITC asset test is
limited to the “disqualified income” test and does not limit tangible personal property, such as
automobiles.
Second, the stigma associated with participating in a public assistance program, such as food
stamps, may deter people from using the program. Those who participate in the food stamp
program must do so in a public way—using a special debit card to pay for their groceries.
Because of this, some potential recipients may choose not to participate in the program. In
contrast, use of the tax credits is private—eligible individuals simply complete a tax form
without apprehension of public stigma.
16
“Earned Income Tax Credit Eligibility and Participation,” Letter to Representative William J. Coyne, U.S.
House of Representatives, General Accounting Office (December 14, 2001). The participation rate estimate was
calculated using samples of Census Bureau and IRS data. The letter reported estimated participation rates of 45
percent for families without qualifying children, 96 percent for families with one qualifying child, 93 percent for
families with two qualifying children, and 62.5 percent for families with three or more qualifying children; also
“The Earned Income Tax Credit,” IRS Tax Tip 2007-23; IRS website.
17
John Karl Scholz, “The Earned Income Tax Credit: Participation, Compliance, and Antipoverty
Effectiveness,” National Tax Journal 47 (1994): 63, 70-71.House Research Department Updated: March 2013
The Federal Earned Income Tax Credit and the Minnesota Working Family Credit Page 18
Third, in 1998 Minnesota began to administer the food stamp program as part of the Minnesota
Family Investment Program (MFIP), the state’s version of welfare under the federal Temporary
Assistance to Needy Families (TANF). The TANF portion of MFIP benefits is subject to a five-
year lifetime limit. While individuals can receive food stamps for more than five years outside
of MFIP, the publicity surrounding the five-year time limit may discourage some people from
applying. Finally, applying for and collecting food stamps requires more time and effort by a
potential recipient than filling out and mailing a tax return once a year.
The 2009 EITC and WFC will be large enough to lift single parents and married couples
with one child above the poverty level.
Figure 5 compares the earnings of single parent and married couple families with one full-time
minimum wage worker plus the EITC and WFC to the federal poverty level for two-, three-, and
four-person families. Prior to 1993, the credit served to raise single-parent families with one
dependent above the poverty level, but fell short of this goal for two-dependent families with
only one full-time worker. The 1996 federal expansion of the EITC resulted in married and
single-parent families with one dependent, and also single parents with two dependents, having
income above the poverty guideline, after taking the credit into account. Married couples with
two dependents, however, have total income below the poverty guideline even after considering
the federal and state credits.18 The figure uses 2012 poverty guidelines and federal minimum
wage for large employers19 ($7.25 per hour) and assumes that all income is from earnings.
Figure 5:
Effect of EITC and WFC on Income: Single Parent and Married Couple Families, One
Full-Time Minimum Wage Worker, 2012
House Research Graphics
18
Note that married couples with two full-time minimum wage workers would have income above the poverty
guidelines based on wage income alone ($30,160).
19
The federal minimum wage for employees of establishments that have at least $500,000 of gross receipts per
year increased to $7.25 per hour effective July 24, 2009.House Research Department Updated: March 2013 The Federal Earned Income Tax Credit and the Minnesota Working Family Credit Page 19 The federal EITC, combined with Minnesota’s WFC and the increased state minimum wage, is not enough to raise the income of full-time working single parents of two or more dependents above the federal poverty guidelines. The poverty level increases as family size increases, while the EITC and WFC reach their maximum amounts for families with two dependents. The 2012 poverty guideline is $15,130 for a two-person family, and $19,090 for a three-person family. The poverty guideline then increases by $3,960 for each additional family member. A single parent with three dependents faces a poverty guideline of $23,050 but receives the same EITC and WFC as a single parent with two dependents. As family size increases, the gap between earnings from a full-time, minimum wage job plus the EITC and WFC and the poverty guideline also increases. The EITC and WFC moves larger families closer to the poverty guideline, but does not lift them above it. The Tax Credits and Work Effort The work incentive effects of the credits depend upon which part of the credits affects the individual: in the phase-in range, the credits reward individuals with a higher return on work, while the credits’ phaseout provisions actually reduce the return on work for those affected. Also important is how the EITC and WFC interact with other features of the income tax and with transfer programs. The 1998 restructuring of the WFC was intended to alleviate high marginal rates caused by program interactions. Economic theory suggests that the EITC and WFC have two contradictory effects on individual work effort: the substitution effect and the income effect. The substitution effect suggests that by increasing or decreasing the return on work, the credits cause individuals to work more or less (to “substitute” work for leisure or vice versa). To understand the potential substitution effects of the credits, it is necessary to look at what happens to the credit if a filer’s wages increase. Filers can be affected in three ways, depending upon whether they are in the phase-in, flat, or phaseout range of the credits. Figure 6 graphically shows these ranges of the EITC and WFC for filers with one dependent in tax year 2012. The figure assumes that all income is from earnings.
House Research Department                                                              Updated: March 2013
The Federal Earned Income Tax Credit and the Minnesota Working Family Credit                       Page 20

                                                 Figure 6:
                EITC and WFC Ranges, Filers with One Qualifying Child, 2012

For an individual in the phase-in range, a greater work effort results not only in greater
earnings but in larger credits as well.

As long as the individual’s income is less than the maximum qualifying amount, the credits
increase the wage rate. The return for working is higher (in 2012, by as much as 42.5 percent for
individuals with one qualifying child, 50 percent for those with two qualifying children, and 55
percent for those with three or more qualifying children). Because individuals can earn more,
the credits encourage recipients to work more—that is, to substitute work for leisure. The credits
have a positive substitution effect on individuals in the phase-in range. In tax year 2012, an
estimated 23 percent of Minnesota credit recipients will have income in the EITC phase-in
range.20

For filers with incomes above the maximum qualifying amount but below the phaseout
threshold, no substitution effect occurs; working more neither increases nor decreases the
credits.

In tax year 2012, an estimated 22 percent of credit recipients will have income in the EITC “flat”
range.

Finally, the substitution effect is negative, creating a work disincentive, for filers in the
phaseout range; working more reduces their credits.

For example, a 2012 filer with two dependents and income in the phaseout range who received a
$1,000 increase in wages would also experience a $210 reduction in the EITC and a $100

    20
       Estimates were made using the House Income Tax Simulation (HITS) Model, the Minnesota Department of
Revenue 2010 sample of income tax returns, and growth assumptions of the November 2012 economic forecast
prepared by the Minnesota Department of Management and Budget.
House Research Department Updated: March 2013
The Federal Earned Income Tax Credit and the Minnesota Working Family Credit Page 21
reduction in the WFC.21 This can be viewed as a 31 percent implicit tax on the additional $1,000
of wages. To put this in a broader context, these same filers are likely to pay a 10 percent or at
most 15 percent federal income tax, and a 5.35 percent state income tax. An estimated 55
percent of credit recipients will be in the EITC phaseout range in 2012.
The earned income and working family tax credits also have an income effect. The credits
effectively increase the income of low-income workers; they receive both their wages and the
credits. Economic theory suggests that this income effect will cause some individuals to work
less. With the credit, they can maintain the same standard of living while working fewer hours.
The common sense of the income effect can be seen from an extreme example—it is the reason
one expects lottery winners to quit working or work less. While the magnitude of the earned
income tax credit or other wage supplements is much smaller, the effect is similar. The work
disincentive of the income effect affects all individuals who qualify for the credit, regardless of
which range of the credit they are in.
The work disincentive effect is inevitable in a credit that includes a phaseout.
In designing the credit, Congress and the legislature are faced with these trade-offs:
Targeting or limiting the credit to lower income workers
Minimizing the work disincentive that results from “taking away” the credit as
income rises
Limiting the cost of the credit
The credit can have a high phaseout rate, which means that it will go primarily to filers with
incomes below the phaseout threshold. The downside of this approach is that there will be a high
effective tax rate and large work disincentive for filers in the phaseout range. Or, the credit can
have a low phaseout rate, with filers in the phaseout range facing a smaller effective tax rate and
a smaller work disincentive. But this approach means that the credit will be available to filers
with higher incomes and will cost more. Policymakers must choose between imposing a steep
phaseout rate to target the credit to low-income families and to keep the overall cost of the credit
low, or using a lower phaseout rate that makes the credit available at higher incomes and costs
more to fund.
Most available research suggests that the EITC increases total work effort by a small
amount.
Numerous national studies have analyzed the impact of the EITC on work effort. The results of
the studies vary, but generally suggest that:
The work incentive effects of the credit are probably positive. The net effect of the
credit likely is to increase the total number of hours worked. One estimate is that the
21
This calculation of the change in “take-home” pay does not take into account the effect of Social Security or
Medicare tax, or the phaseout of other credits that the filer receives, such as the federal and state dependent care
credits.House Research Department Updated: March 2013
The Federal Earned Income Tax Credit and the Minnesota Working Family Credit Page 22
credit increased total hours worked by 20 million per year.22 Another study
concluded that the federal and state earned income credits were responsible for a
substantial portion of the increase in the employment of single mothers in the early to
middle 1990s.23
More people work as a result of the credit.24 A major effect of the credit is to
increase labor force participation. The credit provides an unambiguous incentive for
those not working to take a job. These individuals are not affected by the “income
effect” (unless their spouses work), and the “substitution effect” provides a higher
return for their earnings in the phase-in range.
People already working, but who are in the credit phase-in range, tend to increase
their hours worked.25 These individuals receive larger credits by working more.
Here the substitution effect of the credit overcomes the income effect. In general, this
effect to encourage individuals already working to work more is much smaller than
the effect of increasing participation.
Individuals in the flat and phaseout ranges work less as a result of the credit.26 Here
the income effect (for those in the flat and phaseout ranges) and the negative
22
See, e.g., Stacy Dickert, Scott Hauser, and John Karl Scholz, “The Earned Income Tax Credit and Transfer
Programs: A Study of Labor Markets and Program Participation,” Tax Policy and The Economy 9 (1995): 40-41.
23
Bruce D. Meyer and Dan T. Rosenbaum, “Taxes, Welfare Programs, and Employment” (1998 Proceedings
of the 91st Annual Conference of the National Tax Association, 1999), 191. The period between 1991 and 1996 saw
a remarkable increase in the number of single mothers who were employed—e.g., a 10-percentage point increase
between 1991 and 1996 for single mothers with children under six. The study found that earned income credits
explained between 39 percent (using a measure of weekly employment) and 57 percent (using a measure of annual
employment) of the increase. This study is the first that we are aware of that analyzes the effect of state credits. The
study, however, does not analyze the effects of state credits independently of the federal credit. Maximilian D.
Schmeiser, “Expanding New York State’s Earned Income Tax Credit Program: The Effect on Work, Income, and
Poverty,” Applied Economics 44, no. 16 (2012): 2035-50, estimated the effects of the New York state credit on
hours worked, income, and poverty rates. It estimated that the New York credit, set at 30 percent of the federal
credit, increased employment of single mothers by between 7,125 and 21,363 and labor earnings between $63.4
million and $94.3 million.
24
See the summary of six studies in Table 3.4 in V. Joseph Hotz and John Karl Scholz, “The Earned Income
Credit,” 173-176, in Robert A. Moffitt, ed., in Means-Tested Transfer Programs in the United States, Chicago:
University of Chicago Press, January 2003. All of these studies show positive effects on labor force participation by
various segments of the population. See also Nada Eissa and Hilary W. Hoynes, “Behavioral Responses to Taxes:
Lessons from the EITC and Labor Supply,” Tax Policy and the Economy 20 (2006): 73-110.
25
See, e.g., Dickert, Hauser, and Scholz, “Earned Income Tax Credit.”
26
See, e.g., Edgar K. Browning, “Effects of the Earned Income Tax Credit on Income and Welfare,” National
Tax Journal 48 (1995): 23 (reduction in labor supply for families in the phaseout range may be large enough that
half of the families’ disposable incomes are reduced as a result); Janet Holtzblatt, Janet McCubbin, and Robert
Gillette, “Promoting Work Through the EITC,” National Tax Journal 47 (1994): 591. But see Nada Eissa and
Jeffrey B. Liebman, “Labor Supply Response to the Earned Income Tax Credit,” Quarterly Journal of Economics
111, no. 2 (1996): 605 (analyzing the effects of the increase in the credit enacted as part the Tax Reform Act of
1986). This study found no negative effect on the labor supply of those in the phaseout range. The authors
speculate that this may result from the fact that the credit typically does not affect take-home pay, but is received as
a lump sum in the next year. This study analyzed a period before the 1990 and 1993 expansions and before much of
the publicity about the credit.House Research Department Updated: March 2013
The Federal Earned Income Tax Credit and the Minnesota Working Family Credit Page 23
substitution effects (for those in the phaseout range) induce people to work fewer
hours. The effects probably are smaller than the credit’s incentive to increase labor
force participation and work effort by those in the phase-in range.
Studies also have found that the EITC induces low-income single women to report
self-employment income and for those in the phase-in range to report more self-
employment income (thereby maximizing their credits).27 It is unclear the extent to
which this effect represents increasing work effort (e.g., undertaking new
entrepreneurial efforts or increasing those efforts) or simply reflects reporting
previously unreported income to claim larger credits.
One study also found that single women who were induced to enter the workforce by
the credit expansion in 1993 did not generally end up taking “dead-end” type jobs,
but experienced wage growth after entering the workforce.28 This is an important
finding, since it has implications for the long-term cost-effectiveness of credits. If
many recipients remain mired in low-paying jobs, they could experience long periods
where they collect the credit.
The credit tends to discourage work by married women. One study estimates that the
credit reduced married women’s participation in the workforce by one percentage
point.29 This result occurs because of the income effect and because married couples
are more likely to be in the phaseout range of the credit where the work incentive
effects are negative, as noted above.
Finally, one study using an experiment with users of H&R Block tax preparation
services, found that tax preparers educating credit recipients about where they lay on
the credit’s curve (i.e., in the phase-in, flat, or phaseout ranges) was much more
effective in increasing work effort than was making the credit parameters more
generous.30 These effects applied to both self-employed individuals (who may simply
have been reporting more income) and wage earners.
27
Sara LaLumia, “The Earned Income Tax Credit and Reported Self-Employment Income,” National Tax
Journal 52, no. 2 (June 2009): 191-217; Emmanuel Saez, “Do Taxpayers Bunch at Kink Points?” American
Economic Journal 2, no. 3 (2010): 180-212 (finding clear evidence that credit recipients who report self-
employment income bunch at the first “kink” in the EITC schedule where the credit is maximized relative to the
amount of wages or self-employment income).
28
Molly Dahl, Thomas DeLeire, and Jonathon Schwabish, “Stepping Stone or Dead End? The Effect of the
EITC on Earnings Growth,” National Tax Journal 52, no. 2 (June 2009): 329-346.
29
Nada Eissa and Hillary Williamson Hoynes, “The Earned Income Tax Credit and the Labor Supply of
Married Couples,” National Bureau of Economic Research Working Paper No. 6852 (December 1998). This study
also concludes that the credit has little effect on the labor supply of married men, but because of the effects on
married women the credit causes family labor supply and pre-tax earnings to fall. The authors conclude that their
results “imply that the EITC is effectively subsidizing married mothers to stay at home * * *.” Id. at 30.
30
Raj Chetty and Emmanuel Saez, “Information and Behavioral Responses to the Taxation: Evidence from an
Experiment with EITC Clients at H&R Block,” National Bureau of Economic Research, working paper (September
7, 2008). This suggests that lack of understanding of the complicated credit structure is a barrier to its effectiveness
and that investing more on education efforts would be more cost-effective than making the credit formula more
generous. The authors’ estimates suggest these efforts could be more than ten times as cost-effective.House Research Department Updated: March 2013
The Federal Earned Income Tax Credit and the Minnesota Working Family Credit Page 24
The WFC and EITC combine with other features of the income tax, the payroll tax, and the
state’s welfare program to produce high marginal tax rates for individuals in some income
ranges. The 1998 restructuring of the WFC was intended to alleviate high marginal rates.
The 1998 restructuring of the WFC reduced high marginal tax rates31 that resulted from the
interaction of the federal and state income tax systems and MFIP, the state’s TANF program.
Single parents with two children who worked full-time and earned between $6.00 and $8.00 per
hour faced high marginal tax rates, sometimes exceeding 100 percent, due to the loss of MFIP
benefits (64 percent marginal rate), the phaseout of the federal earned income credit and the state
working family credit (25.3 percent), and the payment of state and federal income and payroll
taxes (28.7 percent). The 1998 restructuring introduced a second tier to the WFC, which began
to phase in when income reached the level at which the MFIP grant was completing its phaseout,
and single parents had incomes high enough to owe federal and state income taxes. In tax year
1998, an individual whose income went from $7.00 per hour to $8.00 per hour would lose
eligibility for MFIP, and begin to owe federal and state income taxes. These costs of getting a
raise in pay were offset by an increase in the WFC, due to implementation of the second tier.
Table 5 shows the effect of the restructuring on a single parent of two children in tax year 1998,
the year the restructuring took effect, at various wage levels starting at $5.15 per hour, the
minimum wage in 1998. Before the restructuring, a wage increase from $6.00 to $7.00 per hour
would have resulted in increased earnings of $2,080 ($14,560 minus $12,480), but increased
resources of only $42 after factoring in the phaseout of the EITC and WFC, the phaseout of the
MFIP grant, and the imposition of income and payroll taxes. This represents a marginal tax rate
of 98 percent.
31
Marginal rates refer to the share of an increase in income that is paid in tax.You can also read