Musculoskeletal disorders and computer work - The impact of workstation layout on posture and muscle load of the upper limbs REPORT - IRSST
←
→
Page content transcription
If your browser does not render page correctly, please read the page content below
RESEARCH PROJECTS
                                   STUDIES AND
Musculoskeletal disorders
and computer work
The impact of workstation layout
on posture and muscle load
of the upper limbs

Alain Delisle
Christian Larivière
André Plamondon
Daniel Imbeau

R-445                                        REPORT
Established in Québec since 1980, the Institut de recherche Robert-
Sauvé en santé et en sécurité du travail (IRSST) is a
scientific research organization known for the quality of its work and
the expertise of its personnel.
OUR RESEARCH
is working for you!
MISSION
왘 To contribute, through research, to the prevention of
industrial accidents and occupational diseases as well
as to the rehabilitation of affected workers.
왘 To offer the laboratory services and expertise necessary
for the activities of the public occupational health and
safety prevention network.
왘 To disseminate knowledge, and to act as scientific
benchmark and expert.
Funded by the Commission de la santé et de la sécurité
du travail, the IRSST has a board of directors made up
of an equal number of employer and worker representa-
tives.
TO FIND OUT MORE…
Visit our Web site for complete up-to-date information
about the IRSST. All our publications
can be downloaded at no charge.
www.irsst.qc.ca
To obtain the latest information on the research carried
out or funded by the IRSST, subscribe to Prévention au
travail, the free magazine published jointly by the
IRSST and the CSST.
Subscription: 1-877-221-7046
IRSST – Communications Division
505, De Maisonneuve Blvb West
Montréal (Québec)
H3A 3C2
Telephone: 514 288-1551
Fax: 514 288-7636
www.irsst.qc.ca
Institut de recherche Robert Sauvé en
santé et en sécurité du travail,
January 2006RESEARCH PROJECTS
STUDIES AND
Musculoskeletal disorders
and computer work
The impact of workstation layout
on posture and muscle load
of the upper limbs
Alain Delisle, Christian Larivière et André Plamondon,
Safety Ergonomics, IRSST
Daniel Imbeau, École Polytechnique de Montréal
REPORT
Disclaimer
The IRSST makes no guarantee
regarding the accuracy, reliability
or completeness of the information
contained in this document. In no
case shall the IRSST be held
responsible for any physical or
psychological injury or material
damage resulting from the use of
this information.
Note that the content of the docu-
ments is protected by Canadian
intellectual property legislation.
Clic Research
www.irsst.qc.ca
This publication is available free
of charge on the Web site.
This study was financed by the IRSST. The conclusions and recommendations are those of the author.IN CONFORMITY WITH THE IRSST’S POLICIES The results of the research work published in this document have been peer-reviewed
IRSST Musculoskeletal disorders and office automation: the impact of office furniture on posture and   i
      muscle load on the upper limbs

                                            ABSTRACT
The objective of this study is to determine if the use of height-adjustable office furniture offering
forearm support on the work surface results in a reduction in muscle load while minimizing the
impact on the posture of the upper limbs. Eighteen subjects performed computer work for 20
minutes, alternating between keyboard work and mouse work, with three different
office workstations: a single-surface workstation with independent monitor support, completely
adjustable in height, providing support for the forearms (Workstation A); a workstation with an
independent keyboard tray, with independent monitor support, completely adjustable in height
(Workstation B); and a workstation with keyboard tray, not height-adjustable (Workstation C).
Surface electromyography of four muscles (non-dominant and dominant trapezius, anterior
deltoid, extensor digitorum communis) and three-dimensional kinematics of the dominant upper
limb and head were used to compare the workstations.
The workstation with a single adjustable surface and offering forearm support (Workstation A)
resulted in (1) a reduction in muscle load on the non-dominant trapezius, (2) less muscle load on
the anterior deltoid during mouse work compared to the standard workstation (Workstation C),
and (3) an increase in muscle load on the extensor digitorum communis. With respect to upper
limb posture, Workstation A showed (1) smaller wrist extension compared to Workstation C
during mouse work, and (2) greater flexion and abduction of the shoulder during keyboard work.
No effect from the different workstations on head posture was observed.

The absence of any effect from office furniture on the activity of the dominant trapezius with the
workstation permitting forearm support is rather surprising since, according to several studies, a
reduction in muscle load on the dominant trapezius is reported with the use of an armrest.
However, our study is distinguished by an important difference: the work task studied involved
work alternating between the mouse and the keyboard, while in most previous studies, the task
involved only one type of input interface at a time (keyboard or mouse).

The increase in muscle load on the extensor digitorum with Workstation A combined with a
decrease in the muscle load on the anterior deltoid during use of the mouse corresponds in a way
to a transfer from a proximal strategy to a distal strategy for the performance of mouse work. It
therefore seems that the use of forearm support can be beneficial at the level of the neck/shoulder
region to the detriment of the wrist/forearm region. A workstation permitting alternation between
mouse work with the forearm supported and not supported would therefore likely be a promising
alternative. This would permit alternating the greatest muscle loads between the muscles of the
forearm and the muscles of the neck/shoulder region in order to provide intermittent rest periods.
IRSST Musculoskeletal disorders and office automation: the impact of office furniture on posture and iii
muscle load on the upper limbs
TABLE OF CONTENTS
List of tables................................................................................................................................... iv
1. Introduction.............................................................................................................................1
2. Objectives ...............................................................................................................................3
3. Methodology ...........................................................................................................................5
3.1 Subjects ..........................................................................................................................5
3.2 Procedures......................................................................................................................5
3.3 Measurement Techniques ..............................................................................................7
3.3.1 Electromyography..............................................................................................7
3.3.2 Kinematics .........................................................................................................8
3.3.3 Perception ........................................................................................................10
3.4 Data Analysis ...............................................................................................................10
4. Results...................................................................................................................................13
4.1 Effect on muscle load...................................................................................................13
4.1.1 Amplitude Probability Distribution Function (APDF) ....................................13
4.1.2 Exposure Variation Analysis (EVA) ...............................................................14
4.1.3 Analysis of muscle rest ....................................................................................20
4.2 Effect on posture ..........................................................................................................22
4.3 Effect on perception.....................................................................................................23
5. Discussion .............................................................................................................................26
5.1 Methodology ................................................................................................................26
5.2 Effect of the workstation..............................................................................................27
5.3 Limitations of the study ...............................................................................................29
6. Conclusion ............................................................................................................................31
References......................................................................................................................................33iv Musculoskeletal disorders and office automation: the impact of office furniture on posture and - IRSST
muscle load on the upper limbs
LIST OF TABLES
Table 1. The virtual anatomical landmarks digitized for every segment.........................................9
Table 2. Average percentage of time (standard deviation) spent with each interface to perform
the task according to the workstation and the average for all three workstations. ................13
Table 3. Average values (standard deviation) for the APDF for the different muscles (expressed
in percentage of the MVE).....................................................................................................14
Table 4. Average values (standard deviations) for the different EVA intensity and duration
classes for the non-dominant trapezius (expressed in percentage of total exposure time). ...16
Table 5. Average values (standard deviations) for the different EVA intensity and duration
classes for the dominant trapezius (expressed in percentage of total exposure time). ..........17
Table 6. Average values (standard deviations) for the different EVA intensity and duration
classes for the anterior deltoid (expressed in percentage of total exposure time). ................18
Table 7. Average values (standard deviations) for the different EVA intensity and duration
classes for the extensor digitorum communis (expressed in percentage of total exposure
time). ......................................................................................................................................20
Table 8. Average values (standard deviations) for the number of gaps and the time at
rest for the EMG activity of the dominant and non-dominant trapezius
normalized for the maximal reference contraction. ....................................................... 21
Table 9. Average values (standard deviation) for the angles (o) in the 10th, 50th and
90th %ile (APDF) corresponding to the different joints and types of
workstation..................................................................................................................... 24IRSST Musculoskeletal disorders and office automation: the impact of office furniture on posture and v
muscle load on the upper limbs
LIST OF FIGURES
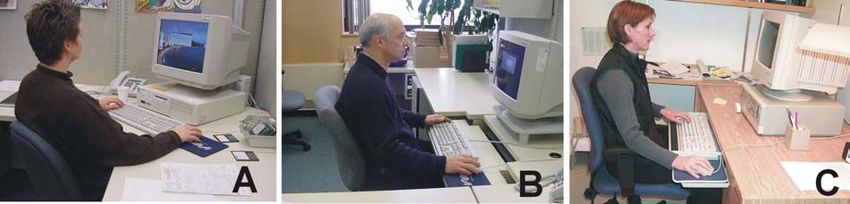
Figure 1. Comparison of the three workstations¶: (A) a single-surface workstation with
independent monitor support, completely adjustable in height, providing support for the
forearms (B) a workstation with an independent keyboard tray, with independent monitor
support, completely adjustable in height; (C) a workstation with an independent keyboard
tray, with independent monitor support, non-adjustable. ........................................................5
Figure 2. Procedures to produce the reference muscle contractions to calibrate the EMG signal. .8
Figure 3. Layout of the external landmarks (on the left) and definition of the junctions and the
local referential coordinate system used to define the three-dimensional joint angles (on the
right). ............................................................................................................................9
Figure 4. Exposure Variation Analysis (EVA). Typical example of the results of this type of
analysis. It should be noted that the more the distribution was in the low intensity and short
duration classes, the lower the physical exposure. ................................................................12
Figure 5. APDF of the anterior deltoid for the 50th and 90th percentile during keyboard and
mouse use according to each workstation..............................................................................15
Figure 6. Percentage of time spent in the (A) 0.3 - 1.0% MVE and (B) 1.0 - 3.0% MVE intensity
classes and in the (C) 0.0-0.3 s. and (D) 3-7 s duration classes for the anterior deltoid for
each interface and according to each workstation. ................................................................19
Figure 7. The cumulated time at rest in the EMG activity of the non-dominant trapezius for each
interface according to each workstation. ...............................................................................22
Figure 8. The values for extension angles (A) and wrist deviation (B), and the values for flexion
(C) and abduction (D) angles for the shoulder for the 50th percentile during use of each
input interface according to workstation................................................................................25IRSST Musculoskeletal disorders and office automation: the impact of office furniture on posture and 1
muscle load on the upper limbs
1. INTRODUCTION
Since the early nineties, a growing number of people have been using personal computers, both
for their work and for their personal use. The introduction of computers has had major
consequences on office work. For example, twenty years ago, typical office work involved a
range of activities, including reading, writing, typing, etc. Because of the constant change in
activities, there were natural short breaks, and the activities themselves were sufficiently varied
to produce changes in posture and provide a form of variation in the nature of the mental, visual,
and muscle activity. Today, it is possible to carry out many of these activities using a computer
without ever having to move from the workstation. In addition to this change in the nature of the
work, there are more and more significant time constraints, and complaints about various health
problems have begun to appear. Disorders involving the shoulders and neck, and the upper limbs
in particular are associated with computer work (Carter and Banister 1994; Grieco et al. 1998).
Workstation layout and work organization can be sources of musculoskeletal disorders.
Workstation layout can, for example, force people to adopt poor posture, and/or not provide
support, and work organization can, for example, limit the variations in work and lead to the
adoption of prolonged static positions. Although this type of work entails a low level of muscle
activation, it has been recognized that this type of muscle contraction can lead to chronic pain
when maintained over long periods of work [see the literature review in Sjogaard and Sogaard
1998 on this subject]. In fact, it appears that partial obstruction of the blood vessels can result in
fatigue and degeneration of the muscle fibres that are recruited at low intensity and over long
periods of time ("Cinderella fibres" hypothesis, Sjogaard and Sogaard 1998). These observations
seem to be particularly well documented for the trapezius, which could explain the pain often
reported in the neck/shoulder region in association with computer work.
It therefore seems important to develop ways of permitting complete relaxation of the muscles
involved in work as often as possible. Furthermore, the adoption of pauses during work have
often been recommended in order to avoid discomfort (Fisher et al. 1993; Mclean et al. 2001;
Sundelin and Hagberg 1989). However, the introduction of pauses during work is difficult to
implement, and the frequency and optimal length of these pauses have not been established.
Another proposed means is to favour support for the upper limbs during work in order to
increase opportunities to relax the muscles involved. Support can be provided in various ways,
either at the level of the wrist or at the level of the forearm (on an adjustable or fixed armrest, or
on the work surface) and at the elbow (on the armrest of the chair). The literature contains data
showing the effectiveness of the use of armrests in reducing the electromyographic activity
(EMG) of the trapezius muscle, and other upper limb muscles (Aaras et al. 1997; Schuldt et al.
1987; Feng et al. 1997; Fernstrom and Ericson 1997; Hasegawa and Kumashiro 1998; Lintula et
al. 2001; Visser et al. 2000;Wells et al. 1997). However, although this beneficial effect has been
demonstrated, the consequences of the use of armrests on the wrist and shoulder postures as well
as on the load on different muscle areas have not, to our knowledge, been documented
simultaneously. According to Wells et al. (1997), support of the forearm or elbow is preferable
for mouse work. In the study by Aaras et al., (1997) support of the forearms was provided on the
work surface in front of the keyboard by moving it away from the front edge of the work surface.
These authors reported a beneficial effect for the right and left trapezius for keyboard work, but
did not document the impact on the other muscle regions, nor for mouse work. This
configuration also offered the possibility of working with support for all the different activities
performed, i.e., for keyboard work, mouse work, and for writing tasks. The use of the armrest of2 Musculoskeletal disorders and office automation: the impact of office furniture on posture and - IRSST
muscle load on the upper limbs
a chair, and even an adjustable armrest, did not provide support for all these activities, which are
often performed alternately. Moreover, this type of configuration resulted in more distance from
the keyboard, which could also have positive consequences on head posture. For example, for a
person who is not a touch typist, greater distance from the keyboard could limit neck flexions
associated with looking at the keyboard. The choice of office furniture and the layout of
workstations can therefore have considerable repercussions on muscle load for individuals.
The purpose of the study is therefore to compare three types of workstation (one providing
support for the forearms on the work surface) with respect to their impact on the posture
kinematics of the entire upper limb and on the muscle load for four muscles.IRSST Musculoskeletal disorders and office automation: the impact of office furniture on posture and 3
muscle load on the upper limbs
2. OBJECTIVES
The main objective of this activity is to document the impact of three types of office furniture on
the three-dimensional kinematics of the dominant upper limb and the EMG activity of four
muscles.
The following question is asked: Does the use of height-adjustable office furniture offering
forearm support on the work surface result in a reduction in muscle load while minimizing
impact on the posture of the upper limbs?IRSST Musculoskeletal disorders and office automation: the impact of office furniture on posture and 5
muscle load on the upper limbs
3. METHODOLOGY
The procedure we followed consisted of an experimental assessment in the laboratory with office
employees whose jobs include a large component of computer work.
3.1 Subjects
Twenty subjects volunteered to take part in the study. Two subjects had to be excluded because
of technical problems. Of the 18 remaining subjects, 15 were women and 3 men, with a mean
age of 37 (23 to 53), a mean height of 1.66 m (1.49 to 1.85 m), and a mean weight of 67.5 kg
(54.1 to 98.0 kg). The anthropometric data and individual characteristics for the subjects are
provided in appendix 1. Only one of the subjects was left-handed and he used the mouse with his
left hand. Nine of the subjects stated they were touch typists, and the other nine were not. All
subjects used a computer for most of their work duties.
3.2 Procedures
Three office workstations were compared (Figure 1):
1. a single-surface workstation with independent monitor support, completely adjustable in
height, providing support for the forearms (Workstation A, Figure 1A)
2. a workstation with an independent keyboard tray, with independent monitor support,
completely adjustable in height (Workstation B, Figure 1B)
3. a workstation with a keyboard tray that was not height-adjustable (Workstation C, Figure
1C)
The position of the monitor was kept constant for the three workstations in order to isolate the
effects of the workstations. Unlike what is shown in Figure 1, the chair was always the same for
the three layouts. The armrest component of the chair was adjusted according to the type of
workstation. The monitor was positioned at eye level, approximately one arm's length from the
subject so that the eyes were even with the top third of the screen, with the monitor slightly tilted
to the rear. The backrest of the chair was adjusted in height to provide lumbar support, with an
inclination between 100o and 110o. No wrist supports were used.
With Workstation A, the keyboard and the mouse had to be moved away from the edge of the
desk in order to permit forearm support on the desk surface. The rear legs of the keyboard had to
be left down, and the mouse was kept as close as possible to the keyboard on the dominant hand
side. The entire work surface was the same height. The chair armrest was lowered so that the
chair could be moved forward as close as possible to the desk, in order to permit forearm support
on the desk surface. The height of the seat was adjusted so that the feet were flat on the floor,
with knees at a 90o angle. The chair was adjusted in the same way for workstations A and B,
except for the armrests.
Figure 1. Comparison of the three workstations¶: (A) a single-surface workstation with
independent monitor support, completely adjustable in height, providing support
for the forearms (B) a workstation with an independent keyboard tray, with
independent monitor support, completely adjustable in height; (C) a workstation6 Musculoskeletal disorders and office automation: the impact of office furniture on posture and - IRSST
muscle load on the upper limbs
with an independent keyboard tray, with independent monitor support, non-
adjustable.
These photos do not show the actual context of the study.
With Workstation B, the keyboard was aligned with the edge of the keyboard tray, with the rear
legs down and adjusted to elbow height (elbows flexed 90o). The chair armrests were adjusted in
height and width to provide elbow support. The mouse was kept as close as possible to the
keyboard, on the keyboard tray, on the dominant hand side.
The keyboard tray for Workstation C was not height-adjustable, but the heights of the seat and
the chair armrests were adjusted so that the elbow was at keyboard height (elbow bent 90o). The
chair armrests were adjusted in height and width to provide elbow support. The mouse was kept
as close as possible to the keyboard, on the keyboard tray, on the dominant hand side.
For each workstation, the subjects performed a series of tasks involving moving and pointing at
objects, entering data in forms and standard word processing, tasks that required alternating
keyboard work and mouse work. Some of the tasks required the inputting of text read from
paper, and others involved writing on paper a text read on the monitor. The order of presentation
of the different parts was random. The time allowed for the performance of the tasks was 20
minutes, and if a subject completed all the tasks in less than 20 minutes, additional tasks already
performed were presented to the subject randomly. Therefore all the subjects did not perform
exactly the same work on the computer, but they all worked 20 minutes. This situation is very
similar to a real work situation. Thanks to the optoelectronic system used, it was possible to
distinguish the phases when the mouse was used and those when the keyboard was used (see
section 3.3.1 below). A period of familiarization (15 minutes) with the different tasks was
allowed before the acquisition period. A pause of 10 minutes was provided between each
workstation and the order of presentation of the workstations was random. The total time for data
acquisition was approximately 2 h 30 (preparation of the subject: 45 minutes, familiarization
with the task: 15 minutes, acquisition: 60 minutes, pauses: 20 minutes.).IRSST Musculoskeletal disorders and office automation: the impact of office furniture on posture and 7
muscle load on the upper limbs
3.3 Measurement Techniques
3.3.1 Electromyography
Four pairs of differential pre-amplified electrodes (gain: 1000) with a band-pass filter of 20 to
500 Hz (Delsys, Boston, MA) were used to measure EMG activity. The signal was recorded at a
sampling frequency of 1024 Hz and digitized using an analogue-to-digital 12-bit acquisition card
(National Instrument, DAQ-E). A high-pass digital filter with a cut-off frequency of 30 Hz was
used to eliminate the electrocardiac signal, also reducing the potential influence of movement on
the signal (Hansson et al., 2000). The RMS (root mean square) amplitude of the signal was
calculated on successive 100 ms windows.
The EMG activity of the right and left trapezius muscles, of the dominant anterior deltoid and of
the extensor digitorum communis/wrist extensor of the dominant arm were recorded according to
procedures described in the literature. The choice of these muscles was based on the fact that
many studies on computer work have examined these muscles (Bystrom et al., 2002; Jensen et
al., 1998; Keller and Strasser, 1998; Laursen and Jensen 2000; Visser et al., 2002). For example,
for the trapezius, the position of the electrodes followed the recommendations of Jensen et al.
(1993). Briefly, the midpoint between the bony landmarks at C7 and the acromion was
measured, and the pair of electrodes was placed two centimetres on either side of this midpoint.
For the deltoid and the extensor digitorum communis, the electrodes were positioned according
to the recommendations of Basmajian and Blusmenstein (1983). Three maximal reference
contractions (duration: 5 s) for each muscle (trapezius, anterior deltoid, extensor digitorum
communis) were performed to calibrate the EMG signal. For the second and third maximal
contractions, a feedback of the maximum strength attained in the first contraction, increased by
10%, was provided to the subjects to encourage them to apply maximum effort (Baratta et al.
1998).
For the trapezius muscles, the subjects stood with one arm abducted at 90° with a strap attached
to the floor at one end and to the elbow at the other end in order to perform an abduction of the
shoulder against static resistance (strap), according to a procedure described by Mathiassen et al.
(1995). Only one trapezius was tested at a time (Figure 2A). For the extensor digitorum
communis/wrist extensor, a procedure similar to that described by Akesson et al. (1997) was
used. The subject was sitting, with the arm flexed and the forearm pronated, resting on a table,
with the hand unsupported, the wrist in a neutral position and the fingers extended. A strap,
placed over the dorsal side of the hand and attached to a dynamometer providing static resistance
to the subject, who applied maximum effort by attempting to extend the wrist (Figure 2B). For
the dominant anterior deltoid, the subject was sitting with the elbow flexed 90o, the arm flexed
45o. A strap over the arm just above the elbow placed perpendicular to the arm and attached to a
dynamometer provided static resistance against which the subject tried to flex the shoulder
(Figure 2C).8 Musculoskeletal disorders and office automation: the impact of office furniture on posture and - IRSST
muscle load on the upper limbs
Figure 2. Procedures to produce the reference muscle contractions to calibrate the EMG
signal.
3.3.2 Kinematics
An optoelectronic system (Optotrak 3020, Northern Digital inc., Waterloo, Ontario) was used to
determine the position and orientation of the hand, the forearm and the arm on the subject's
dominant side. A rigid body with three light emitting diodes (LEDs) was attached to each
segment, thus making it possible to determine their position and orientation in space at any time
(Figure 3). In addition, two LEDs separated by approximately 0.14 m were placed at the seventh
cervical vertebra (Figure 3).
Bony landmarks (virtual landmarks) were digitized using a pen-probe to construct a local
referential coordinate system for each segment. These virtual landmarks were associated with the
most appropriate rigid body (on the same segment) so they could be reconstructed throughout the
entire movement. Table 1 lists the digitized virtual landmarks and Figure 3 illustrates these
landmarks.
Figure 3 also illustrates the local referential coordinate system for each segment. More
specifically, the longitudinal axis of the hand was determined by a vector joining the mid-point
between the two styloid processes and the third metacarpus. The transverse axis of the hand was
the same as that of the forearm, and was determined by the vector joining the styloid process of
the radius with that of the ulna. The sagittal axis of the hand was determined by the vector
product of the transverse and longitudinal axes. The longitudinal axis of the forearm was
determined by a vector joining the midpoint between the lateral and medial epicondyles and the
midpoint between the styloid processes. The sagittal axis of the forearm was perpendicular to the
longitudinal and transverse axis. The transverse axis of the arm was constructed using the inside
and outside epicondyles of the elbow. The longitudinal axis of the arm ran through the midpoint
between the epicondyles and the midpoint between two points in front of and behind the
shoulder 0.03 m under the acromion. The sagittal axis of the arm was perpendicular to the
transverse and longitudinal vectors. The transverse axis of the segment called the shoulder girdle
ran through the cervicothoracic junction (C7/T1, determined according to the method described
in Chaffin and Andersson (1991)), and through the midpoint between two points in front of and
behind the shoulder 0.03 m below the acromion. The sagittal axis of the shoulder girdle was
defined by the two points in front of and behind the shoulder. The longitudinal axis of theIRSST Musculoskeletal disorders and office automation: the impact of office furniture on posture and 9
muscle load on the upper limbs
shoulder girdle was perpendicular to the sagittal and transverse axes. The longitudinal axis of the
head extended from the cervicothoracic junction (C7/T1) to the top of the head. The tip of the
nose provided a first estimation of the sagittal axis of the head, and its vector product with the
longitudinal axis gave the transverse axis of the head. A system of axes was also constructed on
the trunk; the transverse axis was parallel to the LEDs placed on either side of C7 and ran
through the C7/T1 junction, and its corresponding longitudinal axis vertically, and its sagittal
axis was the vector product of the previous axes.
Table 1 – The virtual anatomical landmarks digitized for every segment
Segment Digitized landmarks
Hand Distal tip of the 3rd metacarpus
Styloid process of the radius
Forearm
Styloid process of the ulna
Inside epicondyle
Arm
Outside epicondyle
A point anterior to and 0.03 m below the
Shoulder girdle (name given to a segment acromion
between C7 and the shoulder joint) A point posterior to and 0.03 m below the
acromion
Head (segment between C7 and the top of the The top of the head
head) The tip of the nose
Figure 3. Layout of the external landmarks (on the left) and definition of the junctions
and the local referential coordinate system used to define the three-dimensional
joint angles (on the right). [picture labels: Front of the shoulder / rigid body (3
LEDs) / LED / virtual landmark / junction / local referential system]
The joint angles were calculated from the local referential coordinate system described above,
according to the approach described by Grood and Suntay (1983). Thus, the flexion/extension of10 Musculoskeletal disorders and office automation: the impact of office furniture on posture and - IRSST
muscle load on the upper limbs
the wrist was defined by the angle between the longitudinal axes of the hand and the forearm
around the transverse axis of the forearm, with extension positive. The radial/ulnar deviation was
defined by the angle between the longitudinal axis of the hand and the transverse axis of the
forearm around an axis perpendicular to the longitudinal axis of the hand and transverse axis of
the forearm, with ulnar deviation positive. The flexion/extension of the shoulder was defined by
the angle between the longitudinal axes of the shoulder girdle and the arm around the transverse
axis of the shoulder girdle, with flexion positive. Internal/external rotation of the arm was
defined by the angle between the transverse vectors of the shoulder girdle and the arm around the
longitudinal axis of the arm (an angle of 0o corresponding to the neutral position, with external
rotation positive). Abduction/adduction of the shoulder corresponded to the angle between the
longitudinal axis of the arm and the transverse axis of the shoulder girdle around an axis
perpendicular to the longitudinal axis of the arm and the transverse axis of the shoulder girdle.
The flexion/extension angle of the head was defined by the angle between the longitudinal axis
of the head and a longitudinal axis of the trunk (vertically), around the transverse axis of the
trunk. The rotation of the head corresponded to the angle between the transverse axis of the head
and the transverse axis of the trunk around the longitudinal axis of the head, and the lateral
inclination of the head was the angle between the longitudinal axis of the head and the transverse
axis of the trunk around an axis perpendicular to the longitudinal axis of the head and transverse
axis of the trunk.
Finally, in order to be able to determine when the hand was on the mouse or on the keyboard,
rigid bodies with LEDs had also been placed on the keyboard and the mouse. The four corners of
the keyboard, as well as the three extremities of the mouse, were digitized using a pen-probe. It
was therefore possible to compare the position of the hand (right or left) in relation to the
keyboard or the mouse.
3.3.3 Perception
In order to evaluate the perceived effect of the workstations, three questions were asked of each
subject after they used each workstation, with an evaluation on a scale of 1 to 10. Two questions
dealt with perceived tension (1= no tension, 10 = extreme tension), one for the neck/shoulder
region, the other for the hands/wrist/forearm region. The third question was on an estimation of
the level of comfort with each workstation (1= very comfortable, 10 = extremely uncomfortable).
3.4 Data Analysis
In order to analyze and process the data so that the effect of each experimental condition (three
workstations) on the different muscles could be appreciated, we used three types of analysis. The
same analyses were carried out on the EMG signal normalized according to a maximal reference
contraction (MVE), independently for mouse work and keyboard work. It was only possible to
analyze the portions of the task performed with the mouse and the keyboard, because the
portions of the task involving writing could not be dissociated from movements from one
interface to another.
First of all, the Amplitude Probability Distribution Function (APDF) (Jonsson 1978) was used to
calculate the EMG activity levels corresponding to the 10th (static level), 50th (median level)
and 90th (maximum level) percentile (%ile). In other words, the amplitude values correspondingIRSST Musculoskeletal disorders and office automation: the impact of office furniture on posture and 11
muscle load on the upper limbs
to these percentiles represent activity levels that are exceeded 90%, 50% and 10% of the time,
respectively.
Second, an Exposure Variation Analysis (EVA) (Mathiassen and Winkel, 1991) was also
performed (Figure 4). This analysis made it possible to describe the EMG signal as a distribution
of predetermined intensity classes (EMG amplitude, X-axis) according to a distribution of
predetermined duration classes (temporal properties of the signal, Y-axis). The Z-axis
corresponds to the time cumulated in each combination of intensity and duration classes
expressed as a percentage of the total measurement time. The classes on the X- and Y-axes used
were the same as those described by Mathiassen and Winkel (1991). Although the EVA method
seems to contain sufficiently complete information on exposure, the data are not reduced to a
single index (n = 36 for the EMG analyses), which makes it difficult to use them to compare
processes or to do an assessment of a change using measurements repeated over time. To this
end, we used an approach found in the literature (Jensen et al., 1999) which consists of doing a
summary of the intensity classes for each duration class and the summary of the duration classes
for each intensity class, which reduces the number of comparisons to 12 in the case of the EMG.
Thirdly, analyses of the number of gaps (muscle rest) in the activity pattern (EMG "gap
analysis": Veiersted et al., 1990, Hansson et al., 2000), and of the portion of time at rest
(Hansson et al., 2000) were performed for the right and left trapezius only. A gap in the EMG
activity pattern is defined as being a period equal or greater in duration to 0.2 s with an activation
level less than 0.3% of the MVE. The total number of these gaps is the first index, and the
summary of the duration of the gaps constitutes the second index.
For posture analysis, EVA similar to that described above, in addition to values for the 10th, 50th
and 90th %iles for the angles (APDF), were used to determine the impact of the three conditions
on the six joint angles calculated. This type of analysis has not yet been used to describe
kinematic data, and the intensity and duration classes for maintaining postures had to be defined.
The intensity classes chosen vary from joint to joint since the amplitudes measured are clearly
different, but the duration classes for the maintenance of postures are the same. As for the EMG,
each of these analyses was performed independently for keyboard work and mouse work.
Analyses of variances for repeated measures were performed to determine the effect of the
workstation (Workstation effect), and the effect of the input interface (Interface effect) as well as
their interaction (Workstation × Interface). For the kinematic data, analyses were performed on
the APDF values for angle only. Multiple post-hoc comparisons using the Bonferroni correction
were performed to identify significant differences between the different workstations and double
interactions. A level of significance p ≤ 0.05 was used. Finally, for the three perception
questions, the Friedman analysis of variance by ranks was used to determine if perceptions
differed from workstation to workstation (Workstation effect).12 Musculoskeletal disorders and office automation: the impact of office furniture on posture and - IRSST
muscle load on the upper limbs
Figure 4. Exposure Variation Analysis (EVA). Typical example of the results of this type of
analysis. It should be noted that the more the distribution was in the low
intensity and short duration classes, the lower the physical exposure. [picture
labels: % Work time / Intensity levels / Time periods (sec)]IRSST Musculoskeletal disorders and office automation: the impact of office furniture on posture and 13
muscle load on the upper limbs
4. RESULTS
On average, the task performed required the use of the keyboard 68% of the time, the mouse
18% of the time, and 14% of the time was used for writing and moving from one interface to the
other (Table 2). The average time spent for each interface was similar for all the workstations,
except for Workstation C, which involved a little more time for keyboard work (6% more), and a
little less for writing and other movements (6% less). Although the averages and standard
deviations were calculated for each input interface, only the overall averages (combining
keyboard and mouse) for each type of workstation will be presented in the result tables.
However, the most revealing Workstations × Interface interactions will be presented graphically.
Table 2. Average percentage of time (standard deviation) spent with each interface to
perform the task according to the workstation and the average for all three
workstations.
Keyboard Mouse Other
Workstation A 65.4 19.4 15.1
(10.1) (7.2) (10.8)
Workstation B 66.9 17.8 15.3
(15.2) (8.5) (10.4)
Workstation C 72.8 17.2 9.9
(12.2) (9.1) (9.0)
Average 68.4 18.2 13.5
(12.9) (8.2) (10.3)
4.1 Effect on muscle load
4.1.1 Amplitude Probability Distribution Function (APDF)
The extensor digitorum communis turned out to be the only muscle for which the amplitude of
the EMG signal was affected by the type of workstation (Workstation effect, Table 3).
Workstation A resulted in greater "static" (10th %ile) and "median" (50th %ile) EMG amplitudes
for the extensor in the order of 1%, while the "maximum" amplitude (90th %ile) was weaker for
Workstation B, in the order of 2%. Moreover, the anterior deltoid was affected differently
according to the workstation-interface combination used (significant interaction, Table 3). In
fact, as shown in Figure 5, Workstation C resulted in lower "median" (50th %ile) and
"maximum" (90th %ile) activation amplitudes for the deltoid during keyboard work, the most
remarkable difference being the "maximum" activation amplitude, which was 4% lower than that
for Workstation A. However, during mouse work, Workstation A resulted in "median" and
"maximum" amplitudes for the deltoid lower than those for Workstation C (Figure 5), by
approximately 2%. Finally, relative activation amplitude (MVE) for the extensor digitorum
communis were clearly the greatest (Table 3, 10th %ile: ~ 8% MVE; 90th %ile: ~ 24% MVE),
followed by those for the anterior deltoid (10e %ile: ~ 2% MVE; 90th %ile: ~ 9% MVE), and14 Musculoskeletal disorders and office automation: the impact of office furniture on posture and - IRSST
muscle load on the upper limbs
those for the dominant trapezius and the non-dominant trapezius, which had similar levels (10th
%ile: ~ 1.5% MVE; 90th%ile: ~ 7% MVE).
Table 3. Average values (standard deviation) for the APDF for the different muscles
(expressed in percentage of the MVE).
Bureau A Bureau B Bureau C Effet A vs B A vs C B vs C Effet Effet
Bureau Interface BxI
Trapèze 10e 1 2 2 0.290 0.001 0.787
non-dominant (1) (1) (1)
50e 3 4 4 0.700 0.001 0.854
(3) (2) (2)
90e 7 7 7 0.596 0.002 0.757
(4) (3) (3)
Trapèze 10e 2 2 2 0.842 0.011 0.228
dominant (2) (2) (1)
50e 4 4 3 0.508 0.005 0.834
(3) (3) (2)
90e 8 7 6 0.123 0.110 0.942
(4) (4) (3)
Deltoïde 10e 2 2 2 0.156 0.048 0.005
antérieur (3) (3) (3)
50e 4 5 4 0.208 0.000 0.000
(5) (5) (4)
90e 10 10 9 0.333 0.006 0.000
(8) (7) (7)
Extenseur 10e 9 8 8 0.001 * * 0.157 0.436
des doigts (3) (2) (2)
50e 15 14 14 0.000 * * 0.969 0.292
(5) (4) (4)
90e 24 22 24 0.009 * * 0.113 0.277
(8) (6) (9)
[picture labels:
Workstation A / Workstation B / Workstation C / Workstation Effect / A vs B / A vs C / B vs C /
Interface Effect / W x I Effect
Non-dominant trapezius / 10th / 50th / 90th
Dominant trapezius / 10th / 50th / 90th
Anterior deltoid / 10th / 50th / 90th
Extensor digitorum / 10th / 50th / 90th]
So the information could be summarized in a single table, only the overall averages (combining keyboard and
mouse) for every type of workstation are presented here. However, these statistical results reflect the overall results.
4.1.2 Exposure Variation Analysis (EVA)
Given the nature of EVA, it is understood that a decrease in time in a given class of intensity or
duration necessarily implies an increase in time in another class of intensity or duration in orderIRSST Musculoskeletal disorders and office automation: the impact of office furniture on posture and 15
muscle load on the upper limbs
that the total is always 100% of the work time (sum of the percentage of work for all the classes).
In the presentation of the results and in the discussion, we will use the term "transfer" to describe
this phenomenon. It sometimes happens that the time transfer occurs from one specific class to
several other classes. It is therefore obvious that significant differences will be obtained only for
classes in which the largest changes occur.
Figure 5. APDF of the anterior deltoid for the 50th and 90th percentile during keyboard
and mouse use according to each workstation.
APDF 50th percentile for the anterior deltoid APDF 90th percentile for the anterior deltoid
7 14
6 12(%MVE)
EMG
EMG (%MVE)
5 10
4 Keyboard ard 8 Keyboard
3 Mouse 6 Mouse
2 4
1 2
0 0
A B C A B C
Non-dominant trapezius. The EVA reveals that the use of Workstation A was beneficial for the
non-dominant trapezius. Thus, with Workstation A, significantly less time was spent in the 3-7%
MVE intensity class (Table 4), and slightly more time (transfer) in the minimal and maximum
intensity classes (insignificant difference). The percentage of time spent with a very short
contraction time (0.0-0.3 s) was also longer with Workstation A compared to Workstation C
(Table 4), while less time was spent with contraction durations of 1 to 3 s.
Dominant trapezius. The type of workstation had almost no effect on the EVA variables for the
dominant trapezius, with only slightly (1%) more time spent in the maximum intensity class (>
15% MVE) with Workstation A compared to Workstation C (Table 5).
Anterior deltoid. Workstation A contributed to reducing muscle load on the deltoid by reducing
the percentage of time spent in the 3-7% MVE intensity class (significant difference with
Workstation B) and by increasing the percentage of time spent in the 0.3-1% MVE intensity
class (significant difference with Workstation C) (Table 6). However, the contraction duration
seemed longest for Workstation A, since less time was spent in the 0.0-0.3 s. duration class
(differences with workstations B and C) and since more time was spent in the 3-7 s. duration
class (difference with Workstation C). Figure 6A shows that the increase in time spent in the 0.3-
1% MVE intensity class with Workstation A occurred mostly during mouse work. In the same
way, the decrease in the time spent in the 0.0-0.3 s duration class and the increase in time in the
3-7 s. duration class with Workstation A occurred mostly during mouse work (Figure 6C and D
respectively).
Extensor digitorum. For the extensor digitorum, Workstation A had the effect of increasing
muscle load compared to Workstation B since less time was spent in the 7-15% intensity class,
and since more time was spent in the maximum intensity class (>15% MVE, Table 7).16 Musculoskeletal disorders and office automation: the impact of office furniture on posture and - IRSST
muscle load on the upper limbs
Workstation A also resulted in the longest contractions, since less time was spent in the 0.3-1 s.
duration class and more time was spent in the 3-7 s. duration class (Table 7).
Table 4. Average values (standard deviations) for the different EVA intensity and duration
classes for the non-dominant trapezius (expressed in percentage of total exposure
time).
Bureau A Bureau B Bureau C Effet A vs B A vs C B vs C Effet Effet
Bureau Interface BxI
Classes d'intensité (sommation des classes de durée)
0-0.3 % 6.0 1.5 0.8 0.079 0.047 0.043
(15.0) (5.0) (2.5)
0.3-1% 16.0 13.7 12.4 0.465 0.004 0.223
(20.6) (21.2) (15.7)
1-3 % 30.7 27.4 30.7 0.765 0.162 0.314
(19.4) (20.9) (24.0)
3-7 % 31.2 42.0 42.8 0.017 * * 0.013 0.094
(18.4) (23.4) (23.7)
7-15 % 13.5 14.3 12.5 0.876 0.016 0.951
(16.6) (20.5) (14.8)
> 15 % 2.6 1.1 0.8 0.075 0.080 0.092
(5.0) (2.0) (1.7)
Classes de durée (sommation des classes d'intensité)
0-0.3 s 16.8 14.5 13.7 0.006 * 0.002 0.518
(7.4) (6.6) (4.9)
0.3-1 s 43.1 37.0 36.6 0.031 0.000 0.730
(12.3) (12.8) (11.9)
1-3 s 22.3 26.5 27.0 0.007 * * 0.223 0.400
(7.3) (8.6) (7.5)
3-7 s 9.1 10.6 10.7 0.471 0.107 0.160
(6.6) (7.4) (7.8)
7-15 s 4.2 5.2 5.5 0.576 0.004 0.635
(6.2) (8.6) (6.4)
> 15 s 4.4 6.1 6.4 0.577 0.003 0.834
(11.2) (12.9) (10.0)
[picture labels:
Workstation A / Workstation B / Workstation C / Workstation Effect / A vs B / A vs C / B vs C /
Interface Effect / W x I Effect
Intensity classes (summary of duration classes)
Duration classes (summary of intensity classes)]
So the information could be summarized in a single Table, only the overall averages (combining keyboard and
mouse) for every type of workstation are presented here. However, these statistical results reflect the overall results.IRSST Musculoskeletal disorders and office automation: the impact of office furniture on posture and 17
muscle load on the upper limbs
Table 5. Average values (standard deviations) for the different EVA intensity and duration
classes for the dominant trapezius (expressed in percentage of total exposure
time).
Bureau A Bureau B Bureau C Effet A vs B A vs C B vs C Effet Effet
Bureau Interface BxI
Classes d'intensité (sommation des classes de durée)
0-0.3 % 1.0 1.3 1.2 0.937 0.116 0.775
(3.3) (4.2) (5.3)
0.3-1% 16.1 16.7 13.7 0.710 0.003 0.366
(24.3) (24.8) (19.6)
1-3 % 27.5 26.9 34.3 0.214 0.630 0.945
(18.2) (22.0) (22.5)
3-7 % 36.1 35.8 37.5 0.882 0.104 0.538
(18.3) (21.7) (21.2)
7-15 % 17.4 18.4 12.7 0.351 0.039 0.783
(19.9) (22.9) (19.6)
> 15 % 2.0 0.9 0.6 0.033 * 0.122 0.723
(3.4) (1.9) (1.2)
Classes de durée (sommation des classes d'intensité)
0-0.3 s 16.5 16.6 16.0 0.817 0.000 0.277
(6.7) (6.2) (5.9)
0.3-1 s 42.6 42.4 41.3 0.892 0.000 0.187
(13.9) (13.0) (12.9)
1-3 s 23.1 25.4 25.2 0.407 0.271 0.130
(8.0) (9.6) (6.8)
3-7 s 8.7 7.3 9.6 0.370 0.054 0.132
(7.3) (5.7) (8.0)
7-15 s 4.3 5.1 4.7 0.877 0.000 0.212
(7.6) (8.5) (7.2)
> 15 s 4.7 3.2 3.2 0.605 0.012 0.272
(8.7) (7.5) (7.4)
[picture labels:
Workstation A / Workstation B / Workstation C / Workstation Effect / A vs B / A vs C / B vs C /
Interface Effect / W x I Effect
Intensity classes (summary of duration classes)
Duration classes (summary of intensity classes)]
So the information could be summarized in a single Table, only the overall averages (combining keyboard and
mouse) for every type of workstation are presented here. However, these statistical results reflect the overall results.18 Musculoskeletal disorders and office automation: the impact of office furniture on posture and - IRSST
muscle load on the upper limbs
Table 6. Average values (standard deviations) for the different EVA intensity and duration
classes for the anterior deltoid (expressed in percentage of total exposure time).
Bureau A Bureau B Bureau C Effet A vs B A vs C B vs C Effet Effet
Bureau Interface BxI
Classes d'intensité (sommation des classes de durée)
0-0.3 % 0.0 0.0 0.0 / / /
(0.00) (0.00) (0.00)
0.3-1% 23.4 18.4 16.4 0.006 * 0.002 0.004
(31.09) (24.53) (21.97)
1-3 % 30.2 28.6 35.6 0.018 * 0.257 0.002
(24.08) (24.09) (24.93)
3-7 % 22.3 28.4 25.0 0.033 * 0.031 0.113
(16.70) (19.58) (15.78)
7-15 % 17.2 17.1 16.1 0.863 0.031 0.001
(16.72) (17.34) (15.65)
> 15 % 6.9 7.5 6.9 0.822 0.281 0.011
(17.60) (20.13) (16.72)
Classes de durée (sommation des classes d'intensité)
0-0.3 s 16.1 18.9 19.8 0.000 * * 0.074 0.050
(8.46) (8.44) (9.16)
0.3-1 s 40.1 43.6 44.5 0.157 0.009 0.047
(18.00) (16.81) (15.37)
1-3 s 20.3 20.7 22.0 0.442 0.440 0.190
(7.87) (7.94) (10.04)
3-7 s 11.5 8.9 8.1 0.037 * 0.003 0.041
(10.24) (10.39) (9.31)
7-15 s 6.2 5.2 3.2 0.124 0.511 0.390
(9.03) (8.50) (6.27)
> 15 s 5.8 2.8 2.4 0.162 0.583 0.178
(12.58) (6.58) (9.87)
[picture labels:
Workstation A / Workstation B / Workstation C / Workstation Effect / A vs B / A vs C / B vs C /
Interface Effect / W x I Effect
Intensity classes (summary of duration classes)
Duration classes (summary of intensity classes)]
So the information could be summarized in a single Table, only the overall averages (combining keyboard and
mouse) for every type of workstation are presented here. However, these statistical results reflect the overall results.IRSST Musculoskeletal disorders and office automation: the impact of office furniture on posture and 19
muscle load on the upper limbs
Figure 6. Percentage of time spent in the (A) 0.3 - 1.0% MVE and (B) 1.0 - 3.0% MVE
intensity classes and in the (C) 0.0-0.3 s. and (D) 3-7 s duration classes for the
anterior deltoid for each interface and according to each workstation.
Intensity class 0.3-1.0% MVE Intensity class 1.0 % - 3.0 % MVE
35 A 45 B
30 40
35
25
Time (%) 30
20 25
Keyboard 20 Keyboard
15
Mouse Mouse
15
10
10
5
5
0 0
Time (%)
A B C A B C
Duration class 0.0-0.3 s. Duration class 3-7 s.
25 C 18 D
16
20 14
12
15
10
Keyboard Keyboard
10 Mouse Time8 (%) Mouse
6
5 4
2
0 0
Time (%) A B C A B C20 Musculoskeletal disorders and office automation: the impact of office furniture on posture and - IRSST
muscle load on the upper limbs
Table 7. Average values (standard deviations) for the different EVA intensity and duration
classes for the extensor digitorum communis (expressed in percentage of total
exposure time).
Bureau A Bureau B Bureau C Effet A vs B A vs C B vs C Effet Effet
Bureau Interface BxI
Classes d'intensité (sommation des classes de durée)
0-0.3 % 0.0 0.0 0.0 / / /
(0.0) (0.0) (0.0)
0.3-1% 0.0 0.0 0.0 0.424 0.279 0.424
(0.2) (0.0) (0.0)
1-3 % 0.8 0.9 1.4 0.119 0.199 0.811
(3.3) (4.1) (4.7)
3-7 % 7.0 9.1 10.2 0.016 * 0.776 0.576
(10.7) (11.7) (14.0)
7-15 % 45.0 50.3 45.7 0.008 * * 0.155 0.586
(21.1) (19.2) (20.2)
> 15 % 47.1 39.7 42.8 0.001 * * 0.341 0.458
(26.8) (24.4) (25.6)
Classes de durée (sommation des classes d'intensité)
0-0.3 s 12.7 13.7 13.3 0.077 0.081 0.606
(4.4) (4.0) (3.7)
0.3-1 s 40.1 45.5 42.6 0.008 * 0.002 0.785
(14.4) (13.1) (11.7)
1-3 s 30.2 30.6 30.0 0.917 0.289 0.092
(7.7) (7.5) (6.4)
3-7 s 12.1 7.2 9.3 0.002 * 0.010 0.324
(10.4) (7.5) (9.2)
7-15 s 3.2 2.4 3.1 0.480 0.071 0.488
(6.3) (5.8) (4.3)
> 15 s 1.6 0.7 1.7 0.538 0.109 0.521
(6.5) (3.2) (6.1)
[picture labels:
Workstation A / Workstation B / Workstation C / Workstation Effect / A vs B / A vs C / B vs C /
Interface Effect / W x I Effect
Intensity classes (summary of duration classes)
Duration classes (summary of intensity classes)]
So the information could be summarized in a single Table, only the overall averages (combining keyboard and
mouse) for every type of workstation are presented here. However, these statistical results reflect the overall results.
4.1.3 Analysis of muscle rest
The type of workstation had no significant effect on the number of gaps or the time at rest for the
trapezius muscles (Table 8), with the exception that the time at rest was greater for Workstation
A during mouse work for the non-dominant trapezius only (Figure 7). It is important to note that
no muscle rest was detected for the anterior deltoid and for the extensor digitorum communis.IRSST Musculoskeletal disorders and office automation: the impact of office furniture on posture and 21
muscle load on the upper limbs
Table 8. Average values (standard deviations) for the number of gaps and the time at rest
for the EMG activity of the dominant and non-dominant trapezius normalized for
the maximal reference contraction.
Bureau A Bureau B Bureau C Effet A vs B A vs C B vs C Effet Effet
Bureau Interface B x I
Nombre de repos/min.
Trapèze non-dominant 2,88 0,94 0,51 0,097 0,065 0,277
(7,00) (3,50) (1,82)
Trapèze dominant 0,90 1,03 0,84 0,930 0,099 0,772
(2,80) (3,50) (3,50)
Temps au repos (%)
Trapèze non-dominant 5,65 1,26 0,71 0,076 0,050 0,039
(14,60) (4,49) (2,34)
Trapèze dominant 0,77 0,98 1,03 0,907 0,125 0,865
(2,59) (3,53) (4,94)
[picture labels:
Workstation A / Workstation B / Workstation C / Workstation Effect / A vs B / A vs C / B vs C /
Interface Effect / W x I Effect
Number gaps/min.
Non-dominant trapezius
Dominant trapezius
Time at rest (%)
Non-dominant trapezius
Dominant trapezius]
So the information could be summarized in a single Table, only the overall averages (combining keyboard and
mouse) for every type of workstation are presented here. However, these statistical results reflect the overall results.22 Musculoskeletal disorders and office automation: the impact of office furniture on posture and - IRSST
muscle load on the upper limbs
Figure 7. The cumulated time at rest in the EMG activity of the non-dominant trapezius for
each interface according to each workstation.
10
9
8
7
Time
6 (%)
Keyboard
5
Mouse
4
3
2
1
0
A B C
4.2 Effect on posture
Both the type of workstation (workstation effect) and the input interface used (interface effect)
affected the posture of the upper limb, differing according to the combination of workstation and
interface (Workstation x Interface interaction, Table 9).
Wrist. The wrist extension was affected by the workstation used, with Workstation C resulting in
the adoption of a greater wrist extension (4o) compared to Workstation A (Table 9, 50th and 90th
%ile). The significant interaction between the workstation and the interface used reveals that it
was mouse work with Workstation C that showed greater wrist extension than the other two
workstations (Figure 8A). EVA showed that the percentage of time spent with an extension
between 10o and 20o is 46% for Workstation A, compared to 29% with Workstation C. In
addition, the percentage of time spent with an extension between 30o and 40o was 6% for
Workstation A, compared to 18% for Workstation C (data not shown). The wrist deviation was
not affected by the workstation used, but a Workstation × Interface interaction was observed
(Figure 8B).
Shoulder. Overall, shoulder flexion was greater (by 5 to 10 o) when using Workstation A (Table
9, 10th and 50th %iles), even though the maximum flexion with Workstation C was similar
(Table 3, 90th %ile). The significant interaction between the workstation and the interface shows
that the shoulder flexion with Workstation A was greater (by approximately 9o) than with the
other workstations solely for keyboard work (Figure 8C). The EVA shows that, for keyboard
work, the percentage of time spent with a shoulder flexion greater than 20o was 83% with
Workstation A, compared to 52% for Workstations B and C, i.e., 30% more time with angle
greater than 20o using Workstation A (data not shown). Overall, shoulder abduction was slightly
(3-4o) but significantly less for Workstation B, compared to Workstations A and C (Table 9, 10th
%ile). The significant interaction shows, however, that during keyboard work, shoulderYou can also read