Designing Interactive Murals - D M Raisul Ahsan By An honors thesis presented for the degree of - Hand and Machine
←
→
Page content transcription
If your browser does not render page correctly, please read the page content below
Designing Interactive Murals

                    By

            D M Raisul Ahsan

An honors thesis presented for the degree of
            Bachelor of Science

     Department of Computer Science
         University of New Mexico
        Albuquerque, New Mexico
                 July, 2021

                     1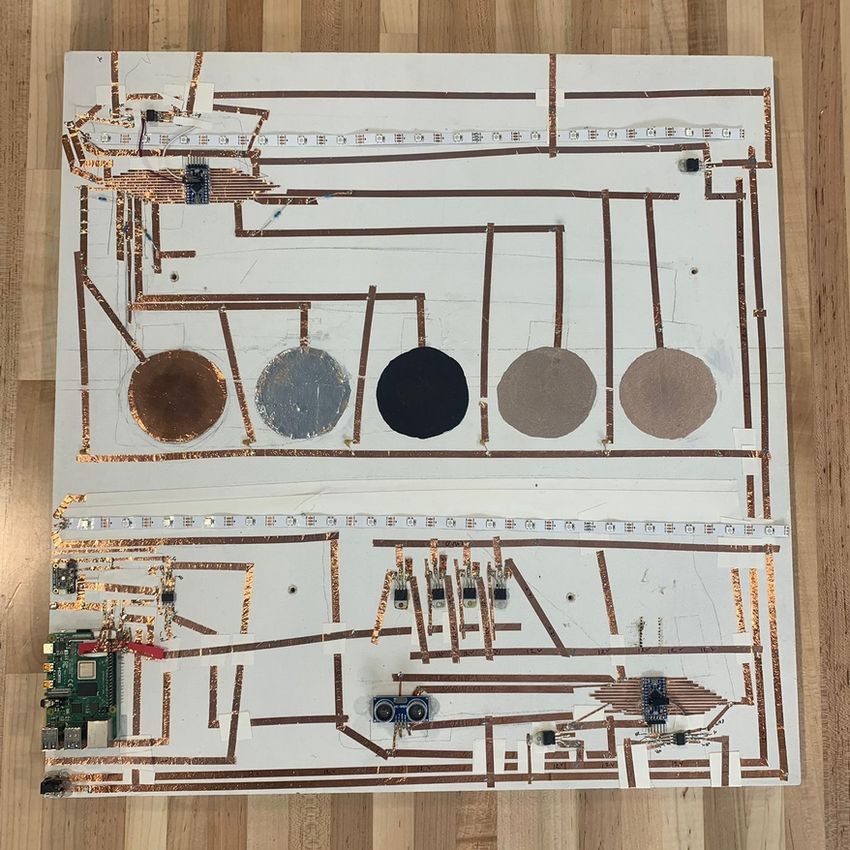
Table of Contents
1 Introduction...................................................................................................................................3
2 Background...................................................................................................................................4
   2.1 Interactive art........................................................................................................................4
   2.2 Interactive public displays.....................................................................................................4
3 Design of the Interactive Mural system........................................................................................6
   3.1 Design constraints.................................................................................................................6
      3.1.1 Durability......................................................................................................................6
      3.1.2 Paintability....................................................................................................................6
      3.1.3 Interactivity...................................................................................................................6
      3.1.4 Stability of data communication and visualization.......................................................7
    3.2 Prototype Mural....................................................................................................................7
    3.3 Hardware design....................................................................................................................8
      3.3.1 Electronics and materials used......................................................................................9
      3.3.2 Circuitry On The Prototype Mural..............................................................................11
    3.4 Software Architecture..........................................................................................................14
      3.4.1 Mural Layer.................................................................................................................15
      3.4.2 Link Layer...................................................................................................................15
      3.4.3 Storage Layer..............................................................................................................16
      3.4.4 Web UI.........................................................................................................................16
4 Sequencing Events/Keeping Track of Time................................................................................17
5 Data communication protocol.....................................................................................................22
   5.1 Transmission from the mural layer to the link layer...........................................................23
   5.2 Transmission from the link layer to the server....................................................................26
6 Results.........................................................................................................................................26
7 Conclusion..................................................................................................................................28
   7.1 Limitations..........................................................................................................................28
   7.2 Future Work.........................................................................................................................29
8 References...................................................................................................................................29

                                                                         2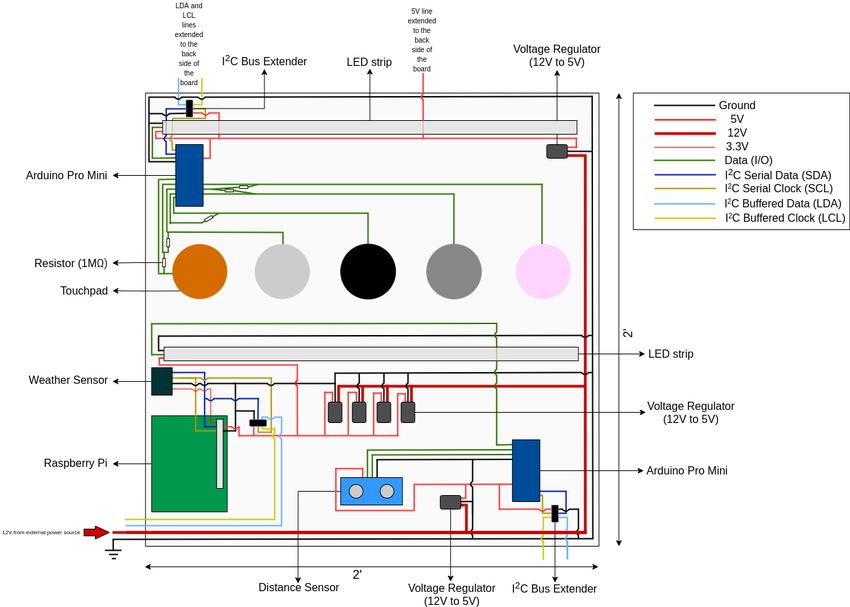
1 Introduction
       Murals are one of the earliest forms of artwork created by mankind. Murals have existed
for tens of thousands of years since prehistoric cave paintings [1]. From the earliest cave
paintings created around 30000 BC in the Chauvet cave, France to modern murals and graffiti on
the contemporary city walls, murals have played a critical role in expressing the values and the
heritage of the community [2]. Murals, by being accessible to everyone in the community and
giving voices to people, depict historical events, experiences, and deeply felt aspirations for the
future – thus can be considered as the most democratic form of art ever produced [3].
       The intrinsic social, cultural, and political values of murals necessitate deeper interactions
or engagement of people with the murals. With the advancement of Human-Computer
Interaction and the integration of computing with the arts, interactive art is now well-established
as practice [4]. Digitization of large public displays, interactive surfaces, and tangibles are
ubiquitous in contemporary urban areas both in indoor and outdoor settings. However, large
public displays in outdoor settings are either screen or projection-based and the interaction
potential of murals is yet to be explored. While screen-based outdoor public displays eliminate a
lot of technological challenges concerning long-term durability under varied weather conditions,
assure stability of the functioning of the hardware and software systems, and are easier to deploy,
the aesthetics of such displays are still under question. A number of artists asserted that the visual
elements of such interactive arts are aesthetically irrelevant [4]. Therefore developing a novel
and more expressive interface by integrating computation and electronics in the murals while
providing the artists full freedom of being aesthetically creative requires further attention.
       In this thesis, we will provide information on the background of interactive art and public
displays. We will also discuss the prior related work. We then propose a design of a hardware-
software integrated system that addresses the technical challenges of developing large-scale
outdoor interactive murals. We also present a prototype of such an interactive mural in action and
the interaction data generated by the system. We will also examine the technical challenges
involved in building such a system and the potential means to address those challenges.

                                                  3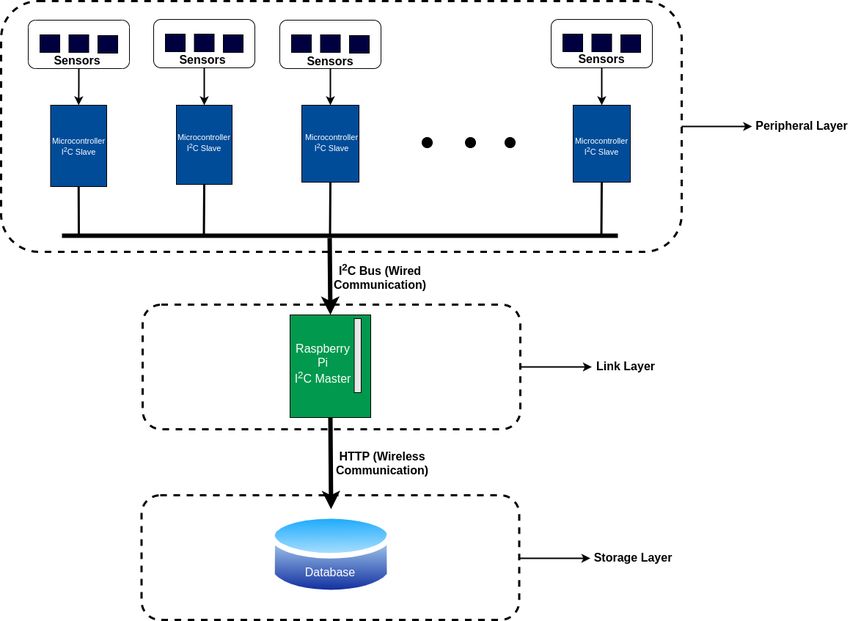
2 Background

2.1 Interactive art
       In traditional artworks, the audience is passive viewers and doesn’t participate in the
transformation or creation of the artwork. However, since the 1960s many artists and theorists
developed interests in audience participation with artwork [5]. In the past, artists have used the
medium and technology at their disposal to create interactive art. As Human-Computer
Interaction (HCI) evolved as a field of research, more researchers have been particularly
interested in creating non-traditional computational interfaces that go beyond monitors and
keyboards. Thus utilizing computation and electronics, methodologies of HCI, and tools from
Artificial Intelligence, researchers in the twenty-first century have been able to create more
robust and sophisticated interactive arts.

2.2 Interactive public displays
       Large public displays are now very widespread in modern cities. While most of these
displays are not interactive in nature, extensive research in the domain of interactive public
displays and rapid advancement in projection and display technologies have resulted in large
interactive displays being moved out from research laboratories to public places such as media
facades [6], museum displays[7], and plazas[8]. Since public spaces attract audiences of different
ages and interests and their actions are often unpredictable, installations of such public
interactive displays impose unique challenges [9]. A number of researchers are working on
understanding the interactions of people with such installations. The research expands from
understanding when, how, and how many passer-bys notice an interactive display to how they
interact with such displays [10]. Furthermore, most public interactive displays are currently
either flat-screen-based or projection-based and serve commercial purposes. Researchers are
looking for alternatives to installations that are only serving commercial purposes [9]. Because of
the aesthetic, political, historical, and social values of the murals, integrating interactivity in
murals promises to serve a greater cause for communities involved and can be a constructive
alternative to commercial public displays.
       Since the beginning of the twenty-first century, researchers have conducted extensive
work on exploring new ways to communicate with computers thus developing novel interactive
surfaces and tangibles [11]. Although initially the interactive surfaces were developed with the
purpose of private use, it wasn’t long before such technologies came out to public spaces. Public

                                                   4
installations of such interfaces include large interactive screens and tables [15][16], interactive
wall and floor projections [17][13], as well as more tangible systems [18][19]. In recent years,
the focus of the development of interactive interfaces expanded from single-user interactions to
multi-user interactions and from tangible interactions to supporting full-body engagement [11]
[12].
There are two main strands of research on interactive public displays – 1. understanding
public interactions and level of engagement with such displays, 2. developing new technologies
to create more robust and engaging public displays. Researchers have conducted field studies to
understand people’s interactions with public displays. Field studies include setting up interactive
displays in public places such as railway stations [20], public courtyards [21], and tourist
information centers [22]. These field studies observed that there is a significantly higher
conversion rate from passer-bys to users interacting with public displays[20][22]. Furthermore,
the studies concluded that increased interactive area for body interaction resulted in more
engagement with the display [22] and users are more interested in playful behavior with little
concern about the content of the display [21]. However, most of these studies are conducted
using flat screens, contain informative or commercial contents with little to no aesthetic value
from the perspective of an artist. We incorporated the findings from the study when designing the
prototype of the interactive mural. Our interactive mural will provide means for both tangible
and full-body engagement to further understand user interaction with non-commercial, aesthetic,
communally meaningful public displays.
Besides developing screen-based and projection-based public displays, several artists
have started to incorporate Augmented Reality (AR) to create interactive murals. Painted AR tag
provides a medium for the viewers to experience animated or interactive elements of the murals
[23][24][25][26]. Our goal is to provide interactive elements in a more natural art form without
using any AR or screen-based technology. One of the most challenging aspects of designing such
an interactive mural is to provide the desired features for interactions while not creating any
obstructions for the muralists to create expressive art using traditional painting materials. The
durability of the circuitry and the performance of the software running in the background under
adverse outdoor weather also impose big challenges. When building the prototype mural, we
utilized and expanded on previous work in developing technologies for paintable and paper-
based computing that made use of a wide range of conductive paints, inks, and tapes to develop
new user interfaces such as “interactive wallpaper” [27][28][29][30][31]. Although the
5technologies used to build “interactive wallpaper” provide a promising start, the wallpapers were
built for indoor settings and much smaller in size compared to murals. The design of the
prototype interactive mural has been created utilizing more robust materials and compatible
electronics that can seamlessly run the mural software and assure stable communication of the
interaction data generated by the sensors used in the mural.
3 Design of the Interactive Mural system
The design of the interactive mural system consists of two key components – the
hardware design and the software design. The purpose of the system is to provide desired
interactive features while assuring the expressiveness of the mural from the artist’s perspective.
Certain design considerations and constraints come along to serve this goal. It’s essential to
derive and understand those constraints and address them accordingly while designing the
system.
3.1 Design constraints
3.1.1 Durability
One of the major differences between an outdoor interactive mural and other flat-screen
interactive displays is that the electronics and the circuitry on an interactive mural are out in the
environment, exposed to sun, rain, and other weather conditions. Since the circuitry is not
covered by any protective shield, it’s critical that the materials used can withstand the adverse
outdoor condition and continue to perform in the desired manner for a long time.
3.1.2 Paintability
Preserving the aesthetics of murals is an integral aspect of the system. Usually, murals are
drawn and painted on walls or sheets. Incorporating electronics on such surfaces inevitably
causes the surface to be uneven. We want to make sure that the integration of circuitry doesn’t
create any hindrances to the paintability and the aesthetics of the murals. Therefore we used
conductive paints and tapes instead of wires to make the circuit connections and placed the
electronics in such a way so they don’t interfere with painting the mural or they become an
artistic part of the mural.
3.1.3 Interactivity
We are primarily interested in two modes of interaction - tangible interactions
implemented using touch sensors and motion-activated interaction that can be achieved utilizing
6distance sensors. As for the response to the users' actions, a varied number of audio-visual output
devices can be utilized.
3.1.4 Stability of data communication and visualization
To study people’s interactions with the novel interface, we need to ensure the preservation
of the detailed data of interactions. We also want to be able to remotely visualize the interactions
on a software interface. The electronics used on the murals have limited storage capacity and are
not capable of storing the detailed interaction data generated over a long time. So, we send all the
data to a remote server where the data is stored in a secured manner. The server also enables us
to visualize the data as desired, however, the data communication among the server and various
hardware devices used on the mural must be seamless and stable.
3.2 Prototype Mural
The prototype mural has been designed keeping the constraints listed above in mind.
Figure 1(a) shows the front side of the prototype mural and figure 1(b) shows the back side.
Figure 1.a: Front side of the prototype mural Figure 1.b: Back side of the prototype mural
A user can interact with the prototype mural by touching the touchpads or moving in
front of the mural. Touching any of the touchpads will cause the top LED strip on the board to
change the color of the LED lights. As for the motion in front of the mural, an ultrasonic distance
7sensor, installed at the bottom of the mural, detects the distance of the nearest object to the mural.
The bottom LED strip illustrates the distance by turning on a certain number of LED lights. The
number of LED lights turned on is proportional to the distance of the nearest object. For a
distance of 200cm or more, all the LED lights on the bottom LED strip are turned on; as the
object moves closer to the mural, the number of LED lights turned on decreases.
For each interaction, the detailed interaction data containing information on - states of the
touch sensors or the distance of the nearest object, sensor id of the sensor triggered to cause the
interaction, and time of the interaction event - is recorded and transmitted to a web server to be
stored in a database. The transmission of the interaction data is instantaneous and facilitates real-
time (with a lag of about 1 second) visualization of the interactions on a web UI. In addition to
real-time visualization, the stored data is utilized to render playback visualization of prior
interactions during any particular time frame.
The interactive features and the visualization of the interactions have been made possible
by integrating a sophisticated data communication protocol into the hardware and the software
design. In the next few sections, we delineate the hardware design, the software design, and the
communication protocol employed for the prototype mural. Although the hardware design
presented here is tailored to the prototype mural, it can easily be expanded to accommodate
larger murals with more output devices and sensors. On the other hand, the software design and
the communication protocol presented here are not specific to the prototype mural and can be
employed for any mural with little to no modification.
3.3 Hardware design
The hardware design of the prototype mural comprises two microcontrollers, sensors,
output devices, a master controller, and other electronics to provide appropriate power and
support seamless data communication. One microcontroller is connected to five touch sensors
and an LED strip, and the other to a distance sensor and another LED strip. A master controller, a
Raspberry Pi for the prototype, is responsible for collecting the interaction data from the
microcontrollers through an I2C bus and transmitting the data to a web server. The master
controller on the prototype also controls a weather sensor and collects weather data (temperature,
pressure, humidity, air quality) periodically. I2C extenders are utilized to boost the I2C signal. On
the prototype mural, one I2C extender is connected to each microcontroller (I2C slave device),
and a third one is connected to the master controller (I2C master device). Voltage regulators are
used for converting 12V to 5V, which is the voltage required to power the microcontrollers, the
8master controller, and the devices connected to them (with an exception for the weather sensor
that requires 3.3V as power and is powered by the 3.3V pin on the Raspberry Pi).
Below, we describe the electronics that may be used in a generic mural which may be
much larger and more complex than our prototype. We explain each electronic component
separately before providing a comprehensive explanation of the circuitry on the prototype mural.
3.3.1 Electronics and materials used
Microcontrollers:
Microcontrollers are responsible for controlling the output devices and the sensors. The
number of microcontrollers used in a mural varies depending on its size, ranging anywhere from
5 to 20 microcontrollers. In our system, each microcontroller is connected to one particular type
of sensor (for example, a microcontroller can be connected to only touch sensors or only distance
sensors) and several output devices.
A wide variety of microcontrollers could be used in the framework we have described.
However, few basic factors need to be considered when choosing a microcontroller for the mural
– 1. The microcontrollers transmit data using the I2C bus as a slave. Therefore, the
microcontroller to be used must be capable of operating as an I2C slave device, 2. As mentioned
in the design constraints, the electronics used on the mural must not create any hindrances to the
paintability of the mural. Hence, thinner microcontrollers are preferred, 3. The data generation
rate of the sensors is usually higher than the I2C data transmission rate. For this reason, the
generated data can’t always be transmitted instantaneously and needs to be stored in the
microcontroller for a few milliseconds. Therefore, the microcontroller used should have at least
32 kilobytes of flash memory. Considering these factors, for the prototype mural, we used
Arduino pro mini.
Master Controller:
A master controller module serves as the bridge between the mural and the software. This
controller coordinates communication between microcontrollers, gathers data, and sends data to
the server. There is one master controller per mural. The master controller is physically located
on the mural and, in our system, is a Raspberry Pi.
9I2C Network Devices:
I2C bus extenders - I2C communication bus functions well in short-distance data
transmission. However, in long-range data transmission, the parasitic capacitance attenuates the
signal causing issues with data transmission. Since the murals are large in size, long-range I2C
communication is unavoidable. I2C bus extenders are used to ensure stable long-range data
transmission. For the prototype mural, we used P82B715 bidirectional I2C bus extenders.
Sensors:
Distance sensors - Distance sensors are used to detect when a person or other object
moves in front of the mural. They can also detect how far an object is from the mural. The
number of distance sensors used for each mural depends on the size of the mural and the mural
design. Ultrasonic sonar distance sensors are used for this purpose. For the prototype mural, we
used the HC-SR04 ultrasonic sensor that runs on 5V and works at about 2cm to 450cm away.
Weather sensor - Each mural is intended to function as a weather station as well. The
murals will record the temperature, pressure, humidity, and air quality after certain time
intervals. One weather sensor, capable of sensing the mentioned weather parameters, is required
for each mural to serve this purpose. For the prototype mural, the BME680 sensor is used and
weather data is collected once every minute.
Capacitive touch sensors - Capacitive touch sensors provide means for tangible
interactions. Some of the microcontrollers available in the market have capacitive touch sensors
built into the pins. If a microcontroller doesn’t have built-in touch sensors (such as Arduino pro
mini), such sensors can easily be created with the help of a simple circuitry (figure 2). Each
touch sensor requires a send pin and a receive pin connected via a resistor of resistance 1 MΩ. A
wire (or copper tape) is then extended from the receive pin to a touchpad created using a
conductive material.
Figure 2: Circuit diagram for capacitive touch sensor
10Output Devices:
Output devices are various programmable devices that can create audio-visual output in
response to user interactions with the mural (for example LED lights or speakers). Mechanical
devices such as servo motors may also be employed. The choice of output devices must follow
the design constraints as mentioned in section 3.1. For the prototype, we have used
programmable LED strips as output devices.
Other electronics:
Voltage regulators - The logic levels of the microcontrollers can be 3.3V or 5V depending
on the type of microcontrollers used (the logic level of all the microcontrollers used on the
prototype mural is 5V). Furthermore, sensors and other output devices may require 3.3V or 5V
power input depending on the model and type. Therefore, we need to be able to convert the
voltage appropriate for the particular electronics. Voltage regulators are utilized to serve this
purpose. The primary power source of the prototype mural is 12V. Multiple voltage regulators
are used for converting the 12V to 5V or 3.3V as needed.
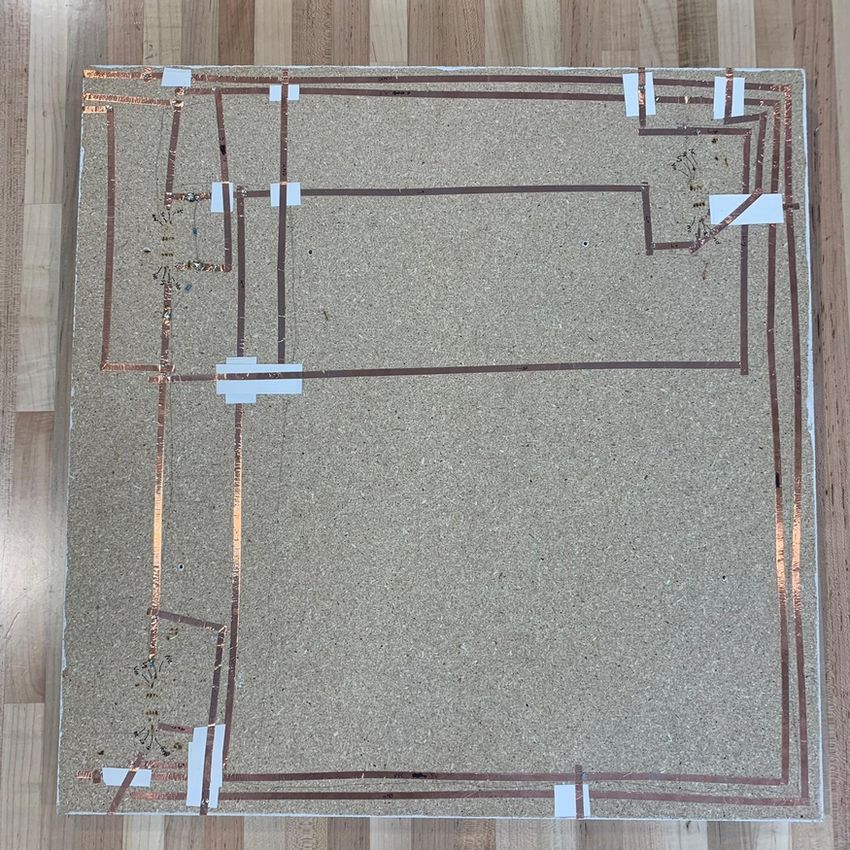
3.3.2 Circuitry On The Prototype Mural
The prototype of the Mural is 2ft×2ft in size. For the purpose of this paper, we are mostly
interested in the circuitry on the mural. Figure 3(a) shows the circuitry on the front side of the
mural and figure 3(b) shows the circuitry on the back side.
Two Arduino pro mini microcontrollers are soldered on copper tape, one at the top left
and another at the bottom right. A craft-cutter was used to cut the copper tape into strips
distanced 1mm from each other in order to match the distance between the pins of the
microcontroller. The Arduino pro minis are soldered directly onto the strips without using any
pin header to keep the height as low as possible.
Five touch sensors are created from the pins on the top left Arduino. We have used five
different types of conductive materials for the five touchpads – copper tape, aluminum tape,
carbon paint, silver paint, and copper paint. Although the receive pins must be different, the send
pin can be shared among multiple touch sensors. The top left microcontroller is connected to an
LED strip (model sk6812) that is an output device and responds to touch interactions. The
bottom right microcontroller is connected to a distance sensor and an LED strip (model
WS2812B) as an output device to respond to users' motion in front of the mural.
11The Raspberry Pi is attached at the bottom left corner of the board. A weather sensor is
connected to the Raspberry Pi via I2C pins on the Pi and the sensor. Since the weather sensor is
placed very close to the Pi, no I2C extender is required for the connection. The sensor is the only
device on the prototype mural that is powered by 3.3V (the 3.3V pin on the Pi is used to power
the sensor).
Except for the weather sensor that is directly connected to the Raspberry Pi without using
any I2C bus extender, the I2C connection on the mural board share a common buffered clock
(LCL), buffered data (LDA), and ground lines (grounds of all the devices on the mural board is
connected). The Raspberry Pi is the master device whereas the weather sensor and the Arduino
Figure 3.a: Circuitry on the front side of the prototype mural (svg file is available at this link)
pro minis are the slave devices in the connection. The serial data, serial bus, ground, and the 5V
pins from each Arduino and the Raspberry Pi are connected to the respective pins on an I2C bus
extender placed very close (about an inch) to each device. The buffered data and the buffered
12clock lines from all the three extenders are then connected together. Both LDA and the LCL lines
are connected to a 5V line through a 1KΩ pullup resistor.
Figure 3.b: Circuitry on the back side of the prototype mural (svg file is available at this link)
The primary source of the power of the prototype mural is 12V. Four 12V to 5V voltage
regulators are connected in parallel to power the Raspberry Pi. The Raspberry Pi needs to
connect with the Wi-Fi to send interaction data to the server. A parallel connection of the four
voltage regulators ensures adequate electric current required by the Raspberry Pi to establish a
strong wireless connection. One 12V to 5V voltage regulator is used to power each Arduino pro
mini and its associated devices. All the devices including the Raspberry Pi and the Arduino pro
minis are powered by connecting the 5V lines to the 5V pins (named Vcc pin on some devices)
on the respective devices.
All the connections on the prototype board are made with copper tape and soldered
properly at the junctions. The LDA and LCL lines are taken on the other side of the board to
avoid convoluted connections on the front side of the board.
133.4 Software Architecture
The software system of the interactive mural is a combination of programs running on the
microcontrollers, raspberry pi, and a web server. These programs perform varied tasks such as
controlling the sensors and output devices, transmitting the interaction data, storing and
visualizing the data. The software architecture of the system consists of four layers as determined
by the tasks each layer performs – 1. mural layer that controls the electronics on the mural board,
2. link layer that regulates the data transmission with the microcontrollers and the server, 3.
storage layer containing the databases and the back-end programs on the server, 4. web UI that
shows the visualization of the interactions on the mural. Each layer communicates with the
adjacent layers by sending or receiving data packets utilizing applicable data transfer protocols.
Figure 4: Object diagrams for the Mural Layer (top) and the Link Layer (bottom)
143.4.1 Mural Layer
The mural layer consists of the programs running on the microcontrollers. The primary
job of these programs is to control the sensors and the output devices attached to the
microcontrollers. A microcontroller may be responsible for running multiple sensors of the same
type (for example a microcontroller may be controlling multiple distance sensors or multiple
touch sensors) and output devices. Each sensor and output device is encapsulated in an object. A
main controller object administers the states and the methods of the sensor and device objects
(figure 4). The controller object also keeps records of - data generated by the sensors, time index,
and the time elapsed from the most recent time reset until the generation of a particular data - in
a queue and transmits them to the link layer when requested. Time index and elapsed time are
used for ensuring that the event order is maintained (event order and time tracking are explained
in detail in section 4). The programs running on the mural layer are single-threaded.
3.4.2 Link Layer
The link layer is in charge of regulating the transmission of data generated at the mural
layer to the storage layer. The link layer lies on the Raspberry Pi. The program on the link layer
consists of a number of collector, processor, and poster objects as well as one timer object and
one weather object (figure 4). Each of these objects runs on its own thread, however, the creation
of these threads is governed by a main controller object.
The collector thread is responsible for collecting raw data from the mural layer through
the I2C bus. Since the I2C slave devices on the same bus are identified by unique address
numbers (commonly address numbers are 7 bits), a unique collector object collects data from
each microcontroller to avoid confusion and interruptions in data transmitted by multiple
microcontrollers with different addresses. Upon collecting each data packet, the collector object
creates a tuple containing - 1. time of data generation and 2. the data value, and stores the tuple
in a queue of raw data on the main controller object. The queue of raw data is accessible by the
processor objects.
A data point is a single sensor-generated data associated with its corresponding metadata
(for example a distance sensor may generate data 50cm when the nearest object is 50cm away
from the sensor, the value 50 and its associated metadata would be a data point in this case). The
processor objects are responsible for processing the data collected by the collector objects. The
processor objects poll the tuples from the queue of raw data and format them into JSON objects.
Each JSON object contains the values – mural id, sensor id, type of data, time of data generation,
15and the data itself. Once a raw data point is formatted into a JSON object, the processor then
inserts the JSON object in a queue of processed data that is accessible by the poster objects. The
poster objects poll the JSON objects from the queue of processed data and send them to the
server using HTTP post requests.
The timer object creates and maintains time indexes, and sends time reset signals to the
mural layer. The purpose of the timer object is to ensure that the order of the interaction events is
preserved as well as to keep track of the accurate time at which a particular interaction event
occurred. The process of sequencing events and keeping time records is explained in detail in
section 4.
The weather object controls the weather sensor, collects weather data from the sensor
every 60 seconds, formats the data into JSON objects in a similar fashion as the processor object
does, and inserts them into the queue of processed data. Since each mural requires only one
weather sensor, the weather sensor is operated in the link layer instead of the mural layer and is
controlled by the Raspberry Pi instead of the microcontrollers.
3.4.3 Storage Layer
The storage layer is responsible for storing the data in a database and running the web
server. The web server, built on the NodeJS platform, handles the post requests made by the
poster objects of the link layer and stores the data sent from the link layer in a MySQL database.
The server also handles the requests from the front-end and sends appropriate data to the front-
end applications to be visualized on a web UI.
3.4.4 Web UI
The web UI, created using JavaScript framework p5.js, visualizes the mural and the
interactions on it (figure 5). Two types of visualization are possible – 1. real-time visualization
that shows the interactions instantaneously with a time lag of about one second between the
actual physical interaction and the visualization, 2. playback visualization that shows the prior
interactions on the mural on any particular day or during particular hours in the past as requested
by the user.
16Figure 5: Web UI – a screenshot of the web page that renders real-time visualization of the
physical interactions on the prototype mural remotely.
4 Sequencing Events/Keeping Track of Time
Sequencing events means preserving the order in which the physical interaction events
occurred in front of the mural. This means that the times of interactions of any two data points
should correctly indicate which of the two interactions occurred earlier than the other on the
physical mural. Although this is a seemingly basic feature, the following scenario illustrates the
intricacies involved in correctly implementing this feature.
Let’s consider that we have two microcontrollers, each attached to a distance sensor. The
two distance sensors are placed very close to each other on the physical mural. Somebody waves
a hand in front of the two distance sensors triggering the sensors to register the distance from the
hand. For the simplicity of explanation, let the sensor that registered the hand first is sensor-1,
and the other sensor is sensor-2. Since the sensors are very close to each other and waving a hand
is fast, the difference between the times at which the sensors were triggered can be as low as a
split of a second. Each microcontroller stores the distance of the hand in its queue and sends the
data to the link layer when the collector object associated with the microcontroller requests for
the data. The collector objects on the link layer run on their own thread and there is a collector
object assigned for each microcontroller. Therefore, we don't know, among the two collector
17objects associated with the two microcontrollers, which one will request the distance data first. If
the collector object, associated with the microcontroller in charge of the sensor-2, requests the
data before the other collector object, the order at which the data points are collected will be
different from the order of the actual physical interactions.
We can address this discrepancy by storing the standard time along with the data when
the microcontroller stores the data in a queue. However, given the limited flash memory
available, we want to store as little data as possible in the microcontroller memory. Furthermore,
sending too much information (year, month, day) for each data point will limit the number of
data points we can send per second through the I2C bus (table 2).
Another option is to store the elapsed milliseconds instead of storing the standard time on
the mural layer. The microcontrollers are capable of keeping the record of the time elapsed in
milliseconds since the beginning of the program. Ideally, for each data point, we should be able
to get the record of the elapsed time since the beginning of the program in a microcontroller until
the generation of that data point, keep the record of the UTC time when the microcontroller was
started as a field of the collector object, and get the UTC time of data generation by a simple
addition operation. However, the records of the elapsed time must be sent to the link layer using
the I2C bus and the elapsed time may be as long as days (recorded in milliseconds). Therefore,
we run into the same issue regarding efficient data transmission through the I2C bus.
The timer object comes in handy to address these issues. The object sends a signal to the
microcontrollers every 30 seconds to reset the elapsed time and also keeps track of the UTC time
when the most recent signal was sent. This way the elapsed time on the microcontrollers never
exceeds 30 seconds and thus requires fewer bytes to store and send the information about elapsed
time. However, when a data point reaches the link layer, there is no way to understand if a data
point was generated before or after the most recent reset signal was sent. The confusion arises
due to the fact that the time object may reset the elapsed time after a data point has been
generated but has not been transmitted to the collector object yet. To resolve this issue, the reset
signal sends a value of 0 or 1 (which is also assigned as the current time index on the timer
object) as a time index to be recorded with each data point. When this data point is received by
the collector object, it checks if the current time index on the timer object matches the time index
of the data point. If there is a match, it implies that the data was generated after the most recent
reset signal was sent, whereas if it’s not a match, the data point was generated before the most
recent reset signal.
18Figure 6: Sequencing Events/Keeping Track of Time – a reset signal, sent from the timer object
with time index 0, changes the time index on the microcontroller to 0. The microcontroller
transmits two data points – one of which was generated after the most recent reset signal (hence,
the time index is 0), and the other one was generated before the most recent reset signal that is
after the prior reset signal (hence, the time index is 1).
19The timer object keeps records of the UTC times at which the most recent reset signal and
the nearest prior reset signal were sent. If the time index on the received data point indicates that
it was generated after the most recent reset signal was sent, the elapsed time associated with the
data point is added to the UTC time at which the most recent reset signal was sent. On the
contrary, if the time index on the received data point indicates that it was generated before the
most recent reset signal was sent, the elapsed time associated with the data point is added to the
UTC time at which the nearest prior reset signal was sent. The addition operation yields the UTC
time of the data generation (the time of the physical interaction). This mechanism ensures the
time of data generation is recorded correctly and the order of interaction events is correct when
the data points are sorted with respect to time. Figure 6 shows few steps of this mechanism and
figure 7 shows a snippet of the results of one of our experiments to confirm the correctness of
sequencing events and time tracking.
20Figure 7: Results of a test to check the correctness of the time tracking and order of the
interaction events.
215 Data communication protocol
Stable and lossless transmission and storing of interaction data is critical to understanding
user behavior. Each layer of the system communicates with the adjacent layers through sending
and receiving data packets. The efficiency of data transmission across different layers is
subjected to hardware limitations and the conventions of existing data transfer protocols such as
the HTTP and I2C data communication protocols. Furthermore, the medium of data
communication is different across different layers – the data communication between the mural
layer and the link layer is wired whereas the link layer communicates with the server wirelessly.
These differences create discrepancies in the transmission rates among different layers. The
number of data points generated per second by the distance sensor is much higher than the
transmission rate through the I2C bus. Furthermore, the transmission rate through the I2C bus is
significantly higher than the wireless transmission rate using the HTTP protocol. Table 1 shows
the data generation rate of the distance sensor and table 2 shows the data transmission rate of the
I2C bus as observed by experimentation with the prototype. The communication protocol for the
system is designed to address these discrepancies without losing significant data points. The
transmission of a data point takes place in two steps – 1. transmission from the mural layer to the
link layer, 2. transmission from the link layer to the server (figure 8).
Distance of the closest object (in cm) Average number of distance data generated per second
10 3050
25 548
50 305
100 150
200 84
Table 1: Distance data generation rate (as observed for the prototype mural)
Number of bytes in each transmission Average number of transmissions per second
32 171
80 84
100 68
2
Table 2: I C transmission rate (as observed for the prototype mural)
22Figure 8: Data Communication across different layers of the system
5.1 Transmission from the mural layer to the link layer
Data transmission in this step is wired and utilizes the I2C bus. The discrepancy in the
data generation rate and the I2C transmission rate is prevalent only for the distance data. The
touch sensors generate data only when they are touched. Since the touch events are limited by
human speed, they are triggered relatively infrequently. Therefore, it is easy to reliably transmit
touch interaction data. The distance sensor, in contrast, is continuously generating data that is
read by the microcontroller. The discrepancy ,created by the higher rate of data generation by the
distance sensors, can be fixed simply by disregarding the distance data if
|previous distance value – current distance value|data points to be considered, enabling the I2C transmission rate to keep up with the data
generation rate.
Next, we came up with a standard protocol for assigning values to different bytes in the
2
I C bus. We have used the SMBus2 library, a modified version of the standard SMBus library, to
be able to send more than 32 bytes in each transmission. However, increasing the number of
bytes lowers the transmission rate (table 2).
We found by experimentation that 81 bytes provide a fast enough transmission rate while
allowing us to send 10 data points in each transmission. The first byte of the 81-byte bus is used
to store the type of data which can be touch data or distance data in our case. The value stored by
the first by being 1 signifies that the bus contains distance data, whereas a value of 2 signifies
that the bus contains touch data. The remaining 80 bytes are divided into sections of 8 bytes
where each section contains a single data point.
In the 8 bytes assigned for a single data point, the first byte contains the sensor ID, the
second byte contains the data value, next 5 bytes are used to store the time elapsed from the most
recent time reset until the generation of the data point. The elapsed time recorded in milliseconds
is converted into hours:minutes:seconds:milliseconds format. The third byte contains the value
for the hours, the fourth byte contains the value for the minutes, the fifth byte contains the value
for the seconds. The sixth and seventh bytes are used to store the value for the milliseconds.
Since one byte can’t store a value higher than 255 and the value for the milliseconds can be as
high as 999, two bytes are used in a way such that:
number of milliseconds=value stored by the sixth byte×100+the value stored by the seventh byte
The eighth byte is used to store the time index for the data point. Figure 9 shows the assignment
of bytes in the I2C bus.
We only consider distance values up to 250cm and touch data can be expressed as 0 (not
touched) and 1 (touched). Furthermore, the sensor ID doesn’t exceed 255 (since using 255
sensors with a microcontroller is impractical for our purpose), and the time index is either 0 or 1.
Therefore, the values never exceed the limit (255) that a byte can store. We can make two
significant observations in this protocol – 1. The data bus in a single transmission contains the
same type of data. Therefore, all the sensors connected to a particular microcontroller in our
design are of the same type; 2. Although we reset the elapsed time after every 30 seconds, the
protocol provides us a much higher limit of 255 hours, 255 minutes, 255 seconds, and 999
milliseconds.
24Once a collector object receives a data packet, it extracts each section, calculates the UTC
time from the elapsed time, appends the first byte’s value (type of data) at the end of each section
making the section a list of nine bytes, and creates separate (time of data generation, data as a
list of nine bytes) tuple for each data point in the packet before inserting the tuple into the queue
of raw data.
Figure 9: Assignment of bytes in a 81-byte I2C bus that holds ten sections along with one byte
for the type of data and a 8-byte section that hold a single data point.
255.2 Transmission from the link layer to the server
Data transmission in this step is wireless and utilizes the HTTP protocol. First, the
processor objects (threads) poll the tuples from the queue of raw data and create JSON objects.
The JSON objects are then inserted into the queue of processed data. The poster objects (threads)
poll the JSON objects from the queue and create HTTP post requests to the server. Since it’s
wireless communication, the post requests are slow and the speed depends on the internet speed.
The issue is addressed in two steps – 1. using multithreading where multiple poster threads poll
data from the queue and make post requests simultaneously, 2. instead of posting one JSON
object at a time, a list of JSON objects are sent in each post request. The size of the list depends
on the internet speed that determines the speed of transmission. It’s advisable that the list should
be as short as possible for better real-time visualization. For the prototype, we send a list of ten
JSON objects in each post request.
6 Results
The prototype mural was able to successfully detect users’ interactions, respond to the
interactions, and transmit the detailed interaction data to the server. Furthermore, the web UI was
able to render the visualization of the physical interactions with a lag of about one second. The
prototype has shown promising performance in recording the interaction data with correct time
and order. From our testing, we have not experienced any unexpected loss of interaction data in
the process of transmitting the interaction data across different layers of the system.
The prototype was put to the test for 24 hours in our lab. During the period of 24 hours,
5608 distance data was collected. Figure 10 shows the number of distance data points collected
during different time intervals of the day. Since the lab is busiest between 12 and 4 p.m., with
more students physically present than at any other time of the day, we notice that the majority of
distance data (motion in front of the mural) was recorded between 12 and 4 p.m.
The touch sensors were touched 409 times during the observation period. Each of the five
touch sensors on the prototype mural responds to touch interaction by turning on the top LED
strip with a certain color. The fifth touch sensor (the leftmost touch sensor) responds with no
color, which is visually equivalent to turning off the LED strip. We see in figure 11 that the
sensor responsible for blue as the output color was touched most.
Figure 12 shows the average temperature and figure 13 shows the average humidity
during different hours of the day inside the lab recorded by the weather sensor. Weather data is
26collected once every minute and the average was taken over 60 weather data points collected
during each hour. Since the temperature and humidity inside the lab are controlled artificially, we
don’t see big fluctuations in the temperature and humidity.
Figure 10: Distance data collected during Figure 11: Number of times each touch sensor
different time intervals of the day on the prototype mural was touched during the
24-hour observation period
Figure 12: Average temperature during different hours of the day
27Figure 13: Average humidity during different hours of the day
7 Conclusion
The purpose of the prototype mural presented in this paper is to check the technical
feasibility of creating such systems on a larger scale. The process of building the prototype
helped us eliminate the nonviable designs, comprehend the limitations of many electronics in
building such a system, and take a more pragmatic approach. The system can be extended to
include more modes of interaction in a large outdoor mural.
7.1 Limitations
Although the prototype showed promising results in lab testing, we have not tested it in a
crowded public setting with a potentially higher rate of interactions. Furthermore, we have
detected that some output devices such as certain LED strips, if not programmed carefully, may
create issues with the I2C data transmission. I2C bus uses interrupt for requesting data. The
FastLED library, which we used for programming LED strips on the prototype, disables
interrupts while it is writing LED data. The issue is resolved by handling the I/O exceptions in
the link layer and by making sure that the time required to write the LED data is very short.
However, for the time being, this limits us to the kinds of responses we can design using LED
28strips. Also, capacitive touch sensors are susceptible to parasitic capacitance and EMI, and can
act in unpredictable ways if these factors are not considered when creating the circuitry.
7.2 Future Work
For more real-world testing of the system, we are in the processing of building a large
interactive mural of size 22.5ft×8ft with about 4000 LED lights on LED strips as output devices.
The mural will be accessible by the students and staff at the University of New Mexico that will
yield more interactions for the system to take care of and help us understand the rooms for
improvements in the system. We are also conducting material testing and evaluating changes in
resistance for various conductors over long time, to identify more viable conductors for the
murals.
8 References
[1] T. Dresher, "Street Subversion The Political Geography of Murals and Graffiti," in
Reclaiming San Francisco: History, Politics, Culture, San Francisco, CA, USA: City
Lights Books, 1998, pp. 232-243.
[2] M. Capek, Murals. Minneapolis, MN, USA: Lerner Publications Co., 1996.
[3] D. Conrad, "Community Murals as Democratic Art and Education", Journal of Aesthetic
Education, vol. 29, no. 1, pp. 98-102, 1995. doi: 10.2307/3333522.
[4] M. Boden, "Aesthetics and interactive art", Proceedings of the 5th conference on
Creativity & cognition - C&C '05, pp. 1-2, 2005. doi: 10.1145/1056224.1056225.
[5] E. Edmonds, G. Turner and L. Candy, "Approaches to interactive art systems",
Proceedings of the 2nd international conference on Computer graphics and interactive
techniques in Austalasia and Southe East Asia - GRAPHITE '04, pp. 113-117, 2004. doi:
10.1145/988834.988854.
[6] P. Dalsgaard and K. Halskov, "Designing Urban Media Facades: Cases and Challenges",
Proceedings of the 28th international conference on Human factors in computing systems
- CHI '10, pp. 2277–2286, 2010. doi: 10.1145/1753326.1753670.
29[7] U. Hinrichs, H. Schmidt and S. Carpendale, "EMDialog: Bringing Information
Visualization into the Museum", IEEE Transactions on Visualization and Computer
Graphics, vol. 14, no. 6, pp. 1181-1188, 2008. doi: 10.1109/tvcg.2008.127.
[8] K. Kuikkaniemi, G. Jacucci, M. Turpeinen, E. Hoggan and J. Müller, "From Space to
Stage: How Interactive Screens Will Change Urban Life", Computer, vol. 44, no. 6, pp.
40-47, 2011. doi: 10.1109/mc.2011.135.
[9] U. Hinrichs, S. Carpendale, N. Valkanova, K. Kuikkaniemi, G. Jacucci and A. Vande
Moere, "Interactive Public Displays", IEEE Computer Graphics and Applications, vol.
33, no. 2, pp. 25-27, 2013. doi: 10.1109/mcg.2013.28.
[10] G. Parra, J. Klerkx and E. Duval, "Understanding Engagement with Interactive Public
Displays", Proceedings of The International Symposium on Pervasive Displays, pp. 180–
185, 2014. doi: 10.1145/2611009.2611020.
[11] S. Jordà, C. Julià and D. Gallardo, "Interactive surfaces and tangibles", XRDS:
Crossroads, The ACM Magazine for Students, vol. 16, no. 4, pp. 21-28, 2010. doi:
10.1145/1764848.1764855.
[12] L. Loke and T. Robertson, "Moving and Making Strange: An Embodied Approach to
Movement-based Interaction Design", ACM Transactions on Computer-Human
Interaction, vol. 20, no. 1, pp. 1-25, 2013. doi: 10.1145/2442106.2442113.
[13] T. Augsten et al., "Multitoe: High-precision Interaction with Back-projected Floors Based
on High-resolution Multi-touch Input", Proceedings of the 23nd annual ACM symposium
on User interface software and technology, pp. 209-218, 2010. doi:
10.1145/1866029.1866064.
[14] R. Jota, P. Lopes, D. Wigdor and J. Jorge, "Let’s Kick It: How to Stop Wasting the
Bottom Third of Your Large Screen Display", Proceedings of the SIGCHI Conference on
30Human Factors in Computing Systems, pp. 1411–1414, 2014. doi:
10.1145/2556288.2557316.
[15] P. Fischer and E. Hornecker, "Urban HCI: Spatial Aspects in the Design of Shared
Encounters for Media Facades", Proceedings of the SIGCHI Conference on Human
Factors in Computing Systems, pp. 307–316, 2012. doi: 10.1145/2207676.2207719.
[16] H. Brignull and Y. Rogers, "Enticing People to Interact with Large Public Displays in
Public Spaces", INTERACT, 2003.
[17] "Theodore Watson - Interactive Installations", Theodore Watson - Interactive
Installations. [Online]. Available: https://theowatson.com/work/. [Accessed: 30- Jul-
2021].
[18] A. Afonso, E. Ergin and A. Fatah gen. Schieck, "Flowing Bodies: Exploring the Micro
and Macro Scales of Bodily Interactions with Urban Media Installations", Proceedings of
the 2019 on Designing Interactive Systems Conference, pp. 1183-1193, 2019. doi:
10.1145/3322276.3322378.
[19] S. Nabil, T. Plötz and D. Kirk, "Interactive Architecture: Exploring and Unwrapping the
Potentials of Organic User Interfaces", Proceedings of the Eleventh International
Conference on Tangible, Embedded, and Embodied Interaction, pp. 89–100, 2017. doi:
10.1145/3024969.3024981.
[20] G. Parra, J. Klerkx and E. Duval, "Understanding Engagement with Interactive Public
Displays: an Awareness Campaign in the Wild", Proceedings of The International
Symposium on Pervasive Displays, pp. 180–185, 2014. doi: 10.1145/2611009.2611020.
[21] M. Tomitsch, C. Ackad, O. Dawson, L. Hespanhol and J. Kay, "Who cares about the
Content? An Analysis of Playful Behaviour at a Public Display", Proceedings of The
International Symposium on Pervasive Displays, pp. 160-165, 2014. doi:
10.1145/2611009.2611016.
31[22] H. Sahibzada, E. Hornecker, F. Echtler and P. Fischer, "Designing Interactive
Advertisements for Public Displays", Proceedings of the 2017 CHI Conference on
Human Factors in Computing Systems, pp. 1518–1529, 2017. doi:
10.1145/3025453.3025531.
[23] B. Biermann, "Augmented reality, art, and public space", ACM SIGGRAPH 2018 Talks,
pp. 1-2, 2018. doi: 10.1145/3214745.3214747.
[24] D. Menconi, "One of the world’s first ‘augmented reality’ murals leaps from downtown
Raleigh wall", News and Observer, 2019. [Online]. Available:
https://www.newsobserver.com/living/article220435425.html. [Accessed: 30- Jul- 2021].
[25] L. Ovalle, "Augmented-reality mural in Miami warns of climate-change danger | Miami
Herald", Miami Herald, 2018. [Online]. Available:
https://www.miamiherald.com/news/local/environment/article198488639.html.
[Accessed: 30- Jul- 2021].
[26] J. Kendall, "How augmented reality will make street art come to life", Big Think, 2018.
[Online]. Available: https://bigthink.com/jonathan-kendall/howaugmented-reality-will-
revolutionize-the-art-world. [Accessed: 30- Jul- 2021].
[27] L. Buechley, S. Hendrix and M. Eisenberg, "Paints, paper, and programs: first steps
toward the computational sketchbook", Proceedings of the 3rd International Conference
on Tangible and Embedded Interaction - TEI '09, pp. 9-12, 2009. doi:
10.1145/1517664.1517670.
[28] J. Qi and L. Buechley, "Sketching in circuits: Designing and Building Electronics on
Paper", Proceedings of the SIGCHI Conference on Human Factors in Computing
Systems, pp. 1713-1722, 2014. doi: 10.1145/2556288.2557391.
32You can also read