Met Office Intercomparison of Vaisala RS92 and RS41 Radiosondes
←
→
Page content transcription
If your browser does not render page correctly, please read the page content below

Met Office Intercomparison
of Vaisala RS92 and RS41
Radiosondes
Camborne, United Kingdom,
7th – 19th November 2013
David Edwards, Graeme Anderson,
Tim Oakley, Peter Gault

12/02/14

     FINAL_Branded_Vaisala_RS41_RS92_Report_11 2 14.docx   -1–
     © Crown copyright 2008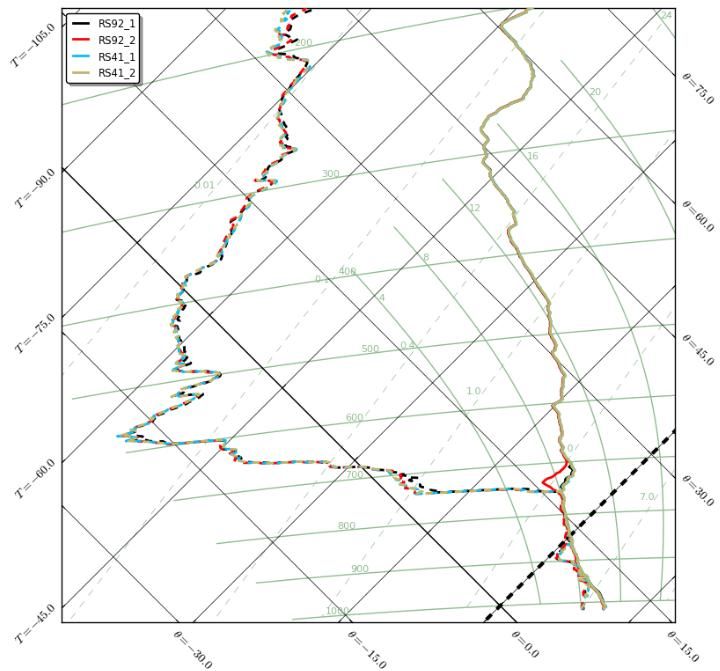
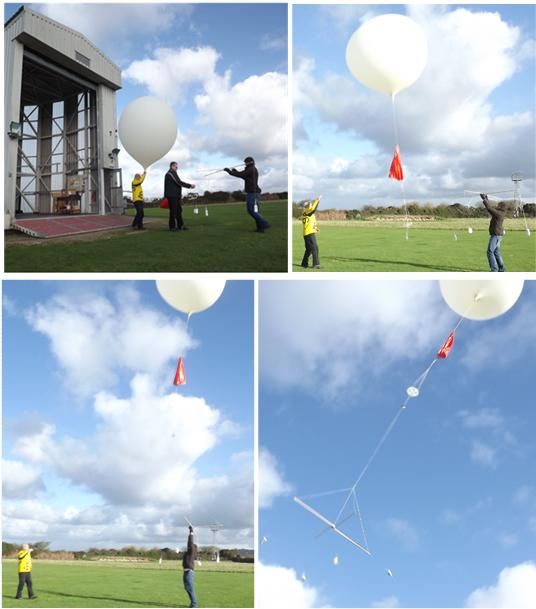
Vaisala staff launching a 4 radiosonde rig used in this report from the rotating balloon shed at the
                                   Met Office site in Camborne.

                                                 1
© Crown copyright 2014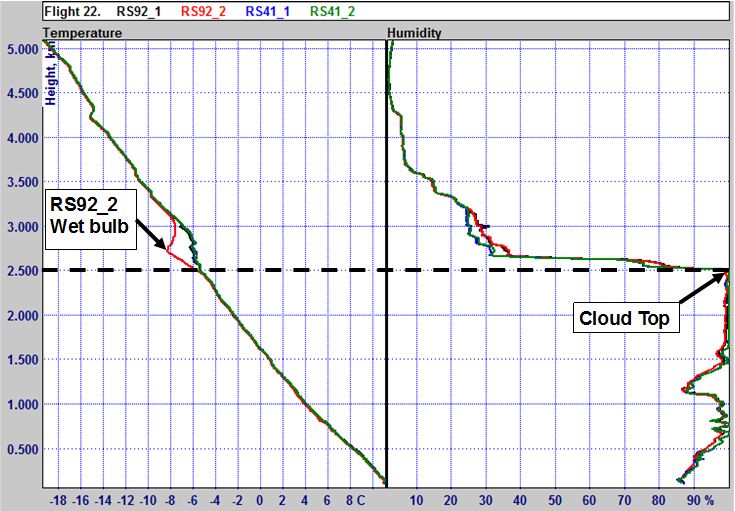
Contents

Glossary......................................................................................................................... 5
Executive Summary ...................................................................................................... 6
Organisation of the intercomparison ........................................................................... 7
   Duration, location and experimental design ................................................................. 7
Flight metadata .............................................................................................................. 8
Description of the systems used ................................................................................. 9
Radiosonde hardware ................................................................................................. 10
   RS92-SGP ................................................................................................................. 10
      Temperature .......................................................................................................... 10
      Humidity ................................................................................................................. 10
      Pressure................................................................................................................. 11
      Wind and location ................................................................................................... 11
      Hardware ............................................................................................................... 11
   RS41-SG ................................................................................................................... 12
      Temperature .......................................................................................................... 12
      Humidity ................................................................................................................. 12
      Pressure................................................................................................................. 13
      Wind and location ................................................................................................... 13
      Hardware ............................................................................................................... 13
Procedures .................................................................................................................. 13
   Radio frequency ........................................................................................................ 13
   Rig design and launch ............................................................................................... 13
Balloon performance .................................................................................................. 16
Data collection, processing and editing .................................................................... 17
   Radiosonde software ................................................................................................. 17
      RS92 ...................................................................................................................... 17
      RS41 ...................................................................................................................... 17
Missing Data ................................................................................................................ 18
   Total missing data per system ................................................................................... 18
   Average missing data duration................................................................................... 19
Sample Size ................................................................................................................. 20
Analysis software and methodology ......................................................................... 20
   WSTAT analysis ........................................................................................................ 21
   Python analysis ......................................................................................................... 22
   Outliers ...................................................................................................................... 22

                                                                 2
© Crown copyright 2014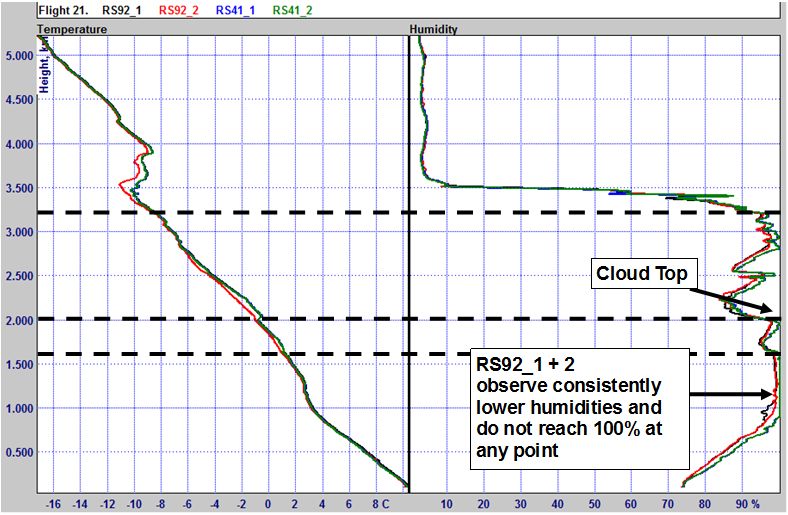
Comparison of simultaneous temperature measurements ...................................... 23
  RS92 vs. RS41 general performance......................................................................... 23
  RS92 vs. RS41: Day/night performance .................................................................... 25
  RS92 precision .......................................................................................................... 27
  RS41 precision .......................................................................................................... 29
  RS92 vs. RS41 key differences ................................................................................. 30
     RS92 vs. RS41: Behaviour around clouds – wet-bulb effect ................................... 30
     RS92 vs. RS41: Behaviour around clouds – sensor response times ...................... 33
  Temperature Conclusions .......................................................................................... 35
Comparison of simultaneous humidity measurements............................................ 36
  RS92 vs. RS41 general performance......................................................................... 36
  RS92 vs. RS41: Day/night performance .................................................................... 38
  Daytime performance in humidity bands vs. temperature........................................... 40
     Day, 0 – 20 % RH .................................................................................................. 40
     Day, 20 - 40 % RH ................................................................................................. 41
     Day, 40 - 60 % RH ................................................................................................. 41
     Day, 60 - 80 % RH ................................................................................................. 42
     Day, 80 - 100 % RH ............................................................................................... 42
  Night-time performance in humidity bands vs. temperature ....................................... 43
     Night, 0 – 20 % RH ................................................................................................ 43
     Night, 20 - 40 % RH ............................................................................................... 43
     Night, 40 - 60 % RH ............................................................................................... 44
     Night, 60 - 80 % RH ............................................................................................... 44
     Night, 80 - 100 % RH ............................................................................................. 45
     Conclusion from relative humidity vs. temperature range analysis.......................... 45
  RS92 precision .......................................................................................................... 46
  RS41 precision .......................................................................................................... 47
  RS92 vs. RS41: Behaviour around the lower troposphere and clouds ....................... 48
  RS92 vs. RS41: Performance in the upper troposphere............................................. 51
     Higher RS92 humidity relative to the RS41 during the daytime .............................. 51
     Higher RS41 humidity relative to the RS92 during the night-time ........................... 52
  RS92 vs. RS41: Performance at or above the tropopause ......................................... 53
     Moisture contamination .......................................................................................... 54
     Differences in sensor response times ..................................................................... 56
  Humidity conclusions ................................................................................................. 57

                                                             3
© Crown copyright 2014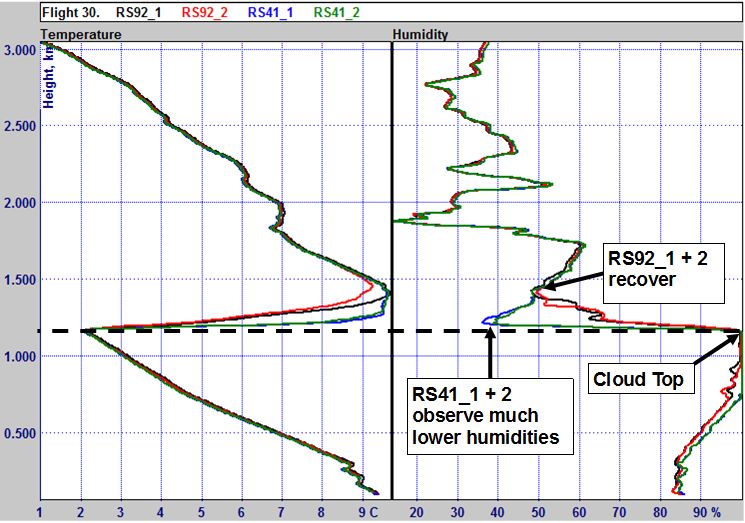
Comparison of simultaneous wind measurements .................................................. 58
   RS92 vs. RS41 .......................................................................................................... 58
   Precision .................................................................................................................... 59
   Conclusions ............................................................................................................... 62
Comparison of simultaneous height measurements ................................................ 62
   RS92 vs. RS41 .......................................................................................................... 62
   Precision .................................................................................................................... 62
   Conclusion ................................................................................................................. 64
Comparison of GPS derived height with pressure sensor derived height .............. 64
   RS92 with pressure derived height vs. RS92 with GPS derived height ...................... 64
   RS92 with pressure derived height vs. RS41 with GPS derived height ...................... 68
   Impacts of using pressure derived height ................................................................... 69
   Pressure and GPS derived height conclusions .......................................................... 71
Overall conclusions .................................................................................................... 72
   Radiosonde systems ................................................................................................. 72
   Overall temperature and humidity .............................................................................. 72
   Temperature .............................................................................................................. 72
   Humidity .................................................................................................................... 73
   GPS derived wind and altitude ................................................................................... 74
   Pressure derived altitude vs. GPS derived altitude .................................................... 74
   Overall ....................................................................................................................... 75
References ................................................................................................................... 76
Annex 1 – Additional Information .............................................................................. 76
Annex 2 – Metadata table of phenomena................................................................... 79
Annex 3 – Python generated overlaid standard deviation plots .............................. 80
Annex 4 – Sample sizes used in analysis .................................................................. 84
      Daytime temperature .............................................................................................. 84
      Night-time temperature........................................................................................... 85
      Daytime humidity and temperature vs. Temperature .............................................. 86
      Night-time humidity and temperature vs. Temperature ........................................... 86
      Pressure and GPS height comparison ................................................................... 87
      GPS Height comparison ......................................................................................... 88

                                                                 4
© Crown copyright 2014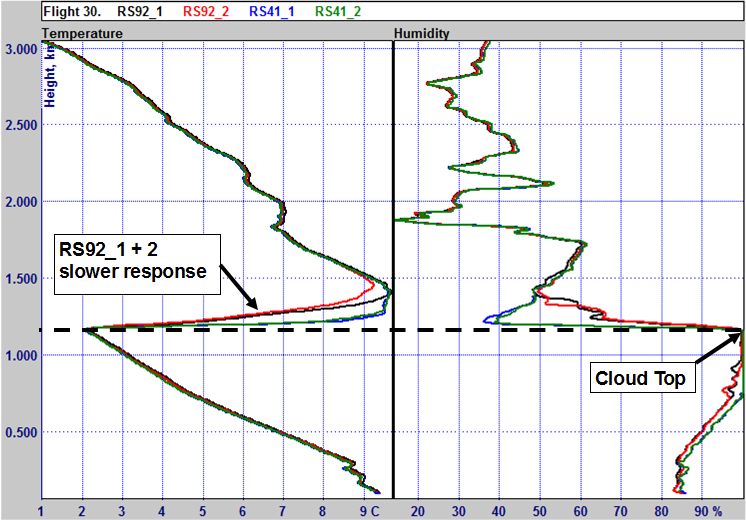
Glossary
 Accuracy: Measure of closeness of the measured value of a variable to the true value
of that variable.
 ASCII: American Standard Code for Information Interchange data file format.
 Bias: Consistently observed difference in measured value of the same variable by
separate systems.
 BUFR: Binary Universal Form for the Representation of meteorological data file format.
 DigiCORA: Vaisala radiosonde software
 GPS: Global Positioning System, US-developed global navigation satellite system.
 GUAN: GCOS (Global Climate Observing System) Upper Air Network.
 GC25: Vaisala ground check set for RS92 radiosonde.
 MW41: Vaisala sounding system.
 NWP: Numerical Weather Prediction
 Precision: Measure of reproducibility of measured variable under repeated tests.
 RI41: Vaisala ground check device for RS41 radiosonde.
 RS41: Newly developed Vaisala radiosonde model.
 RS41-SG: Version of the RS41 radiosonde model using 400 MHz transmission and
GPS wind finding.
 RS92: Established Vaisala radiosonde model.
  RS92-SGP: Version of the RS92 radiosonde using 400 MHz transmission, GPS wind
finding and pressure sensor.
 RS92-SGPL: As RS92-SGP with lithium battery.
 RSK: Software package for analyzing radiosonde data.
 SPS311: Vaisala sounding processing subsystem.
 SD: Standard deviation. Also referred to as σ (sigma).
 Standard deviation: A measure of the dispersion of a dataset from the mean.
 TEMP: Upper air data file format.
 WLIST: RSKOMP software module used to import ASCII data to RSKOMP database
 WMO: World Meteorological Organization.
 WSTAT: RSKOMP software module used for statistical analysis of RSKOMP database
 WVIEW: RSKOMP software module used for visual analysis of RSKOMP database

                                           5
© Crown copyright 2014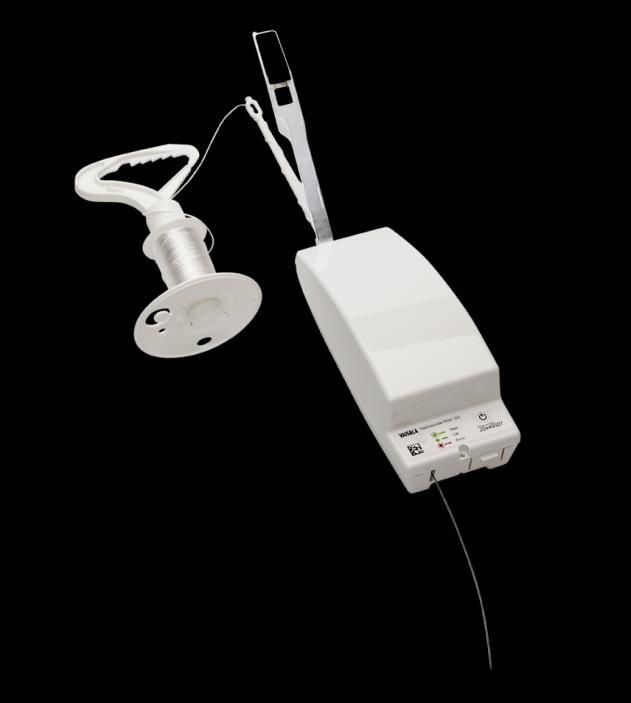
Executive Summary

30 trial ascents were launched during November 2013 from the Met Office radiosonde
station in Camborne to compare the performance of RS92 and RS41 radiosondes. Each
ascent used 2x RS92 and 2x RS41 radiosondes and was launched by Vaisala staff
under Met Office supervision. The RS92 software and model versions were the same as
those used in the WMO Intercomparison of high quality radiosonde systems, Yangjiang,
China, 2010.

All hardware and consumables apart from helium were provided by Vaisala. The design
of the trial was agreed by both parties and follows the methodology of WMO
intercomparisons (see Guide to Meteorological Instruments and Methods of
Observation). The Met Office was contracted by Vaisala to provide an independent
report from the data produced by the trial. The report and all statistical analysis were
completed by Met Office staff.

In previous intercomparisons, synchronising the times of each radiosonde during each
ascent had to be completed manually. In this trial, Vaisala used the GPS times for each
radiosonde to synchronise all 4 datasets. This is a novel approach and reduces the
impact of variability due to time synchronisation errors.

Throughout the trial at Camborne, the RS41 radiosonde performed very similarly to the
RS92, but several key differences and improvements were observed.

No significant consistent temperature differences were observed between the RS41 and
RS92. The temperature observations of the RS41 are more precise and less susceptible
to the problems caused by moisture contamination when exiting cloud than the RS92,
including wet-bulb effects. In the wet-bulb events observed during this trial, the RS41
radiosondes demonstrated a significant improvement in performance relative to the
RS92.

Some slight consistent differences in humidity were observed between the RS41 and
RS92. The humidity measurements of the RS41 are more precise and should be less
prone to moisture contamination and solar radiation correction errors than the RS92.

The GPS derived wind speeds and directions calculated by the RS41 are consistent with
the performance of the RS92.

The GPS derived heights observed by the RS41 are consistent with the performance of
the RS92, but demonstrate greater precision.

Relative to pressure derived heights observed by the RS92, GPS derived heights from
both the RS92 and RS41 demonstrate significantly improved precision and potentially
greater accuracy. This will have an impact on standard TEMP and BUFR output data
files if GPS derived altitudes are used, as pressure is then also calculated from GPS
derived altitudes.

                                           6
© Crown copyright 2014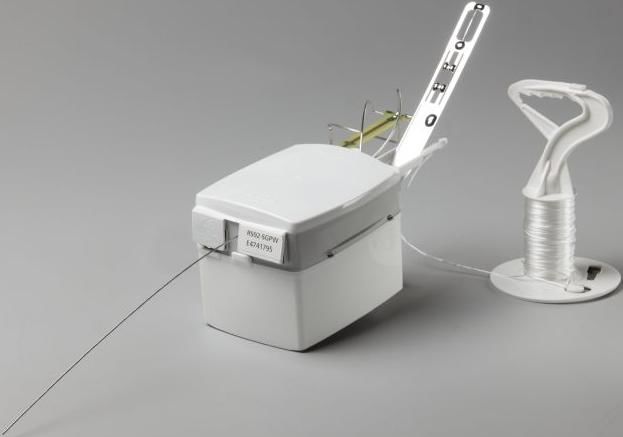
Important:
As there was no scientific reference system used in this intercomparison, it was not
possible to know which radiosonde model made the most accurate measurements.
However, the use of two of each type of radiosonde allowed analysis of their flight-by-
flight precision – the consistency of measurement of each radiosonde. Also, the impact
of known effects on radiosonde data including those listed below enabled an
assessment of relative data quality between the two radiosonde models:
Evaporative cooling of moisture contamination from temperature sensors
(referred to as ‘wet-bulbing’ or ‘the wet-bulb effect’)
Sensor response time changes with temperature
Contamination of humidity sensors by moisture
Organisation of the intercomparison
Duration, location and experimental design
30 trial ascents were completed between the 7 th and 19th of November 2013 at the
Met Office radiosonde station at Camborne, England. This site has the WMO station
number 03808 and is part of the GUAN network. Met Office operational equipment
was not used in the trial, as the radiosonde systems were provided by, set up and
staffed by Vaisala. Vaisala also constructed and launched each rig. At least one
member of Met Office staff was present throughout the trial period.
20 daytime and 10 night-time trial ascents were completed, and each ascent carried
2 of each type of radiosonde attached to a cross-shaped rig with a parachute and
unwinder/dereeler, (it will be called an ‘unwinder’ in this report). Helium gas was
used to lift the balloons to achieve an ascent rate of 6 – 6.5m/s per flight.
Daytime ascents were launched at the times of approximately 0915 and 1330 UTC with
the night-time launches at approximately 1900-2130 UTC in order to minimise variation
due to solar radiation effects during the day and eliminate them at night-time. As
Camborne is an operational radiosonde station, the times were also chosen to minimise
the risk of interference from the Met Office operational scheduled radiosonde launches
at 1115 and 2315 UTC.
7
© Crown copyright 2014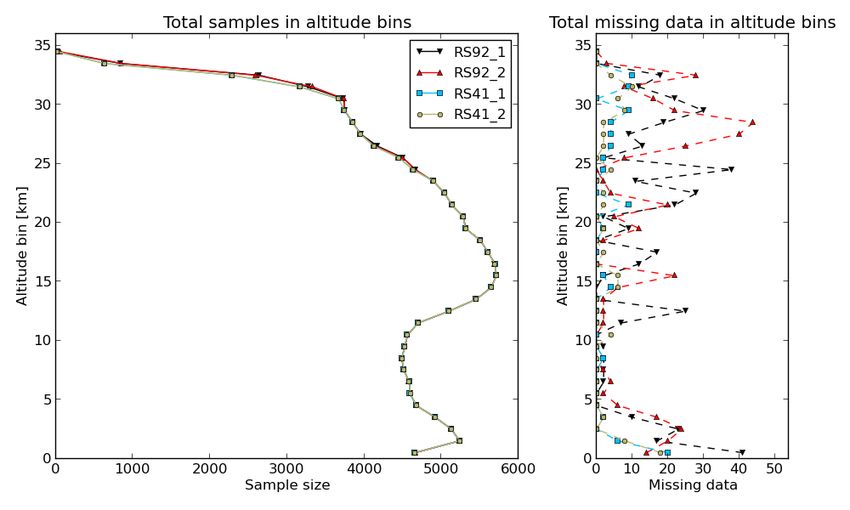
Flight metadata

Table 1: Flight metadata taken from observations at time of launch. Not included: Test flights 1-4
  and flight 24 which failed on launch due to a collision between one radiosonde and the rig.

                                                8
© Crown copyright 2014
Description of the systems used
Figure 1 - System diagram showing hardware configuration for all 4 systems being used.
9
© Crown copyright 2014Radiosonde hardware
RS92-SGP
All ascents were completed using RS92-SGPL radiosondes.
Temperature
The RS92 uses a small capacitive wire sensor mounted near the end of the sensor
boom between two support struts. The sensor boom is constructed of a thin flexible
material coated in a layer of aluminium with an additional hydrophobic coating over the
temperature end. The hydrophobic coating is designed to reduce contamination from
water when in flight.
Figure 2 – Photograph of Vaisala RS92-SPG series radiosonde.
Humidity
The RS92 uses dual capacitive humidity sensors. Each humidity sensor also contains a
heating element. The sensors are swapped periodically when in use and the sensor not
in use is heated to remove moisture contamination. This continues until a certain set of
temperature or pressure criteria are met. The observed humidity values are corrected for
solar radiation in the software based on calculated solar angle.
Figure 3 – Photograph demonstrating Vaisala RS92-SGP sensor boom design.
10
© Crown copyright 2014Pressure
The RS92 radiosondes supplied were fitted with silicon wafer pressure sensors, but
these were not used in the trial to determine altitude, which was instead derived from
differential GPS. However, additional analysis was completed to compare the
performance of GPS and pressure sensor derived altitudes, and this analysis is included
in this report.
Wind and location
The RS92 uses differential GPS to calculate the radiosonde position relative to the
ground station. Wind components are calculated from the GPS signals. The antenna
has an external helix design.
Hardware
The hardware used was two GC25 ground check systems and SPS311 radiosonde
receivers connected to the shared RB31 and GPS antennas. Due to the different ground
check systems, the datasets cannot be combined and are therefore referred to as
RS92_1 and RS92_2 in the analysis.
The GC25 ground check allowed the radiosonde temperature sensor to be checked
against a calibrated Pt100 sensor. The humidity sensors are first heated up remove any
chemical or moisture contamination before they are checked against a 0% humidity
environment generated using desiccant. The GC25 is used to apply corrections to the
radiosonde. The temperature module requires periodic calibration to ensure that
accurate corrections are being applied to the radiosonde. However, even when
calibrated, the temperatures observed by these sensors can differ slightly. This can also
cause systematic differences between radiosonde systems.
11
© Crown copyright 2014RS41-SG
All ascents were completed using RS41-SG radiosondes.
Figure 4 – Photograph of Vaisala RS41-SG radiosonde.
Temperature
The RS41 uses a small platinum resistive wire sensor mounted near the end of the
sensor boom on one side. It replaces part of the support structure. The sensor boom
itself is a thin flexible material, coated in a layer of aluminium with a hydrophobic
coating to reduce contamination from water when in flight.
Humidity
The RS41 uses a capacitive humidity sensor with an integrated resistive temperature
sensor and heating element for active de-icing. The integrated temperature sensor is
used to calculate the humidity values with respect to the actual temperature of the
sensor. This will account for heating from the element and solar radiation, eliminating the
need for a separate solar radiation correction.
Figure 5 – Photograph demonstrating of Vaisala RS41-SG sensor boom design.
12
© Crown copyright 2014Pressure
The RS41 model supplied did not have a pressure sensor, so pressure could not be
used to determine altitude. Altitude was derived from differential GPS. A model with an
integrated pressure sensor will be available.
Wind and location
The RS92 uses differential GPS to calculate the radiosonde position relative to the
ground station. Wind components are calculated from the GPS signals. The antenna
is internal and integrated into the main circuit board of the radiosonde .
Hardware
The hardware used was two RI41 ground check systems and SPS311 radiosonde
receivers connected to the shared RB31 and GPS antennas. Due to the different
ground check systems used for the RS92 radiosondes, the 2 RS41 systems were
also kept separate and are referred to as RS41_1 and RS41_2 in the analysis.
The RI41 ground check enables the radiosonde temperature sensor to be checked for
faults and compared to the temperature sensor embedded in the humidity sensor. The
humidity sensor is checked and corrected using its internal heating element to generate
a 0% humidity environment at the sensor. This also removes any chemical
contamination. The RI41 is not used to apply any corrections to the radiosondes. It is
only used to check that the radiosonde sensors are working correctly, and that the
measured values are within acceptable limits.
Procedures
Radio frequency
Radio frequencies within the 401-406 MHz band were used for this trial. The frequencies
were selected to avoid frequencies used at Camborne operationally or at other nearby
stations. The launch times were chosen to minimise interference from the operational
radiosonde ascents at Camborne. There was some interference identified in the test
flights which resulted in periods of missing data. As a result, this interference was
studied and suitable frequencies were chosen to avoid this known interference. No
similar periods of missing data were seen during the 30 flights during the trial.
Rig design and launch
The rigs were designed by Vaisala. They consisted of a central 8 cm x 8 cm square
mounting point. To this, 4 wooden rods (95 cm long) with a rounded rectangular profile
(1.5 x 1.0 cm) were attached by small screws in an offset arrangement.
The radiosondes were hung 3 cm from the end of each rod. The total horizontal distance
between radiosonde mounting points of approximately 179 cm and the diagonal distance
between mounting points was approximately 126.7 cm.
13
© Crown copyright 2014The rig was supported by a central string attached to the unwinder, and support strings
from approximately 50cm above the rig to each of the radiosonde mounting points.
Each radiosonde was tied to the radiosonde mounting points using the string normally
used to attach it to its own unwinder. The knots were secured with reinforced clear tape.
The length of string between the top of the radiosonde mounting boom and rig was
chosen to make the distance between the radiosonde sensor booms and the rig
approximately equal for the RS92 and RS41 radiosondes. The similar radiosondes were
mounted opposite each other in order to balance the rig.
Totex TX1500 (1500g weight) balloons were used for all ascents.
Totex 160V-05 parachutes were used to minimise the chance of damage upon descent.
Standard RS92 or RS41 unwinders are not suitable for multi-radiosonde launches so
were not used in this trial. Graw UW1 unwinders were used to give a steady and reliable
string release after launch for these heavier rigs.
The conditions throughout the trial were variable and often windy. This sometimes made
launches difficult. The launch temperatures averaged 9.8oC with an average wind speed
at launch of 5.3m/s and a maximum of 10.8m/s. Wind directions during the trial were
variable, but the rotating balloon shed at Camborne made launches easier. 2 or 3
Vaisala staff were used to launch each balloon and rig.
14
© Crown copyright 2014Figure 6 - Example of the balloon train with rig supporting Vaisala RS92 and Vaisala RS41
radiosondes.
15
© Crown copyright 2014Balloon performance
Across all 30 flights, the average ascent rate was 6.3m/s to 12000m. This is within the
desired range of ascent rates required by Vaisala to ensure a correct rate of airflow over
the sensors. It is also within the typical ascent rates specified in the WMO Guide to
Meteorological Instruments and Methods of Observation. The average burst height for
the 30 flights in this intercomparison was 31810m, with an average first tropopause
height of 11315m. This data was taken from the results reported by the RS92_1 system,
which is arbitrarily regarded as the reference system throughout this report.
Following 4 test flights, the trials began on flight 5. Flight 24 failed on launch because of
a collision between a sonde and the rig in very windy conditions.
Figure 7 - Balloon performance showing final height observed by system RS92_2.
16
© Crown copyright 2014Figure 8 – Average balloon ascent rates as measured by each radiosonde against height across
all flights. The final point at 34 km is from a single flight only.
Data collection, processing and editing
Radiosonde software
RS92
All RS92 ascents were processed using Vaisala DigiCORA sounding system MW31
software version 3.64.1. This includes the solar radiation corrections as applied to both
the temperature and humidity measurements in the WMO Intercomparison of high
quality radiosonde systems, Yangjiang, China, 2010. This software creates files
containing interpolated data between missing points. This feature was used in this
analysis to reflect operational output of the systems.
RS41
All RS41 ascents were processed using Vaisala DigiCORA sounding system MW41
software version 2.0. This includes solar radiation corrections specific to the RS41. This
software creates files containing interpolated data between missing points. This feature
was used in this analysis to reflect operational output of the systems.
17
© Crown copyright 2014Missing Data
Total missing data per system
During the trial, each radiosonde transmitted data once every second. Occasionally data
was lost, possibly caused by interference near the data transmission frequency. In the
following analysis, missing data is defined as data points where no temperature/RH
values were present in the data for a period of at least one second.
During the test, only the RS92 radiosondes had a loss of data exceeding 1% per flight,
occurring in 1 flight out of 30. Figure 9 shows RS92 radiosondes had the largest loss of
data per flight, in flight 31. No distinct cause could be found for the loss of data. The
RS41 radiosondes generally showed fewer seconds of missing data than the RS92
radiosondes, although there is a possibility that the choice of frequencies for each sonde
may have caused this difference.
Figure 9 – Missing data quantities for each radiosonde by flight and for each radiosonde system
overall (inset). Below is a table of observation totals per flight at 1 second resolution.
18
© Crown copyright 2014Average missing data duration
It was of interest to investigate how long each period of missing data lasted. A single
extended period of missing data in the middle of a flight could lead to a key feature in the
profile being missed. However, many individual seconds of missing data spread out
across the ascent would be unlikely to have much impact.
Figure 10 shows the statistics of missing data from each flight. The duration of missing
data was generally on the order of only 2 to 4 seconds when it occurred, with relatively
little deviation from this. As such, the impact of missing data, when points were
interpolated from surrounding data, was unlikely to impact on the detection of major
features.
Figure 10 – Total quantities of missing data per flight (top) and standard deviations of missing
data duration (bottom).
19
© Crown copyright 2014Sample Size
A total of 30 separate flights were made: 20 during the daytime, 10 at night-time. The
majority of flights exceeded 30 km in altitude before the balloon burst. Flight durations
ranged from 68 to 117 minutes, sampling at one sample per second, generally giving
over 5000 samples per sonde per flight. More data was available at some altitudes
compared with others, because of differences in ascent rate. By comparing with Figure
8, it is possible to see that altitude bins with greater sample size tie in with altitudes
where the balloon ascended less quickly, and so had more time to take measurements.
Figure 11 shows total number of data points from each sonde in each altitude bin up to
35 km. The plot on the right shows how many of those data points contained no data in
the raw data, and so were interpolated in the final data. Only one flight succeeded in
taking measurements above 34 km from all four sondes.
Figure 11 – Total sample sizes against height with missing data quantities in 1 km range bins.
Analysis software and methodology
RSK software version 3.5, comprising WVIEW, WLIST and WSTAT were used to display
and analyse the data files in this trial. This is the same version as was used during the
WMO Intercomparison of high quality radiosonde systems, Yangjiang, China, 2010. All
radiosonde analysis compared the processed outputs from the radiosonde software
versions being used. While raw data was available and was useful for interpreting
certain results, it is not included in this analysis as it does not represent operational
output.
20
© Crown copyright 2014WSTAT analysis
The statistical analysis plots generated by WSTAT were produced using 1 second
sampling, as provided by the radiosondes themselves. Analysis was either completed
over 1 km or 10°C bands, as was the process in the WMO Intercomparison of high
quality radiosonde systems, Yangjiang, China, 2010.
Where helpful, the WSTAT analysis charts have been replicated between different
sections with identical axes making visual comparison of the results of the two
radiosonde designs easier. Most plots show average flight-by-flight differences between
the radiosondes and the corresponding flight-by-flight standard deviation (SD) plot.
When all 4 radiosondes were compared, the RS92_1 was used as the arbitrary
reference radiosonde in all cases to demonstrate the typical deviations from the RS92_1
data that would be expected from either another RS92 flying at the same time, or in
comparison with the RS41.
Where only 2 radiosondes of the same model were compared, the results indicate the
typical precision of the radiosonde’s measurements. Precision is referred to as
‘reproducibility in sounding’ in the Vaisala RS92-SGP datasheet and Vaisala RS41-SG
datasheet.
When interpreting radiosonde plots comparing 2 radiosondes of the same model,
smaller standard deviations indicate higher radiosonde precision. Under a normal
distribution, 1 SD accounts for approximately 68% of the data, and is an indicator of
typical performance.
For additional information, some average flight-by-flight difference plots also include
thinner 2σ (2 sigma, which is equivalent to 2 SD) lines. The 2σ lines show the
boundaries of where approximately 95% of the differences in the data fall, representing
expected performance for that radiosonde in most cases. Note that the 2σ lines are not
for the standard deviation of flight-by-flight differences, but are instead for direct
differences due to restrictions within the software and are therefore only to aid visual
comparison of the data.
In some circumstances, the datasets are reduced through early bursts or manual
restrictions of the dataset by temperature and humidity bands. Data points containing
data from fewer than 3 flights were partially masked in grey to give a simple visual
assessment of the validity of the result. Full sample size tables are included in annex 4.
To make the analysis by WSTAT and WVIEW more accurate, the individual flight
processed data files were converted to ASCII format and time synced by their GPS
times by Vaisala. This ensured that all of the data points were accurately mapped across
all 4 systems for RSK analysis without the need for the application of manual timing
offsets. In order to ensure that the points matched exactly, linear interpolation between
data points was used to map to the correct time. RS92_2 was used as the reference
time for the purposes of this processing.
21
© Crown copyright 2014Python analysis
New code was developed in the Python programming language to analyse the
radiosonde data and statistics. For example, the code for creating the plots in Figures 8
– 11 was developed to directly read the ASCII data files and carry out the required data
analysis before plotting the data.
Code was also developed in Python to recreate plots that could be generated using the
RSK WSTAT software, but in such a way that the plots could be customized. The mean
difference in kilometre bins between the measurements of each radiosonde and a
reference sonde were calculated, and averaged across a number of flights, in order to
recreate the ‘flight-by-flight’ difference plots created using WSTAT. The standard
deviations of these flight-by-flight differences could then be calculated using the Python
NumPy module, allowing for flight-by-flight standard deviations to also be recreated.
The advantage of using Python to create these plots was that the standard deviations of
the flight-by-flight differences between the two RS41 radiosondes on each flight and the
two RS92 radiosondes on each flight could be directly overlaid. This provided a quick
visual comparison of the difference in precision of the measurements of each system.
These plots were found to provide values extremely close to those produced by the RSK
software, except in the maximum and minimum altitude bins. This effect was assumed to
be caused by different approaches to selecting data at the start and end of each flight,
but the exact cause could not be determined. As such, the Python analysis figures of this
type have been included, but only in annex 3 as a reference.
Outliers
In previous WMO intercomparisons it was standard practice to mask agreed data
which is outside of the typical behaviour of the radiosonde. However, there were no
instances of significant deviations from ‘normal’ behaviour in this intercomparison
with either radiosonde.
In flight 6 (Figure 77), the temperature readings from system RS92_1 were
approximately +0.3 oC above those of the RS92_2 until approximately 3 km. This is a
slightly greater difference than was observed in the other ascents. This flight was
included in the analysis for two reasons: the values recovered after 3 km to normal
differences from the other RS92 system, and the radiosonde passed its ground
check, representing what would be seen in an operational situation.
22
© Crown copyright 2014Comparison of simultaneous temperature measurements
RS92 vs. RS41 general performance
On a flight-by flight basis, the temperature observations of the RS41 radiosondes
compared to the RS92 radiosondes are very similar. An example from a single typical
flight is shown in Figure 12, with the temperature profiles of all 4 radiosondes plotted on
top of each other on the left. On the right are the temperature differences seen for the
other 3 sondes relative to the RS92_1 radiosonde at 5 m resolution, which are below the
tropopause are all within ±0.3°C at any point. These differences are grouped and
averaged to generate the overall ‘average flight-by-flight’ differences and standard
deviations seen in the day/night performance and precision in the following sections.
Figure 12 - Flight 19 temperature profile showing the measured temperature profiles (left) and
differences of the radiosondes relative to the RS92_1 sonde (right).
The ascent features a sharp inversion which is tracked well by all 4 radiosondes with no
notable increase in variability. This behaviour is typical, except in situations involving
thick cloud which will be discussed later.
23
© Crown copyright 2014The subsequent images show sections of the ascent from Figure 12 in greater detail,
demonstrating how closely the temperature profiles match each other.
Figure 13 – Example from flight 19 showing the measured temperature differences of the RS41
radiosondes and RS92_2 radiosondes relative to the RS92_1.
Figure 14 – Detailed section of flight 19 showing the measured temperature differences of the
RS41 and RS92_2 radiosondes relative to the RS92_1.
24
© Crown copyright 2014RS92 vs. RS41: Day/night performance
The RS92 and RS41 offer very similar results when compared at night-time,
showing general direct differences of less than ±0.1°C except for in the lowest 4 km
of ascents (see Figure 15). This variability at this level is largely due to the
differences in behaviour around clouds, which will be discussed later.
During the night-time, the RS92 dataset indicates a slight systematic negative
temperature bias for the RS92_2 relative to RS92_1. This may be partially due to
the differences in the ground check temperature corrections applied to the
radiosondes, which was -0.05°C lower for the RS92_2 ground check system on
average.
Figure 15 - Night-time temperature comparison between the RS92_1 and the RS92_2 and RS41
radiosondes – flight-by-flight direct differences.
During the daytime, the RS41 radiosondes show some slight consistent differences
(within ±0.2oC) relative to the RS92 radiosondes relative to altitude. As discussed below,
these consistent differences disappear when viewed against temperature bands (Figure
18), indicating that they are due to altitude-related phenomena rather than temperature.
The result between 34 and 35 km in Figure 16 is a limited sample size, so is not very
representative of general performance.
During the daytime the RS92 dataset indicates a smaller systematic negative
temperature bias for the RS92_2 relative to RS92_1 than is seen at night-time. However,
this data includes the application of solar radiation corrections and have increased
uncertainty in the dataset relative to the night-time ascents, as seen in the precision
plots for day and night.
25
© Crown copyright 2014Figure 16 - Daytime temperature comparison between the RS92_1 and the RS92_2 and RS41
radiosondes – flight-by-flight direct differences.
Although presenting the results of this trial against height is useful for the circumstances
seen in this trial, it is perhaps more informative from an international perspective to show
how the systems’ temperature measurements differ as measured over various
temperature bands. This will give an indication of how the systems would differ from a
climatic perspective in day and night situations.
The key outcome from this analysis is that the temperatures observed by the RS41
relative to the RS92 do not differ much at any temperature range, except in the regions
exiting clouds in the lower troposphere during the day. This accounts for the increased
difference and variability seen at -5°C at night and 5°C during the day, but at night this
variability was approximately equivalent to that seen in the RS92 measurements. As the
temperature at which cloud tops occur is highly variable, this exception is therefore only
representative of differences seen during this trial.
Figure 17 - Night-time temperature comparison between the RS92_1 and the RS92_2 and RS41
radiosondes flight-by-flight differences (left) including direct difference 2σ bands and flight-by-
flight standard deviations (right).
26
© Crown copyright 2014Figure 18 - Daytime temperature comparison between the RS92_1 and the RS92_2 and RS41
radiosondes flight-by-flight differences (left) including direct difference 2σ bands and flight-by-
flight standard deviations (right).
The consistent differences seen between the RS41 and RS92 during the daytime
(Figure 16) with height were not replicated when compared using temperature bands
(Figure 18). This indicates that the consistent differences would not have a large impact
over a longer period, as they are linked to the heights of atmospheric phenomena during
individual ascents rather than temperature bands.
RS92 precision
The agreement between the systems is generally very high. This is demonstrated by the
low standard deviation values in Figure 19. As shown in Figure 15, during the night-time
the RS92_2 system indicated a consistent difference in temperature bias to the RS92_1
system ofFigure 19 - Night-time temperature - average RS92_1 vs. RS92_2 flight-by-flight differences (left)
including direct difference 2σ bands and flight-by-flight standard deviations (right).
Comparing Figure 19 and Figure 20, while the two RS92 systems’ flight-by-flight
differences appear to agree more closely during the daytime on average than at night-
time, the standard deviations are higher. This shows that there is slightly less agreement
between the two RS92 systems which is masked in the flight-by-flight differences plot.
This is expected to be caused by the application of solar radiation corrections to the
measurements, adding additional uncertainty into the results.
Figure 20 - Daytime temperature - average RS92_1 vs. RS92_2 flight-by-flight differences (left)
including direct difference 2σ bands and flight-by-flight standard deviations (right).
The Vaisala RS92-SGP datasheet indicates that the reproducibility (precision to 1 SD) of
RS92 temperature measurements is ±0.2oC (1080-100hPa), ±0.3oC (100-20hPa) and
±0.5oC (20-3hPa). The flight-by-flight standard deviation results in Figure 19 and Figure
20 are within these boundaries except for the significant deviation during the night-time
2-3 km range, the causes of which are discussed below.
Note that the 2σ lines on the figures are for direct differences rather than flight-by-flight
differences, so are only to enable easier visual comparison of the figures. Total
uncertainty in temperature measurements is stated as ±0.5oC for the RS92.
28
© Crown copyright 2014RS41 precision
Comparing Figure 19 to Figure 21 and Figure 20 to Figure 22, the RS41 radiosondes
show better agreement between the two systems than the RS92 radiosondes. This is
observed in daytime and night-time flight-by-flight differences and their respective
standard deviations. Overall, this indicates that the RS41 sensors are more precise than
the RS92 sensors.
There was a very small increase in variability noticeable in the lowest 4 km of ascents
that is most likely caused by each of the RS41 sondes behaving slightly differently when
interacting with clouds, as shown in Figure 28. The magnitude of this increase in
variability is less than that seen with the RS92 as demonstrated in Figure 24.
Figure 21 - Night-time temperature - average RS41_1 vs. RS41_2 flight-by-flight differences (left)
including direct difference 2σ bands and flight-by-flight standard deviations (right).
The daytime flight-by-flight performance of the two RS41 systems shows similar
agreement to the night-time performance, but as with the RS92, the standard deviations
are higher. The magnitude of the solar radiation corrections being applied to the raw
data increases with height, so the increasing standard deviations with height are likely to
be caused by this additional uncertainty.
Figure 22 - Daytime temperature - average RS41_1 vs. RS41_2 flight-by-flight differences (left)
including direct difference 2σ bands and flight-by-flight standard deviations (right).
29
© Crown copyright 2014The Vaisala RS41-SG datasheet indicates that the reproducibility (precision to 1 SD) of RS41 temperature measurements is ±0.15oC (>100hPa) and ±0.3oC (
Figure 23 - Example of a cloud exit in flight 22 causing cooling of the RS92_2 temperature sensor
   relative to the RS41 radiosondes, with the RS92_1 sensor on the same ascent unaffected.

  Figure 24 – Detailed section of flight 22 showing the measured temperature differences of the
   radiosondes relative to the RS92_1 radiosonde in normal conditions and on exit from cloud.

                                               31
© Crown copyright 2014
Figure 25 - Example of a cloud exit in flight 22 causing cooling of the RS92_2 temperature sensor
relative to the RS41 radiosondes, with the RS92_1 sensor on the same ascent unaffected.
Displayed in tephigram format indicating super-adiabatic cooling measured by RS92_2 sensor.
32
© Crown copyright 2014RS92 vs. RS41: Behaviour around clouds – sensor response times
In the example in Figure 26, the RS92 sonde’s sensors do not exhibit a wet-bulb effect
upon exit from thick cloud, despite the sharp change in humidity and temperature.
However, they do appear to have a slightly slower response time to the change in
temperature than the RS41 radiosondes. This effect was seen in several ascents,
although this is the most notable example. This is probably due to evaporative cooling
caused by slight moisture contamination.
Figure 26 - Example of cloud exit in flight 30 causing a slower response of both of the RS92
temperature sensors relative to both of the RS41 sensors.
The appearance of this effect demonstrates a component of the increase in variability
seen in the lowest 4 km in the overall statistics for both types of radiosonde, as seen in
Figures 15 and 16. Figures 27 and 28 display the temperature profiles against the
differences seen in those profiles relative to those of the other radiosondes. The first
shows the RS92_1 against the other three, clearly showing the higher temperatures
measured by the RS41 radiosondes, but also the differences between the values
measured by the RS92_1 and RS92_2, which are higher than those observed above
and below the event.
33
© Crown copyright 2014Figure 27 - Detailed section of flight 30 showing the measured temperature differences of the 3
other radiosondes relative to the RS92_1 sonde in normal conditions and on exit from cloud.
The appearance of variability of all 4 sondes caused by the transition from cloud to a
low-humidity environment indicates the challenges present in accurately measuring
temperature.
Figure 28 shows the same region as Figure 27, but with only the RS41 profiles to
demonstrate the equivalent differences seen between the RS41_1 and RS41_2 on the
same axes. Although there is an increase in variability for the RS41 radiosondes, the
magnitude and duration is lower than that seen with the RS92 radiosondes.
Figure 28 - Detailed section of flight 30 showing the measured temperature differences of the
RS41_2 radiosonde relative to the RS41_1 in normal conditions and on exit from cloud.
34
© Crown copyright 2014Temperature Conclusions
Generally, the RS92 and RS41 exhibit very similar performance when observing
temperature, with the average difference between the two radiosonde models’
measurements typically within ±0.2°C over the course of the trial when measured over
either 1 km or 10°C bands to 1 SD.
The consistently reduced standard deviation values between the RS41 radiosondes
relative to the RS92 radiosondes, indicates that the RS41 observes temperature with a
greater degree of precision than the RS92.
The RS92 temperature correction applied during the ground check is a potential source
of systematic bias. As no corrections are applied to the RS41 this potential bias is
removed, while the internal checks ensure that faulty radiosonde sensors should still be
detected before launch. Overall, this change should improve the accuracy of radiosonde
temperature observations while maintaining their reliability.
Despite the difference in radiosonde design, the application of solar radiation corrections
to the radiosondes during daytime ascents did not introduce large differences between
the RS92 and RS41 temperature measurements observed in this trial.
From a climate perspective, unless flagged in the dataset, wet-bulb events could
introduce a negative temperature bias at some levels. On a day-to-day basis, the effect
decreases confidence in the integrity of radiosonde data from a forecasting perspective,
and the flagging of affected data reduces the useable dataset available for NWP. The
minimisation of the impact of wet-bulb events is therefore desirable. In the wet-bulbing
situations observed during this trial, the RS41 radiosondes demonstrated a significant
improvement in performance relative to the RS92.
35
© Crown copyright 2014Comparison of simultaneous humidity measurements
RS92 vs. RS41 general performance
In general, when measuring relative humidity, the RS92 and RS41 performed very
similarly throughout most ascents.
Figure 29 shows a highly variable humidity profile from flight 8, with many shallow
features. The left side shows the humidity profiles of all 4 radiosondes plotted on top of
each other. The right side shows the humidity differences seen for the other 3
radiosondes relative to the RS92_1 sonde at 5 m resolution, which are generally all
within ±5% at any point. It is these differences that are grouped and averaged to
generate the overall results and standard deviations seen in the day/night performance
and precision sections below.
Figure 29 – Flight 8 humidity profile showing the measured humidity profiles (left) and differences
of the radiosondes relative to the RS92_1 radiosonde (right).
In the example in Figure 29, the highest areas of variance are shown to be caused by
very slight differences in the sensor response times. As these features change so
rapidly, the differences are high in magnitude, but short in duration. In Figure 30, the
RS41 radiosondes appear to react to a feature slightly slower than the RS92
36
© Crown copyright 2014radiosondes. The delay is approximately 2 seconds. However, this kind of behaviour is
seen with both types of radiosonde, and the effect is varies for different ascents.
For example, Figure 31 shows a section of flight 18 which shows the RS92 sondes
appearing to react to features slightly slower than the RS41. In general, the RS41
sensors appear to react slightly faster in the lower troposphere up to about 6 km.
Analysis of the raw data files indicated that both effects seen in Figure 30 and Figure 31
are most likely caused by the use of slightly different time lag correction factors applied
to the RS92 and RS41 data in the DigiCORA software. The reaction times in the raw
data look generally identical.
Figure 30 – Expanded section of the flight 8 humidity profile showing the measured humidity
profiles (left) and differences of the radiosondes relative to the RS92_1 sonde (right).
Figure 31 – Expanded section of the flight 18 humidity profile showing the measured humidity
profiles (left) and differences of the radiosondes relative to the RS92_1 sonde (right).
37
© Crown copyright 2014RS92 vs. RS41: Day/night performance Night-time ascents generally show better agreement between the RS92 and RS41 radiosondes. The RS41 radiosondes generally measured slightly higher humidity values (
As with the temperature analysis, assessing humidity against height is less useful for
global comparisons, as the results are largely affected by the height of the tropopause
and cloud layers. As these features are highly variable, even within this trial period, the
exceptions noted in the sections below are only valid at the levels seen during the trial
for the trial period. Therefore an analysis against temperature should give a better
impression of how the radiosondes might perform globally from a climatic perspective.

At night-time, the RS41 humidity measurements are slightly higher (< 1.5%) at almost all
temperatures except for the lower troposphere and after the tropopause (Figure 34). The
causes of both of these exceptions are discussed below.

  Figure 34 - Night-time humidity comparison average RS92_1 vs. RS92_2 and RS41 flight-by-
     flight differences (left) and flight-by-flight standard deviations vs. RS92_1 dataset (right).

The RS41 radiosondes observe slightly higher humidity values (
Daytime performance in humidity bands vs. temperature
Figures 34 and 35 show measured consistent relative humidity differences for the RS41
relative to the RS92 over different temperature ranges. It is necessary, however, to also
divide the data into relative humidity ranges, as these consistent differences may be
reduced or magnified under certain humidity conditions.
The disadvantage of being more selective in the data being analyzed is the reduction in
sample sizes which reduces the reliability of the statistics. When fewer flights are used,
the differences between sondes will become increasingly dominated by the
characteristics of individual sensors, their calibrations and the effect of atmospheric
conditions, as opposed to being truly representative of differences between radiosonde
models.
Data from temperature ranges where the sample size was three or less has been
highlighted in grey in the following section. The reliability of the statistics can partially be
seen in the flight-by-flight differences between the RS92 radiosondes in each plot. When
the sample size is small, the mean difference between the RS92s increases, whereas
with large sample sizes, the differences between pairs of RS92s tend to average out.
The statistics produced by the analysis of data from the daytime were more robust, due
to the fact that there were 20 daytime flights compared with 10 at night.
The flight-by-flight differences in measured humidity between radiosondes varied widely
when using restricted humidity bands. As such, the x-axis of the plots in Figures 36 - 45
have been set to all be the same, to simplify visual intercomparison between figures.
Day, 0 – 20 % RH
At very low humidities during the day, the RS41 radiosondes show slightly higher
humidity values relative to the RS92 radiosondes, with an average flight-by-flight
difference in measured relative humidity of around 1% higher than the RS92s between -
30°C and -50°C. The RS41 radiosondes show slightly lower humidity values relative to
the RS92 radiosondes of around 0.5% between -50°C and -70°C. This ties in well with
the consistent difference observed in Figure 35 where no humidity restriction is applied
to the daytime data.
Figure 36 - Daytime flight-by-flight humidity differences between RS92_1 vs. RS92_2 and RS41
radiosondes along with sample size, using only data where 0% < RH(RS92_1) < 20%.
40
© Crown copyright 2014You can also read