Pricing trends for communications services in the UK - Publication date: 9 January 2020 - Ofcom
←
→
Page content transcription
If your browser does not render page correctly, please read the page content below
Pricing trends for communications services
in the UK

Pricing trends for communications services in the UK – Welsh overview

Publication date: 9 January 2020
Contents
Section
1. Overview                                               1
2. Consumer engagement and its implications               9
3. Pricing of bundled services                            21
4. Pricing of standalone mobile voice and data services   30
5. Pricing of landline services                           40
6. Pricing of pay-TV services                             44
7. International comparisons                              48

Annex
A1. Methodology                                           50
Pricing trends for communications services in the UK

Overview
This report looks at pricing trends for residential phone, mobile, broadband and TV services in the
UK. It examines the prices of standalone and bundled services and what customers actually pay for
these services. Overall, while there is variation in pricing trends across communications services with
some services becoming cheaper and others more expensive, we find that customers are generally
able to benefit from a wide range of good value deals.
The prices people pay and the value that they get from communications services are key indicators
of whether markets are working well for customers. Helping customers get the best deal for them is
a priority for Ofcom. Our Fairness for Customers programme includes a number of actions to help
make it easier for people to find the right deal, and ensure they are treated fairly by their provider.

                                                                                                      1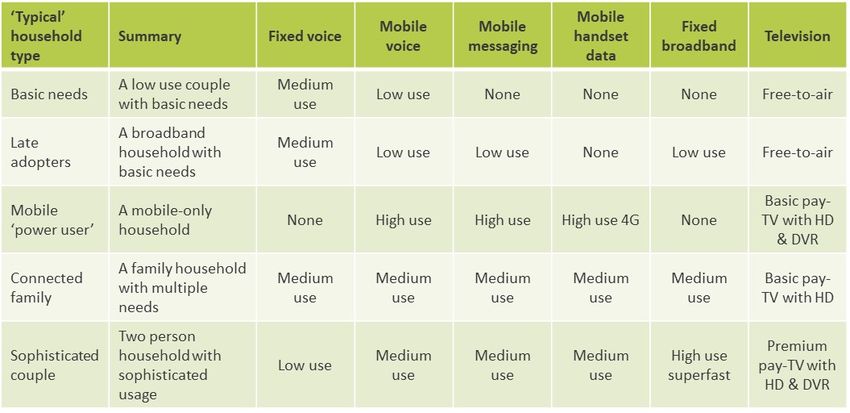
Pricing trends for communications services in the UK
What we have found
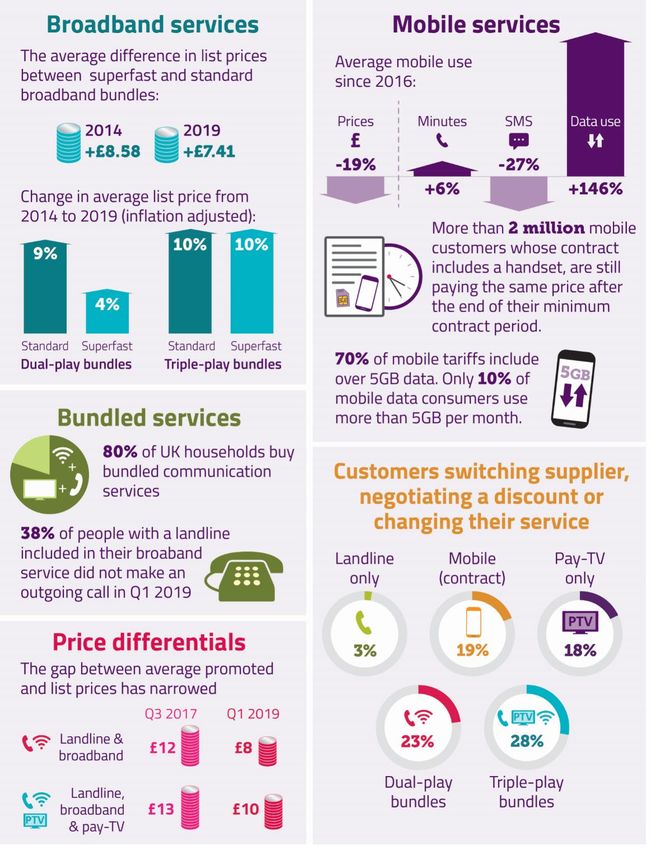
The price of mobile services is falling. Pay-monthly tariffs are generally tiered by the amount of
inclusive data, with 65% of tariffs including unlimited calls and texts. Prices of tariffs with a large
amount of inclusive data have been falling steeply, while customers who use less data can often
secure lower prices on pre-pay tariffs.
Mobile customers typically pay a lower overall price if they take a SIM-only deal. Our research
finds that using a SIM-only mobile service with a separately acquired handset is cheaper than buying
a smartphone bundled with an airtime contract. Bundled contracts were equivalent to the customer
being charged an APR (annual percentage rate) of 13-24% for their handset. The additional cost can
be much higher if customers do not move onto a SIM-only deal at the end of their contract.
Mobile prices in the UK compare well to those in other countries. Our analysis compares UK prices
with five comparator countries and finds that overall prices are lower than in France, Germany, Italy,
Spain and the US.
List prices for dual-play landline and fixed broadband services have been broadly stable since the
end of 2018. This is despite significant increases in average data use, indicating that people are
getting more for their money. Basic superfast dual-play list prices are around £7.50 per month higher
than for those of the equivalent standard broadband services, while promoted prices are on average
£5 per month higher for superfast services.
Prices for landline calls and call bundles continue to increase, although the rate has slowed
slightly. At the same time, average line rental charges have declined in real terms, and reduced price
line rental services are available to people that do not use fixed broadband.
Engaged customers tend to get better deals, but some customers lack confidence with finding the
best deal for them, such as understanding the language and terminology or comparing costs.
Despite the benefits of engaging, our research finds 28% of fixed broadband customers, and 35% of
mobile customers, are "apprehensive" about doing so.
Forty-one per cent of broadband customers are out-of-contract, based on customer-level data
collected in November 2018 and reported in our review of pricing practices in fixed broadband. 1
Prices usually increase for those who do nothing at the end of their contract: they pay an average of
£9-10 per month more than new customers and £8-9 more than those who re-contract.
Ofcom has a broad programme of work aimed at helping people get better deals and ensuring that
customers are treated fairly, including paying a fair price for their services. We have published an
update on this work alongside this report.
1Ofcom: Helping consumers get better deals: initial conclusions from our review of pricing practices in fixed broadband
and statement on end-of-contract notifications and annual best tariff information
2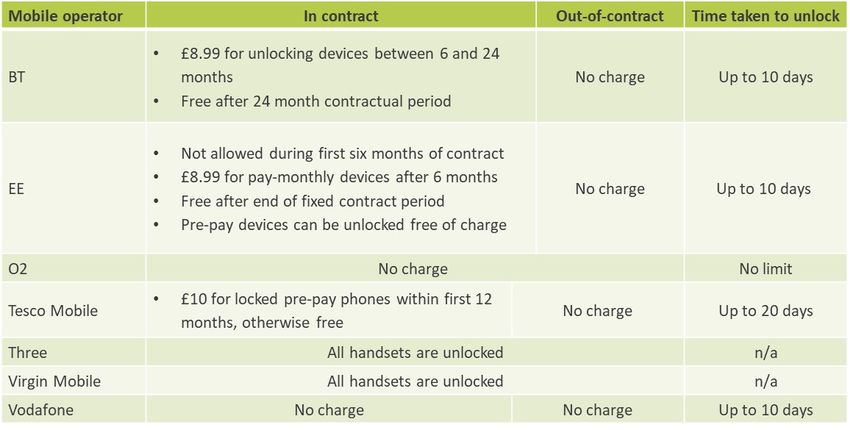
Pricing trends for communications services in the UK

Key metrics

                                                       3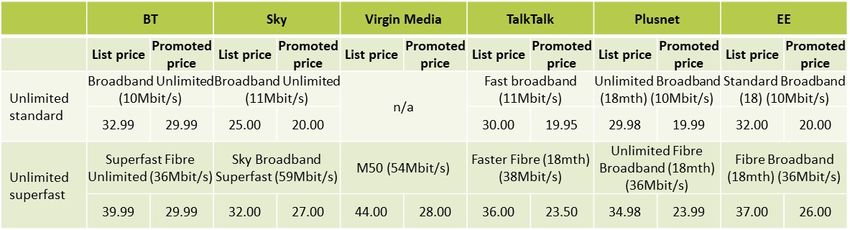
Pricing trends for communications services in the UK

Summary of findings
The price of mobile services has continued to fall
           •    The competitive focus in mobile is on data. Sixty-five per cent of pay-monthly tariffs
                have unlimited calls and texts, and tariffs are tiered according to the inclusive data
                allowance.
           •    Take-up of higher inclusive data and call bundles has contributed to a fall in average
                out-of-bundle mobile spend, down from £5 per month in Q3 2017 to £2 in Q1 2019.
           •    Analysis of mobile tariffs shows that prices are falling overall. The greatest declines
                have been in the prices of tariffs with high data allowances (>3GB/month) ̶ there were
                only small falls in the price for low data allowances(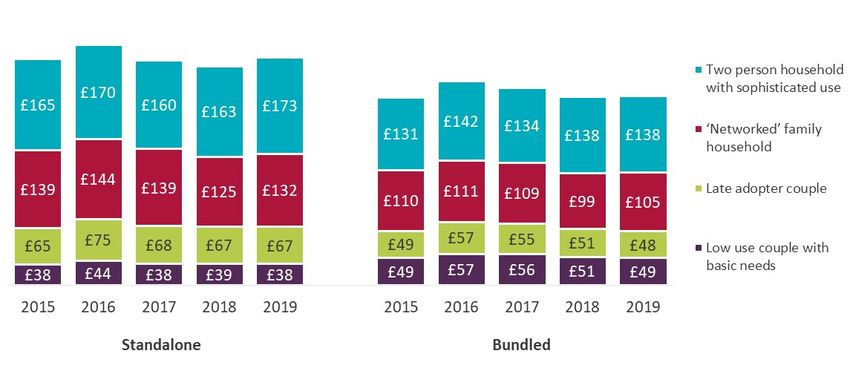
Pricing trends for communications services in the UK

             •    More than two million bundled handset and airtime pay-monthly mobile customers
                  continue to pay the same price after the end of their contractual term. Data collected
                  for our work on ensuring customers are treated fairly in the mobile market 5 found that
                  around 1.4 million customers could save money by switching to SIM-only, the total
                  annual saving being £182m, but also that 27% of out-of-contract pay-monthly
                  customers would be financially better off staying on their current deals rather than
                  switching to SIM-only.

Bundled services remain popular, providing consumers with savings
compared to buying the same services on a standalone basis
             •    Four in five households buy more than one communications service from the same
                  provider e.g. a dual-play landline and fixed broadband bundle or a triple-play service
                  that also includes traditional pay TV.
             •    People buying bundles continue to benefit from significant discounts. Bundling
                  (rather than buying services separately) resulted in lower prices for all of the household
                  profiles we looked at that include fixed broadband.
             •    The larger the bundle, the bigger the saving. Analysis of the price of communications
                  services designed to reflect the use of a ‘networked family’ using combinations of
                  bundled and standalone services shows that, in general, the more services in a bundle
                  the greater the saving.
             •    List prices for dual-play bundles with standard and superfast broadband have
                  stabilised since 2018. Superfast dual-play bundles tend to be priced at a premium of
                  around £7.50 per month more than the equivalent standard broadband dual-play
                  service.
             •    The prices of bundled dual-play and triple-play services in the UK are broadly in line
                  with European comparators. Our analysis finds that overall prices are more expensive
                  than those available in France, cheaper than those in Spain and comparable to those in
                  Germany and Italy.
             •    BT reduced the list price of its standard broadband dual-play bundles by £12.50 per
                  month to £32.99 in November 2018.

Our analysis highlights the availability of a wide range of good value deals,
but that some people lack confidence to engage in the market
             •    People can pay less for their communications services by switching provider or re-
                  contracting at the end of their minimum contractual period, instead of moving onto a
                  higher list price. Dual-play landline and broadband services are on average £8 per

5   Ofcom: Helping customers to get better deals in communications markets: mobile handsets.
                                                                                                          5
Pricing trends for communications services in the UK

               month cheaper than the list price during the promotional period, and triple-play
               landline, broadband and TV services are an average of £10 per month cheaper.
           •   More than one in ten dual- and triple-play customers had switched at least one
               service in their bundle in the year to September 2019. Standalone landline customers
               were the least likely to have switched (2%), while switching mobile contract provider
               increased significantly to 12% during the year (from 7-10% over the four previous
               years). 6
           •   Despite the savings that are available, our research suggests that around a third of
               consumers are ‘apprehensive’ about engaging – they are not confident in at least one
               aspect of engagement 7 and have not made any changes to their service in at least the
               last two years, nor are they planning to. The proportion varied by communications
               service, ranging from 28% for fixed broadband to 35% for mobile services. It varied
               further according to purchasing choices within a service i.e. standalone landline (68%)
               and pre-pay mobile (51%) users were the most likely to be categorised as
               ‘apprehensive’.

Some people are on deals that may not be well matched to their needs
           •   Many mobile consumers may be buying more data than they need. Data use has
               increased significantly in recent years, but while 70% of pay-monthly tariffs available
               include over 5GB data per month, research using a panel of Android smartphone users
               found that only 10% of mobile data users consume more than 5GB data per month and
               almost half consume less than 500MB. 8 Many consumers may prefer to buy more data
               than they need, either to reassure themselves in case of exceptionally high use in a
               particular month, or to future-proof their use in the later months of a contract. Further,
               by shopping around consumers can often increase their data allowance for little
               additional cost - plans with 500MB of data range from £4 to £14 per month, while 5GB
               data tariffs range from £9 to £19 per month.
           •   Increasing landline call prices highlights the importance of tariff choice. For example,
               BT has four main residential landline tariffs: our analysis of the cost for 100 outgoing
               call minutes (based on average residential landline use in 2018) showed a variation
               from £25 to £48 depending on which tariff was used.
           •   A wide range of prices are available for superfast dual-play packages. The most
               expensive package costs more than twice as much as the cheapest one, with prices
               determined by several factors including broadband connection speed, data allowance,
               call package/add-ons and the provider chosen. This highlights the importance of people
               understanding their requirements and choosing a suitable service.

6 In July Ofcom introduced mobile switching reforms which mean customers can change provider with a simple text.
7 The aspects of engagement referred to here are comparing costs, speaking to provider about deals and understanding
language and terminology.
8 Based on a sample of 150,000 Android users only.

                                                                                                                       6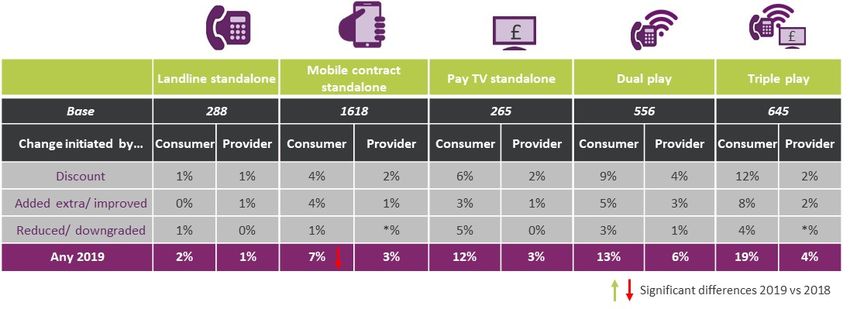
Pricing trends for communications services in the UK

Most landlines are bought as part of a bundle and many are not used to
make calls
             •   Less than one in ten of the major providers’ home landline customers bought a
                 standalone landline service in Q1 2019. Most people taking a standalone landline
                 service do not take broadband from another provider, and they are more likely than
                 average to be older and less affluent.
             •   Discounted line rental services are available for people who do not need fixed
                 broadband. These services are offered by BT (£11.99 per month) and the Post Office
                 (£11.50 per month).
             •   Our analysis of the price of landline services shows that standalone landline prices
                 increased in real terms in 2019. Taking into account the price of line rental, call bundles
                 and out-of-bundle calls, the price of services that can be used with broadband from
                 another provider increased by 3%, while the increase was lower (1%) for standalone
                 landline services that cannot be used with broadband.
             •   But line rental prices are falling. The average line rental price across the providers
                 which offer standalone landlines fell by 1% in real terms (i.e. adjusted for inflation) in
                 the year to June 2019. This compares to an average annual increase of 4% during the
                 previous five-year period.
             •   Many broadband users have a landline included in their service that they do not use
                 to make calls. Thirty-eight per cent of the major landline providers’ customers who buy
                 both landline and fixed broadband services from them did not make an outgoing
                 landline call in Q1 2019.
             •   Following a period of increase, call package prices stabilised in 2018. ‘Evening &
                 Weekend’ and ‘Anytime’ call bundle prices increased in real terms by an average
                 annual rate of 5% and 8% respectively between 2013 and 2018.
             •   Call connection fees and per-minute charges are increasing. Call connection fees and
                 per-minute charges for UK geographic calls increased by 11% and 18% respectively in
                 2018. This compares to average annual increases of 8-10% over the previous five-year
                 period. However, operator data shows that only around a fifth of landline calls are
                 outside call allowances.
             •   Residential out-of-bundle landline call revenues fell by 44% in the five years to 2018,
                 according to data collected every quarter from the main landline operators. 9 Outgoing
                 call volumes fell by 49% over the same period.

9   Ofcom Telecoms Data Update Q2 2019.
                                                                                                          7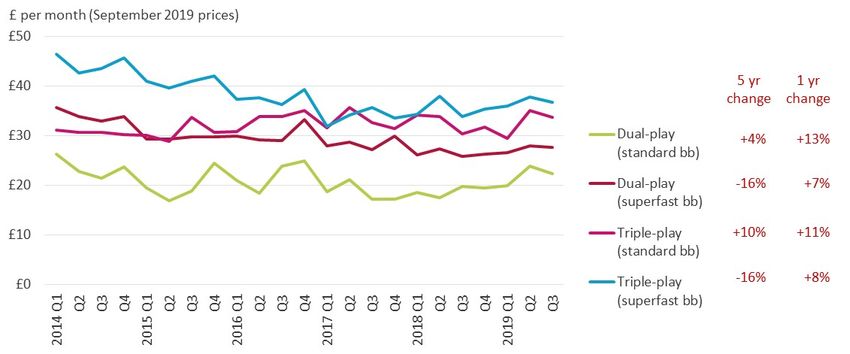
Pricing trends for communications services in the UK

Over-the-top (OTT) pay-TV services are increasing in popularity despite price
increases
             •     Average standalone basic pay-TV prices increased in 2019. This was partly because
                   Virgin Media stopped selling its lower-tier pay-TV services on a standalone basis.
             •     Around three-quarters of pay-TV services are bought as part of a bundle. Sky
                   introduced cheaper packages with fewer channels in late 2017, resulting in a fall in the
                   average list price of pay TV when purchased as part of a bundle. Average prices have
                   subsequently increased.
             •     Over-the-top (OTT) pay-TV services have become more expensive in 2019. Almost half
                   (47%) of UK homes took an OTT subscription service in Q2 2019. 10 Netflix increased the
                   prices of its standard (up £1 to £8.99) and premium (up £2 to £11.99) services in
                   October 2019, and NOW TV has increased the prices of its Entertainment (up £1 to
                   £8.99) and Sky Cinema passes (up £2 to £11.99) during the year.

Terminology used in this report

                 Standalone: Where a customer takes a single service from a communications provider
                 and not a bundled service. E.g. standalone mobile refers to a customer taking only a
                 mobile service from their communications provider.
                 Bundle: A combination of more than one service provided by a single communications
                 provider. This can include different types of service (e.g. broadband and landline or pay
                 TV and broadband) and be provided under one or multiple contracts.
                 Dual play: Two services provided by a single communications provider, most commonly
                 landline and broadband.
                 Triple play: Three services provided by a single communications provider, most
                 commonly landline, broadband and pay TV.
                 Quad play: Four services provided by a single communications provider, most commonly:
                 landline, broadband, pay TV and mobile.

10   BARB’s Establishment Survey.
                                                                                                             8
Pricing trends for communications services in the UK
Consumer engagement and its implications
Engaged customers can make savings
Some customers pay more than others for identical or very similar services bought from the same
provider. It is often the case that new customers, or customers who re-contract with their provider,
will pay lower prices than long-standing customers who have not changed their tariff. 11
Ofcom highlighted the prevalence and potential impact of differential pricing in the last Pricing
Trends for Communications Services report in May 2018, and subsequently launched separate
reviews looking at pricing in the mobile handsets and fixed broadband markets. 12 The mobile
handsets review is now complete, and we plan to complete our broadband pricing review by March
2020.
We have also introduced new rules, which take effect from February 2020, that require broadband,
phone and pay-TV firms to send important information to their customers when their contracts are
coming to an end and on a regular basis after that. This is to help people to take advantage of the
wide choice of services available, so that they can shop around with confidence and get the best
deals for their needs
Most out-of-contract pay-monthly mobile consumers could save by
switching to SIM-only
In last year’s report we highlighted our concern that some pay-monthly consumers receiving a
handset in a bundled airtime and handset mobile contract continue to pay the same price after the
end of their minimum contractual term, when they could save money on a SIM-only deal.
11 Citizens Advice initiated a super-complaint in September 2018, entitled 'Excessive prices for disengaged consumers'
which raised concerns that long-standing customers can pay more than new customers for their services. The super-
complaint related to five markets: mobile; broadband; cash savings; home insurance and mortgages.
12 We published the findings from our mobile handsets review in July 2019, and initial conclusions from our broadband
pricing review in September 2019.
9Pricing trends for communications services in the UK
Pay-monthly mobile contract types
There are three main types of pay-monthly mobile contract:
• a bundled contract is one where the customer signs up to a single contract and
receives a handset and airtime (calls, messages, data) for which they pay a single
monthly price;
• a split contract is one where the customer signs up to two contracts at the same
time, one for the mobile handset and one for the airtime; and
• a SIM-only contract is one where the customer signs up to a single contract and
receives airtime. The service is then used with a handset that is acquired separately.
In September 2018 we launched a review of mobile handset contracts, which looked at the market
in detail and analysed data relating to millions of mobile users in order to build an accurate picture
of the actual prices paid. 13 Our review found that 43% of pay-monthly customers (17.9 million) were
on a bundled mobile contract, 88% of those were in contract and 11% (approximately two million
customers) were out-of-contract.
Figure 1: Composition of pay-monthly mobile customers
Source: Ofcom: Helping customers to get better deals in communications markets: mobile handsets.
We then matched each of the out-of-contract customers with bundled mobile contracts in our
dataset to a comparable 30-day SIM-only service offered by their current provider, to estimate the
potential savings available to them. We found that 73% of out-of-contract pay-monthly customers
with bundled contracts (nearly 1.5 million people) could save money if they switched to a SIM-only
deal, saving on average around £11 per month.
However, around 27% of the total (over 500,000 people) would pay more if they switched to a SIM-
only tariff with the same provider. These were customers whose existing contracts compared
favourably with current SIM-only tariffs and tended to have been out-of-contract for longer.
13 Ofcom: Helping customers to get better deals in communications markets: mobile handsets.
10Pricing trends for communications services in the UK
Ofcom has secured voluntary discounts from most UK mobile providers to ensure that bundled
contract customers who are out-of-contract do not overpay. We therefore expect that the number
of customers who continue to pay the same price after their contract ends will fall from 2020.
Figure 2: Monthly savings available to out-of-contract pay-monthly customers
Source: Ofcom: Helping customers to get better deals in communications markets: mobile handsets.
Note: 3% of subscribers could not be matched to a SIM-only plan or no bundle information was
available.
Across all out-of-contract pay-monthly mobile customers (i.e. not just those with a bundled airtime
and handset contract as shown previously), 14 20% had been out-of-contract for less than three
months and 43% had been out-of-contract for more than a year.
Figure 3: Contract status of all pay-monthly mobile customers and average length of time out-of-
contract
Source: Operator data, figures as at end of Q1 2019.
Note: Includes BT Mobile, EE, iD Mobile, KCOM, O2, Plusnet, Sky, TalkTalk, Tesco Mobile, Three, Virgin Mobile
and Vodafone.
Includes those with bundled contracts, split contracts and SIM-only contracts with a minimum term of 12 months or
14
more.
11Pricing trends for communications services in the UK
Switching provider or re-contracting at the end of a broadband
contract will typically save people money
Switching provider or re-contracting at the end of a broadband contract, instead of moving onto a
higher list price, 15 typically saves people money. Not all customers do this, resulting in many people
paying different prices for the same service. We conducted a review of fixed broadband pricing
practices 16 and published our initial conclusions in September 2019.
By analysing customer-level data we found that people who switch or re-contract at the end of their
contract generally pay less. On average, new customers paid £9-10 less per month than out-of-
contract customers, and those who re-contracted with their existing provider paid £8-9 less per
month than those who remained out-of-contract. Operator data shows that 41% of broadband users
were out-of-contract in November 2018.
Consumers can secure discounts by negotiating with their provider
Consumers do not necessarily need to change provider to pay less for their services; Ofcom research
shows that many people negotiate a discount from their existing provider.
While around one in ten standalone traditional pay-TV (12%) and dual-play (13%) consumers had
proactively obtained a discount or adjusted their service in 2019, the proportion of triple-play
consumers who had done so was significantly higher (19%). A minority (2%) of standalone landline
users had contacted their provider to obtain a discount or change their service; standalone landline
users were typically the least engaged and the least likely to have switched provider.
Mobile was the only service to show a significant change in the proportion of customers contacting
their provider to make changes to their contract, falling from 10% to 7%. This was mainly due to a
decrease from 7% to 4% in the proportion who proactively contacted their provider to negotiate a
discount.
15 The list price is the price that the consumer will pay once the promotional period of their contract ends. This is usually at
the end of the minimum contractual period.
16 Ofcom: Helping consumers get better deals: A review of pricing practices in fixed broadband.
12Pricing trends for communications services in the UK
Figure 4: Changes to service/package when consumers stay with the same provider, year to
September 2019
Source: Ofcom Switching Tracker carried out by Critical Research in July to August 2019.
Base: Shown in table. All adults aged 16+ who are the decision-maker.
Note: Arrows indicate any significant difference between 2018 and 2019.
Q23/ Q24/Q25/Q26. In the last 12 months have you …received a discount, reduced/ downgraded or added
extra or improved services to your (SERVICE)? Did you contact your provider to receive a discount/ add extra or
improved services/ reduce or downgrade services or did they contact you? *% indicates that the proportion
having done this action is < 1%. At least three in ten consumers are not engaging, at least partly due to lack of
confidence.
There are several ways in which consumers can engage with the communications market.
Consumers could be ‘considering switching’, ‘keeping an eye on the market’ or ‘making changes to
existing services’. In order to effectively engage with the market, consumers should be confident in
the following three aspects of engagement a) understanding the language and terminology used by
providers, b) speaking to providers about new deals and c) comparing the costs of various offers.
Ofcom’s updated engagement index takes all these factors into account and classifies consumers as
being active, browsers, dormant, unmotivated, apprehensive or resigned. A brief description of each
of these segments is shown below. The detailed definitions used to create each segment can be
found in the Methodology annex.
• Active: The most recently engaged segment. They have taken one of more of the
following actions in the last year: switched supplier, negotiated with their existing
supplier or assessed the market.
• Browsers: Have not engaged as recently as the active segment but planning to and/or
are currently looking around.
• Dormant: Have either switched previously (13-24 months ago) or are in a new contract.
They may also have reactively made a change to their existing service in the last year.
• Unmotivated: Are confident with aspects of engagement but have not made any
changes to their service in at least the last two years, nor are they planning to.
13Pricing trends for communications services in the UK
• Apprehensive: Are not confident in at least one of the three aspects of engagement (as
set out above) and have not made any changes to their service in at least the last two
years, nor are they planning to. They say they are satisfied with their existing service.
• Resigned: Are unhappy with their existing service and have not sought to engage in at
least the last two years, nor are they planning to.
Figure 5: Engagement levels within service
Source: Ofcom Switching Tracker carried out by Critical Research in July to August 2019.
Base: All adults aged 16+ who are the decision-maker for a mobile phone – pay-monthly or pre-pay (2388),
contract mobile phone either standalone or bundled (1805), pre-pay mobile phone (583) the decision maker for
the household’s fixed broadband service (1617), the decision-maker for the household’s landline service (1681),
standalone landline – don’t use landline provider for another service (288), the decision-maker for the
household’s traditional pay-TV service (1110), standalone pay TV – don’t use main traditional pay-TV provider
for another service (265).
At an overall service level, at least half of landline, mobile and fixed broadband customers fell into
one of the more engaged segments (i.e. active, browser or dormant). These proportions varied by
purchasing behaviour within service and were lower among pre-pay mobile customers 36% and
standalone landline customers i.e. those who had a landline without broadband or had broadband
with a different supplier (19%).
Between 22%-27% of consumers across services fell into the most engaged segment and were
classified as ‘active’. This proportion was highest in the mobile market where pay-monthly
customers were more likely to be classified as ‘active’ than pre-pay users (28% vs. 20%). For the
landline market, around a quarter (24%) of customers were classified as ‘active’ with standalone
customers in this market the least ‘active’ (6%).
14Pricing trends for communications services in the UK
The new analysis highlighted a significant proportion of consumers as ‘apprehensive’. These people
had not engaged in the market recently (i.e. in the last two years) and were not confident in at least
one aspect of engagement (i.e. understanding language and terminology, speaking to providers
about deals, comparing costs), which may partly influence their inertia.
Overall, 28% of fixed broadband customers and 35% of mobile customers were classified as
‘apprehensive’. Standalone landline (68%) and pre-pay mobile (51%) customers were the most
apprehensive. Both of these sub-groups tend to be older; for pre-pay these consumers tended to
have had their handset for longer and were less likely than pay-monthly customers to use a
smartphone.
Mobile tariffs with high data allowances are commonplace
As consumption of data services over mobile networks increases, there is a continuing trend towards
pay-monthly services with unlimited voice and text allowances and large data allowances.
Teligen tariff data shows that 65% of pay-monthly price plans included unlimited voice calls and text
messages in July 2019, and figures provided by Simplify Digital show that in June 2019 there were
231 pay-monthly tariffs (36% of all tariffs) with 25GB or more inclusive data each month. In October
2019, EE, O2 and Vodafone’s lowest pay-monthly mobile services offered 1GB of inclusive data,
while Three’s started at 4GB.
Figure 6: Number and distribution of pay-monthly tariffs based on data allowance (%)
Source: Simplify Digital.
Note: Data as at June of each year; 24-month tariffs only.
There is a mismatch between average mobile data use and the
tariffs on offer
It is likely that many consumers are purchasing much more data than they need. Data collected from
mobile network operators shows that average monthly data use per mobile phone user was just
15Pricing trends for communications services in the UK
under 3GB per month in 2018 17; data in Ofcom’s Mobile Matters report, captured from a panel of
around 150,000 Android smartphone users, shows that only 10% of mobile data users used more
than 5GB of data per month in Q1 2019 and almost half used less than 500MB.
With the previous chart showing that 69% of pay-monthly tariffs in June 2019 included over 5GB of
data, many pay-monthly users may be purchasing a tariff with more data than they need. This could
be because they want to have certainty over their monthly expenditure and/or future-proof their
tariff against rising future use during the lifespan of their contract, the prevalence of services with
large data allowances meaning that they can do so for a small additional amount each month.
However, it may also be because they do not know how much data they use. By understanding their
use, people will be better positioned to choose the service that best meets their needs.
Figure 7: Distribution of average monthly mobile data consumption
Source: Ofcom: Mobile Matters report 2019.
Note: Data taken from a panel of Android smartphone users.
Increasing landline call prices highlight the importance of tariff
choice
Rising out-of-bundle call costs make it increasingly important for landline users to understand their
usage and choose a tariff that suits their needs.
Our analysis assesses the monthly cost of using a landline for 100 outgoing calls a month (broadly
based on average home landline use in 2018) for each of BT’s standard landline tariffs. Some of
these cannot be used with a fixed broadband service (line rental is available from £11.99 for
customers without a broadband service and from £18.99 for those with a broadband service). The
cheapest option is to buy an ‘Unlimited anytime plan’ for £9.50 per month, which reduces the out-
of-bundle spend by £26 per month, resulting in a net monthly saving of more than £16 compared to
the ‘Unlimited weekend plan’.
17Refer to the Communications Market Review 2019 for usage figures. Average monthly data volume usage excludes M2M
connections; in contrast with previous years.
16Pricing trends for communications services in the UK
Figure 8: Average monthly price of standalone BT landline services
Source: Ofcom using data supplied by Teligen, July 2019 data.
Note: The usage profile used in the analysis is broadly based on average home landline use in 2018 including
100 outgoing voice call minutes (85% UK geographic, 10% to UK mobiles, 5% international), 60% of calls in
daytime, 25% in evening, 15% at weekend; set-up costs are amortised over five years; excludes line rental saver
plans.
Broadband speeds
Standard broadband: A data service that delivers download speeds of up to 30Mbit/s.
Superfast broadband: A data service that delivers download speeds of at least 30 Mbit/s.
Ultrafast broadband: A data service that delivers download speeds greater than or equal
to 300 Mbit/s. This definition includes Giga-fast, cable networks and full-fibre
technologies.
17Pricing trends for communications services in the UK
Similar superfast dual-play services can range significantly in price
Promoted 18 prices for the major residential providers’ dual-play voice and superfast broadband
bundles ranged from £26 to £58 per month in Q2 2019, averaging £40. Several factors determined
the price paid, including the broadband connection bandwidth, inclusive call allowance, inclusive
data allowance and any add-ons, such as antivirus products and wi-fi boosters.
Once again, this highlights the importance of people understanding their usage and requirements
when choosing communications services.
Figure 9: Price range of dual-play superfast broadband offers from BT, Sky and TalkTalk
Source: Simplify Digital.
Note: Adjusted for CPI (Q2 2019 data); based on data from BT, Sky and TalkTalk; includes promotional
discounts where relevant; the white line represents the average (mean) price across all tariffs.
As well as complexity within tariffs (i.e. the number of service factors that determine the price paid),
the sheer number of available tariffs can make it difficult to identify the most appropriate service.
The major residential providers offered a total of around 100 dual-play and 170 triple-play bundle
tariffs in 2019. This was despite a notable fall in the number of triple-play tariffs at the end of 2017.
Sky stopped selling Sky+ bundles to concentrate on Sky Q bundles, while at the same time
simplifying tariffs for its core components (landline, call package, broadband and pay TV) and
allowing bundle customisation with add-on extras like Sky Sports.
18The promoted price is a reduced price (compared to the list price) paid by a consumer when they sign up to a broadband
service. The promoted price lasts for a specified period; often, but not always, equal to the minimum contractual period.
Once the promotional period has expired consumers revert to paying the list price.
18Pricing trends for communications services in the UK
Figure 10: Number of dual- and triple-play bundle offers
Source: Simplify Digital.
Note: Dual play: BT, EE, John Lewis, Plusnet, Post Office, Sky, TalkTalk, Virgin Media, Vodafone. Triple Play: BT,
EE, Sky, TalkTalk, Virgin Media.
Bundled customers are more likely than those purchasing
standalone services to switch
Analysis of data from Ofcom’s Switching Tracker research shows that customers who purchase
bundled communications services were more likely to switch provider than those taking standalone
landline.
More than one in ten (13%) dual- and triple-play customers had switched at least one service in their
bundle in the year to September 2019 (most doing so while remaining at the same address).
Standalone landline customers were the least likely to have switched (2%), following a significant
decline in switching levels during the year. Switching mobile contract provider increased significantly
to 12% during the year, having ranged from 7% to 10% over the four previous years.
19Pricing trends for communications services in the UK
Figure 11: Cross-market overview, switching in the 12 months to September 2019
Source: Ofcom Switching Tracker carried out by Critical Research in July to August 2019.
Base: Shown in table. All adults aged 16+ who are the decision-maker.
Notes: *Caution: Low base size, not tested for statistical significance; arrows indicate any significant difference
between 2018 and 2019. ¹ Dual-play refers to those who use the same provider for their landline and
broadband services (but not pay TV or mobile) – shown as DUAL in the data tables within the SIMPLE BUNDLE
TYPE cross-break; ² Triple-play refers to those who use the same provider for their landline and broadband
services and pay TV (but not mobile) – shown as TRIPLE in the data tables within the SIMPLE BUNDLE TYPE
cross-break.
Q28. Have you or your household ever CHANGED the company that provides your home landline service and/or
line rental?/ your mobile phone service?/ your broadband service?/ your main television service?/ Q29. Did you
make this recent change of (SERVICE) provider at the same time as moving home?
20Pricing trends for communications services in the UK
Pricing of bundled services
Four in five households purchase bundled communications services
Eighty per cent of UK households buy two or more communications services from the same provider
as part of a bundle.
High take-up of bundles means that bundled service prices are more relevant than standalone
service prices to UK households. Dual-play landline and fixed broadband, and triple-play landline,
fixed broadband and pay TV are the most popular types of bundles, together accounting for around
three-quarters of UK bundles.
Figure 12: Proportion of users, by type of bundled services
Source: Ofcom Technology Tracker.
Note: ‘Other’ includes all other bundle types not specified in the chart; arrows indicate significant differences at
the 95% confidence level between 2018 and 2019.
QG1. Do you receive more than one of these services as part of an overall deal or package from the same
supplier? / Q. Do you receive a discount or special deal for subscribing to this package of services? (latter
question used for consumer-stated bundling figures).
Base: All adults 16+ (2016, 3737) (2017, 3743) (2018, 3730) (2019, 3909). Base excludes those who do not
know the provider of one or more of their services.
21Pricing trends for communications services in the UK
Households can make savings when purchasing bundles from a
single provider
A key consideration for many people when purchasing a bundle is that it is usually cheaper than
buying the same services on a standalone basis from multiple providers, while bundles also enable
customers to benefit from the convenience of receiving one bill for multiple services and having a
single point of contact for them.
Price monitoring using household user profiles
We track the prices that are available to consumers by analysing the cost of different
usage profiles for communications services designed to reflect ‘typical’ households’
usage.
This analysis uses a model provided by pricing specialists Teligen. It calculates the lowest
prices available to fulfil the requirements of each usage profile using the published tariffs
available from major operators. We then calculate an average price for each household
from all of these lowest prices, weighting the results by provider retail market shares.
See the Methodology for full details.
Our analysis shows that in July 2019 it was cheaper for all of the households that required a fixed
broadband connection to purchase bundled services, with the average savings ranging from 20% to
28%. However, there are instances where bundling may not result in customers paying lower prices;
for example, the low-use couple with basic needs user profile, which only needs landline and mobile
phone services. Our analysis suggests that buying these services in a bundle would, on average, cost
them an extra £11 per month in 2019.
This is for two reasons: bundling often means that they would have to buy a service they did not
need (fixed broadband is a core component of most bundles); and because low-cost line rental
landline services are available to people who do not take fixed broadband.
Our new rules requiring providers to send their customers end-of-contract notifications and annual
best-tariff advice from February 2020 will ensure that people are equipped with better information
on which to make purchasing decisions. These rules include a requirement for providers to inform
people that they may get a better deal if they purchase their services as a bundle.
22Pricing trends for communications services in the UK
Figure 13: Weighted average monthly price for standalone and bundled services
Source: Ofcom, using data provided by Teligen.
Note: The households are designed to reflect four different usage patterns, each requiring set amounts of
landline, mobile phone, fixed broadband and TV services. Weighted average tariff for primary providers;
includes promotional discounts; CPI adjusted; figures have been rounded to the nearest whole number;
standalone services are considered for landline, broadband, mobile and pay TV.
Prices for new contracts have increased for dual- and triple-play
bundles
In the past year the prices that major Internet Service Providers (ISPs) have offered new customers
(i.e. the promoted prices, which typically include a discount on the list price for some or all of the
contract period) have increased for both dual- and triple-play bundles, whether these include
standard or superfast broadband. However, in some cases this is due to providers including more
features in their basic ‘unlimited’ bundles, for example by including call packs or family internet
access controls. The fluctuations in the prices shown are due to providers making frequent changes
to the offers that are available.
23Pricing trends for communications services in the UK Figure 14: Average available monthly promoted prices for dual- and triple-play, standard and superfast broadband Source: Ofcom / Pure Pricing UK Broadband Updates. Notes: Represents average of the cheapest available tariff from BT, Plusnet, Virgin Media, TalkTalk, Sky and EE at the end of each quarter; promotions include the promoted price and any ‘gifts’ offered; adjusted for CPI (September 2019); standard broadband products are those with an advertised speed
Pricing trends for communications services in the UK

Figure 15: Average available monthly list prices for dual- and triple-play, standard and superfast
broadband

Source: Ofcom / Pure Pricing UK Broadband Updates.
Note: Since Q1 2016 standard triple-play services are only offered by three of the major ISPs. Represents
average of the cheapest available tariff from BT, Plusnet, Virgin Media, TalkTalk, Sky and EE at the end of each
quarter; adjusted for CPI (September 2019); standard broadband products are those with an advertised speed
Pricing trends for communications services in the UK

Figure 16: Average available monthly list and promoted prices for dual-play standard and
superfast broadband

Source: Ofcom / Pure Pricing UK Broadband Updates.
Notes: Represents average of the cheapest available tariff from BT, Plusnet, Virgin Media, TalkTalk, Sky and EE
at the end of each quarter; promotions include the promoted price and any ‘gifts’ offered; adjusted for CPI
(September 2019); standard broadband products are those with an advertised speed
Pricing trends for communications services in the UK

Figure 17: List prices for major ISPs’ cheapest dual-play bundles with standard broadband

Source: Ofcom / Pure Pricing UK Broadband Updates.
Note: Represents the cheapest available tariffs offered in the last month of each quarter; adjusted for CPI;
standard broadband products are those with an advertised speed
Pricing trends for communications services in the UK

Figure 18: Difference between advertised list and promoted prices for standard and superfast
broadband, by operator

Source: Operator websites (tariff data collected 1 September 2019).

            Superfast / ultrafast broadband technologies
            Fibre to the cabinet (FTTC): Broadband delivered via optical fibre extending from the
            access node to the street cabinet, usually located only a few hundred metres from the
            subscriber premises. To reach the customer’s premises a copper pair is usually used but
            another technology such as wireless could be used;
            Full-fibre / fibre to the premises (FTTP): Broadband delivered via optical fibre all the way
            from the local exchange to the end user’s premises.
            Cable: Broadband delivered via hybrid fibre coaxial (HFC) cable networks using optical
            fibre and coaxial cables.

Several providers offer ultrafast broadband over full-fibre networks
Although coverage is geographically limited, 21 most of the major internet service providers (ISPs) and
some smaller local operators now offer ultrafast broadband products (those with an advertised
download speed of 300Mbit/s or higher) delivered over full-fibre networks. The chart below shows
some of the tariffs offered by the larger full-fibre providers; on average, based on promoted prices,
ultrafast services cost around £18 per month more than the equivalent superfast services with
advertised speeds below 100Mbit/s.

21Ofcom’s Connected Nations 2019 report shows that by September 2019 just over half of UK premises (53%) could
receive ultrafast broadband and 10% of premises (over 3 million) could receive full-fibre broadband.
                                                                                                                 28
Pricing trends for communications services in the UK
Figure 19: Selected full-fibre broadband service pricing: October 2019
BT Gigaclear Hyperoptic Sky TalkTalk Virgin Media Vodafone
FastestPricing trends for communications services in the UK
Pricing of standalone mobile voice and data
services
Mobile users are getting more for less
To compare the prices of mobile services over time we use Teligen’s pricing model to find the
lowest-cost tariff from each of the mobile operators that meets the requirements of an average
mobile user – i.e. the average calls, texts and data used by a mobile connection in the UK in that year
(excluding handset cost). We then calculate an average price from all these lowest prices, weighting
it by retail market share. See the Methodology for full details.
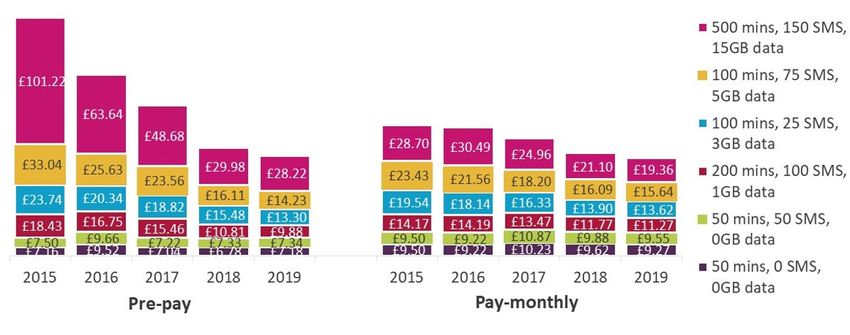
The average cost of a mobile service based on average use in 2019 was £12.57 per month, a £1.54
(11%) decline in real terms compared to 2018. This was despite an estimated 22% increase in data
use during the year (which was accompanied by falling estimated average voice and text use).
Figure 20: Weighted average monthly prices for average mobile use (excluding handset cost)
Source: Ofcom, using data provided by Teligen.
Note: Based on prices excluding handset costs; includes promotional discounts; average monthly data volume
usage excludes M2M connections; pre 2017 usage figures include dedicated data mobile connections and
related data volumes; 2019 figures are estimated based on average usage in H1 2019; adjusted for CPI.
Prices are falling most steeply for high data tariffs
To better understand how prices are changing for different types of mobile user, we created six
mobile user profiles to represent a wide range of consumer mobile usage types, and used the
30Pricing trends for communications services in the UK
Teligen model to calculate the average price. 22 Our analysis shows that average prices fell for all
mobile user profiles in 2019, the total price of the six profiles falling by 11% during the year. The
greatest declines were in the average prices of those profiles with the highest data requirements.
Figure 21: Weighted average monthly prices of standalone mobile services (excluding handset
cost)
Source: Ofcom / Teligen.
Note: CPI Adjusted.
Out-of-bundle mobile-originated call charges fell slightly in 2019
Average pence-per-minute charges for those pre-pay and pay-monthly mobile tariffs which charge
for out-of-bundle calls to UK landlines and mobiles fell slightly in real terms in 2019. The average
per-minute price across these call types declined by 1% in real terms in the year to July 2019,
following a 17% increase over the previous three-year period.
The increasing availability and take-up of mobile services with unlimited voice/text bundles and high
inclusive data allowances has meant that out-of-bundle use is becoming less common. The data that
Ofcom collects from mobile network operators shows a steep decline in out-of-bundle spend (i.e.
calls, messaging and data that are not included in the monthly fee). In Q1 2019 average out-of-
bundle spend was £1.89 a month – down from £5.29 per month in Q3 2017.
Nevertheless, high per-minute out-of-bundle charges (see Figure 25 below) mean that customers
making calls outside their allowance can quickly rack up a hefty bill. But there are ways in which
consumers can protect themselves: all consumers committing to a mobile contract after 1 October
2019 must be given the opportunity by their mobile provider to specify a billing limit in their
22Using the Teligen pricing model, we calculated the average price to fulfil the usage requirements of each user profile
(again, excluding the cost of a handset). The profiles in this year’s report have been redefined due to changing use by
different customer types.
31Pricing trends for communications services in the UK
contract. 23 This allows consumers to manage their expenditure and helps avoid bill shock when their
use exceeds the allowance.
There are also new protections for calls and texts made between EU countries (these calls are
typically not included in inclusive call allowances). Price caps were introduced on 15 May 2019 24
meaning that calls made between EU countries are capped at around 16p per minute (excluding
VAT) and texts at around 5p per message (excluding VAT). After Brexit, customers may see changes
to how calls and texts from the UK to the EU are charged.
Figure 22: Average out-of-bundle call charges for calls from mobile phones
Source: Ofcom, using data provided by Teligen.
Note: Excludes tariffs for which out-of-bundle call charges are not relevant for these call types; includes pre-pay
and pay-monthly tariffs; based on tariffs offered by EE, Orange, T-Mobile, O2, GiffGaff, Vodafone, Three, Tesco
Mobile, Virgin Mobile, Lebara, iD Mobile, Sky and Lycamobile; includes VAT; adjusted for CPI. On-net calls are
made between customers on the same mobile network, while off-net calls are made between different mobile
networks.
Older and less affluent consumers are more likely to use pre-pay
services
While just over one in five consumers use pre-pay mobile services, 61% of those aged 75+ and 40%
of those in the DE socio-economic group are pre-pay users. This might be through choice, as pre-pay
potentially offers greater control over mobile spend, but it might also be through necessity, as those
with a poor credit rating may not pass the credit checks required for pay-monthly).
23 Digital Economy Act 2017 - Billing limits for mobile phones.
24 Calls and texts to other EU countries.
32Pricing trends for communications services in the UK
Figure 23: Proportion of mobile customer, by age and socio-economic group: 2019
Source: Ofcom Technology Tracker.
Note: QD11. Which of these best describes the mobile package you personally use most often?
Base: Adults 16+ who personally use a mobile phone (2019, 3598).
Pre-pay tends be cheaper for low data users
Our analysis of prices for the six different mobile usage profiles finds that weighted average pre-pay
prices were lower than weighted average pay-monthly prices for all but the highest usage
consumers. For the highest mobile usage profile, the average pay-monthly price was 31% less than
the weighted average pre-pay price. Pre-pay was around 30% cheaper than pay-monthly for the
usage profiles without any data use.
Most pre-pay tariffs are ‘hybrid’ tariffs, which enable users to buy a pack of inclusive calls/texts/data
for a set monthly fee that expires after a month, with any use outside these allowances being taken
from a more traditional pre-pay credit balance. Hybrid services therefore enable pre-pay users to
benefit from inclusive allowances, in much the same way that pay-monthly users do. Traditional pre-
pay tariffs, where the cost of any usage is deducted from a credit balance are few and far between.
Reassuringly, this finding suggests that consumers whose circumstances make it difficult for them to
subscribe to a pay-monthly tariff can use pre-pay mobile services at a similar or slightly lower price
to pay-monthly users, unless they are particularly heavy data users, in which case pay-monthly is
significantly cheaper. However, as with pay-monthly services, it is important that pre-pay users shop
around to get the tariffs that best meet their needs; they can also benefit from inclusive allowances,
in much the same way that pay-monthly users do, by taking a hybrid pre-pay tariff. 25
25Hybrid tariffs enable users to buy a pack of inclusive calls/SMS services that expires after a month for a set monthly fee,
with any use outside these allowances being taken from a more traditional pre-pay credit balance.
33Pricing trends for communications services in the UK
Figure 24: Weighted average monthly pre-pay and pay-monthly mobile pricing (excluding handset
cost)
Source: Ofcom / Teligen.
Note: CPI adjusted (July 2019 prices).
SIM-only plans continue to grow in popularity
Bundled (handset and airtime) contracts accounted for less than half of pay-monthly contracts for
the first time in 2019. SIM-only contracts with a 12-month minimum term have seen the greatest
growth, accounting for more than a third of pay-monthly subscriptions in 2019. Growth in the use of
SIM-only has been fuelled by people keeping their handsets for longer. This is driven by high handset
prices (some models cost over £1,000) and incremental handset innovation, which have also
resulted in a thriving market for refurbished handsets.
Figure 25: Composition of pay-monthly contracts from January 2014 to January 2019
Source: Ofcom: Helping customers to get better deals in communications markets: mobile handsets.
34Pricing trends for communications services in the UK
It is often cheaper to buy a handset separately from the airtime
Many consumers continue to purchase their handset and airtime from the same provider (either in a
bundled contract or as split contracts) 26 because it is convenient and enables them to spread the
cost of the device over the minimum contract term, rather than having to pay for it all at once.
However, pay-monthly users acquiring a handset with their airtime contract may end up paying
more than if they bought the handset outright and used it with a SIM-only plan. Our analysis shows
that in 2019 the average price of buying a mid-range handset outright and using it with a SIM-only
plan was consistently cheaper than when buying the handset bundled with a pay-monthly plan. On
average, buying a phone with a mobile service was around 24% more expensive than buying a SIM-
free phone and using it with a SIM-only deal.
We also compared the total cost of acquiring an iPhone XR 128GB with an airtime contract to that of
buying the phone outright and using it with a comparable SIM-only plan, using tariffs offered by the
UK’s mobile network providers. 27 We found that it was cheaper to purchase the handset and use it
with a SIM-only service in all four of the examples we looked at, and that the difference between the
two prices was equivalent to customers being charged an APR (annual percentage rate) of between
13% and 24% - on their handset.
Figure 26: Weighted average monthly price of a handset with pay-monthly or when purchased
separately to use with a SIM-only plan
Source: Ofcom using data supplied by Teligen.
Note: Calculated prices for mid-range handset across years; weighted average tariff for primary providers;
adjusted for CPI; prices excluding additional usage charges.
26See page 9 for definitions of bundled and split pay-monthly mobile contracts.
27The estimated price of the phone over the contract period is calculated and compared with the actual price of the same
bought phone. Differences in data package sizes offered makes it hard to precisely compare providers. The general trend
shows it is cheaper to buy a handset and a SIM-only contract separately instead of buying a pay-monthly contract.
35Pricing trends for communications services in the UK
There is a growing market for refurbished handsets in the UK
There has been growth in the second-hand/refurbished handset market as handset prices have
risen. One in ten mobile phone users say that their principal mobile is a second-hand model. 28
Refurbished handsets are estimated to account for a further 4% of the handset market and can be
bought directly from mobile operators, from specialists in replacement phones or other third-party
sources.
We carried out analysis of the different prices of refurbished handsets for two models: Apple’s
iPhone X and Samsung’s Galaxy S9. Depending on condition, a refurbished iPhone X (RRP: £799.99)
costs between £470 and £580, while a Samsung Galaxy S9 (with the same RRP) costs between £339
and £619. 29
Handsets are frequently handed down to family members or passed to friends. This may require a
handset to be unlocked. Customers will also need to unlock their handset if they are switching their
SIM card to move to a new mobile provider. Details of the major mobile providers’ handset
locking/unlocking policies and costs (where applicable) are shown below.
Figure 27: Overview of handset locking conditions by mobile operator
Source: Company websites. September 2019 and operator data.
28Research by CCS Insight. July 2018.
29Prices correct at time of writing. Research is not exhaustive. In some cases, the handset model and memory size may
vary.
36You can also read