Choosing the best broadband, mobile and landline provider - Comparing Service Quality 2017 - Ofcom
←
→
Page content transcription
If your browser does not render page correctly, please read the page content below

Choosing the best broadband,
 mobile and landline provider
    Comparing Service Quality 2017

           Published 03 May 2018
About this document

This is the second annual Ofcom report on how telecoms providers are performing. It shows the
quality of service offered by the UK’s main broadband, mobile and landline providers to their
customers in 2017. The information has been collected through our own research, directly from
providers, and from third parties.

We want to shine a light on providers’ performance to help consumers make more informed
decisions, and to give providers additional incentives to improve the quality of the service they
provide.

We will publish information at least annually to give consumers an up-to-date view on how providers
are performing.

                                                                                                      2
Contents
About this document ......................................................................................... 2
Summary ........................................................................................................... 4
Dashboards ...................................................................................................... 10
Background to the report ................................................................................ 13
Residential landline and fixed broadband services .......................................... 17
Residential mobile services .............................................................................. 45
Business services – fixed and mobile............................................................... 57
Glossary ........................................................................................................... 62

                                                                                                                          3
Summary

Service quality matters

Communications services such as our home phone, mobile and broadband, help to keep us
entertained, stay in touch with friends and family and make everyday tasks easier. But when they go
wrong it can be inconvenient, disruptive and expensive. This means it’s vital that communications
providers deliver reliable services, and offer proper support when things aren’t working.

Shining a light on customers’ experiences means people can easily compare the service quality
available. It allows them to look beyond the price and get a much richer picture of what they can
expect from different companies. It also gives providers a clear incentive to improve their service
quality.

This report looks at how well the larger providers did in 2017 1, based on information from
consumers and industry.

Mobile phones
Overall, the vast majority of mobile phone customers were satisfied with their service
When asked, just over nine in ten mobile customers said they were satisfied with their service
overall; which has not changed since 2016.

A small minority (4%) had a reason to complain. When they did, the main cause was that their
service was not performing as it should be, followed by a billing, pricing or payment issue. Over half
of mobile customers (56%) who complained to their provider were satisfied with how their
complaint was handled, which was in line with 2016.

1
 The fieldwork for the customer satisfaction and recommend to a friend market research was conducted
between 5 January and February 2018.

                                                                                                         4
Of the main mobile providers, giffgaff and Tesco
Mobile scored highly for customer satisfaction
The two mobile providers that ranked higher than
average for overall customer satisfaction were giffgaff
and Tesco Mobile; while Virgin Mobile and Vodafone
both ranked lower than average.

Customers of giffgaff and Tesco Mobile were
more likely to say they would recommend their
provider
When asked, giffgaff and Tesco Mobile customers
were more likely than average to say they would
recommend their provider to a friend. 2 In contrast,
Virgin Mobile and Vodafone customers were less
likely to say they would do so.

Home broadband
Fast broadband has become essential for day-to-day activities such as business, entertainment and
socialising. The amount of data residential broadband customers used per line last year grew by
44%.

Average download speeds have also been rising sharply in recent years. The main reason for this has
been the growth in take-up of superfast broadband packages.

However, although superfast broadband is now available to 93% of premises, around two in five still
use standard broadband. This is reflected in the slower speeds that some households receive. Most
homes on standard broadband packages could receive faster speeds if they upgraded to faster
broadband packages.

2
  Net Promoter ScoreTM (NPSTM), see Annex 2 for further details on how this metric is calculated. The average
‘recommend to a friend’ score in the mobile market was good (22). Giffgaff and Tesco Mobile had “excellent”
scores, while all other mobile providers had “good” scores.

                                                                                                                5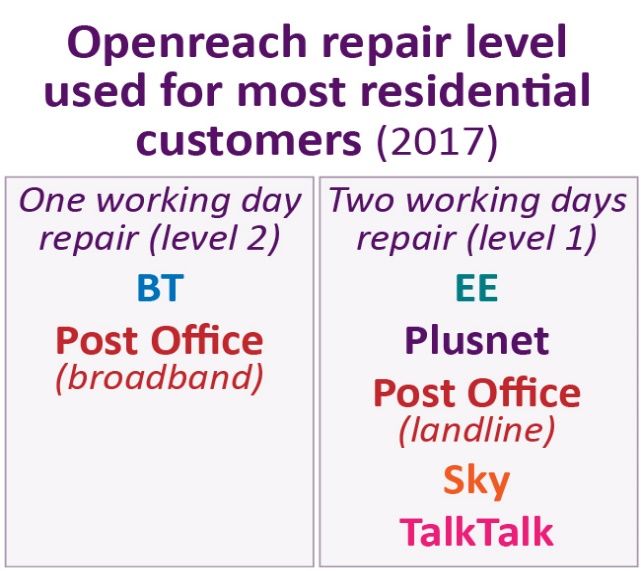
Broadband customers’ overall satisfaction has fallen since 2016
Eight in ten broadband customers were satisfied with their service overall, down from just less than
nine in ten in 2016. Customers highlighted that their dissatisfaction was mainly due to unreliable
broadband connections and slow speeds.

TalkTalk’s broadband customers were less satisfied than average with their service overall. 3

Customers on faster broadband packages were more satisfied with the speed they
received
Broadband customers’ satisfaction with the speeds they received has fallen compared to 2016,
(from 83% to 77%), however those on faster broadband packages were more satisfied than those on
standard broadband packages.

Virgin Media was the only provider with above average customer satisfaction with broadband
speeds.

Virgin Media broadband customers were
more likely to recommend their provider
When asked, Virgin Media’s customers were more
likely than average to say they would recommend
their provider to a friend. 4 TalkTalk’s customers
were less likely to say they would do so.

There has been a rise in the proportion of broadband customers with a reason to
complain
One in seven broadband customers had a reason to complain in 2017, (a rise from 13% in 2016 to
15%). By far the most common cause was a slow and patchy connection. At 18%, TalkTalk customers
were more likely than average to have had a reason to complain.

3
 All other providers’ scores were in line with the average.
4
 The average ‘recommend to a friend’ score in the broadband market was good (6). Virgin Media’s score was
15, while TalkTalk’s was -13.

                                                                                                            6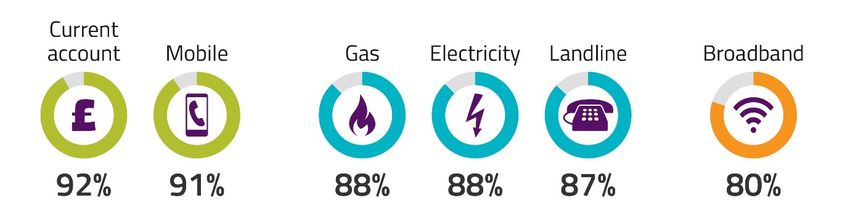
Broadband providers need to improve their handling of complaints
Broadband customers’ satisfaction with their how their complaints were handled fell in 2017 (from
56% to 50%). In particular, people were less happy with how their complaints about broadband
service quality issues, such as slow broadband speeds, were handled.

EE and Sky had high customer satisfaction with
complaints handling 5
There were differences in satisfaction with how
broadband providers handled complaints. Almost three-
fifths of EE and Sky customers said they were satisfied,
but only two-fifths of TalkTalk’s customers were satisfied.

On average, EE broadband customers had the shortest wait to speak to their provider on
the phone
The average time broadband customers had to wait to
speak to their provider on the phone varied widely. Of
the largest broadband providers, EE customers had the
shortest wait time (48 seconds on average). Plusnet’s
customers had the longest wait, of just under eight
minutes.

Most home phone and broadband orders were installed within 13 calendar days, but a
small minority took more than four weeks
The majority of new landline and broadband orders were delivered by the date agreed with the
customer, including any rearrangements agreed in advance. On average, new services were
delivered by the main providers within 13 calendar days. 6 However, a small minority of orders (less
than 6%) took more than four weeks to be delivered. Sometimes long installation times are due to
factors outside providers’ control; for example, where permission to conduct street works is
required, or right of way needs to be agreed to install equipment on private land.

5
 Compared to the average.
6
 The time taken to deliver a new order depends on the type of order and network used, see main report for
details.

                                                                                                            7
BT and Post Office (broadband) have prioritised service quality by paying for quicker
repairs than other providers on the Openreach network
Where service issues are caused by network faults 7, providers need to ensure they are fixed quickly.
If providers using Openreach identify a network fault, they rely on Openreach engineers to fix the
problem. How quickly that fault is fixed depends in part on which Openreach service level the
provider buys.

In 2017, BT and the Post Office (broadband) were the only
providers that paid for Openreach to fix faults within one
working day for most of their customers. Most major
providers on the Openreach network paid for repairs within
two working days. Although Openreach does not fix every
fault on time, BT and Post Office (broadband) customers will
generally have their service fixed more quickly than other
major providers on Openreach’s network.                                 One working day is the basic service
                                                                        level for fibre-to-the cabinet products

Service problems can arise in the home, as well as on the network
If diagnosed correctly, problems in the home can often be resolved quickly by providers through
effective customer support. Consumers can also use Ofcom’s broadband checker app to test their
broadband connection and get tips on how to improve it. We have also published new guides on
how consumers can improve their broadband speeds.

Comparison with other sectors
Overall satisfaction among mobile customers was in line with that among current account
customers, and above gas, electricity and landline customers. However, satisfaction among
broadband customers was below all of these other sectors.

7
 We estimate that these faults occur approximately every 8 to 9 years for lines carrying standard broadband
services, once every 12 years for landline-only services, and once every 7 years for line carrying superfast
broadband services.

                                                                                                                  8
How Ofcom is working to improve service quality in the
communications sector
This report is just one element of Ofcom’s plan to improve service quality, which also includes:

    •   introducing automatic compensation for slow repairs, missed appointments and delayed
        installations from March 2019;

    •   improving the Broadband Speeds Codes of Practice, to give new customers more accurate
        speeds information and a stronger right to exit if their speed falls below the minimum
        guaranteed level from March 2019;

    •   strengthening the rules on complaints handling to ensure that providers deal with
        complaints from consumers promptly and effectively, from October 2018;

    •   setting tougher quality of service standards for Openreach to install new lines and fix faults
        more quickly. These came into effect on 1 April 2018;

    •   setting wholesale price controls that strengthen Openreach’s incentives to make long-term
        investments in service quality. These came into effect on 1 April 2018; and

    •   supporting the rollout of competing full-fibre networks, which will enable faster speeds and
        provide a more reliable service. In addition, the broadband USO will help improve speeds for
        those who currently get less than 10 Mbit/s.

                                                                                                         9
Dashboards

                                                         Broadband – overview of key data

Note: For definitions and methodology see relevant report section and annexes 1-2. Call waiting times are calculated for landline and broadband services together. Average
call waiting time includes KCOM and Post Office. Red or green shading and * indicates significantly lower/higher than the sector average at the 95% confidence level for
market research results.

                                                                                                                                                                             10
Landline – overview of key data
Note: For definitions and methodology see relevant report section and annexes 1-2. Call waiting times are calculated for landline and broadband services together. Average
call waiting time includes KCOM. Red or green shading and * indicates significantly lower/higher than the sector average at the 95% confidence level for market research
results. A sufficient sample was not obtained in the satisfaction research to be able to publish a metric for Post Office. Inclusion criteria for satisfaction with complaints
handling research is those providers with a 4% or more market share; ‘-‘ represents no data for satisfaction with complaint handling due to providers having a market share
of below 4% at Q1 2017.
11Mobile – overview of key data
Note: For definitions and methodology see relevant report section and annexes 1-2. Red or green shading and * indicates significantly lower/higher than the sector average
at the 95% confidence level. Vodafone’s data on call waiting times was not comparable to other providers. giffgaff does not have a call centre and it does not meet the
market share threshold to be included in Ofcom’s published complaints data. Ofcom complaints data: Due to the different methodologies used to compile subscriber figures,
we have identified through sensitivity checks that BT Mobile’s performance in 2017 may be comparable to Vodafone. A sufficient sample was not obtained in the customer
satisfaction research, satisfaction with complaints handling and reason to complain research to be able to publish a metric for BT Mobile.
12Background
to the report
Service quality and the consumer experience
We rely heavily on phone and broadband services in our everyday lives, from keeping in touch with
friends and family, to shopping or banking online, as well as for work. Our use of broadband services
in particular has been evolving rapidly, and this has been reflected in a significant rise in the amount
of data we use. 8
It is essential that these services are reliable and perform well. If phone and broadband services are
unreliable, they can quickly become a cause of real frustration. If they stop working completely, they
can disrupt life at home and at work. When problems arise, it is vital that communications providers
support consumers and address their issues effectively.
For consumers to be able to compare how different providers are performing, they need clear
information on service quality. The aim of this report is to make such information available so that
consumers can make informed purchasing decisions, and to give providers additional incentives to
improve their performance.
This report focuses on the service quality 9 offered by the main landline, fixed broadband and mobile
providers in 2017:
• For residential fixed services, the main providers included are BT, EE, KCOM (Hull & East
Yorkshire only), Plusnet, Post Office, Sky, TalkTalk and Virgin Media.
• For residential mobile services the main providers included are BT Mobile, EE, giffgaff, O2,
Tesco Mobile, Three, Virgin Mobile and Vodafone.
8
Average data use per fixed line residential broadband connection increased by 44% year on year in June
2017, and average data use per mobile connection increased by 46%. See Ofcom, 2017, Connected Nations
Report, p.15, p.20.
9
In this report, service quality covers both service reliability and performance, as well as how effectively
providers support consumers when they need help.
13• For business fixed services, the providers included are BT Business, TalkTalk Business,
Verastar, Virgin Media Business and XLN Telecom; and
• For business mobile services, the providers included are EE, O2 and Vodafone.
Information in this report
As with our first Comparing Service Quality report (published in 2017), 10 we draw on Ofcom market
research, complaints to Ofcom and to ADR schemes, as well as communications providers’ own
data. 11 In addition to trend data compared to last year, we have included new data this year, in
particular a new measure of the likelihood of customers to recommend their current provider to a
friend. 12
As with last year’s report, when requesting data from providers we have been limited to collecting
data that they already hold for their own internal business purposes. In some cases, providers do not
appear to be collecting data to measure the real consumer experience. For example, some providers
are unable to report on their success at completing a new order on the date promised to the
customer because they overwrite the original date if any changes are made to that date.
This makes it difficult to obtain comparable results, as each provider has different data collection
systems and processes in place. As a result, we have been unable to report on fault frequency and
repair times by provider.
However, we have used new information gathering powers 13 to require providers to start collecting
new data on faults, the provision of new services, and missed appointments from 2019 onwards. 14
This should enable us to report on the extent to which providers are meeting commitments made to
customers in future publications.
While our focus is on services for residential consumers, we have also looked at the service care
levels offered with standard business contracts; these are the contracts more typically used by small
and medium-sized businesses.
10
Ofcom, 2016, Comparing Service Quality Report.
11 For further information on our use of providers’ data, see Annex 1. For further information on the market research
included in this report, see Annex 2. For further information on how we use our complaints data see: Ofcom, Telecoms and
pay-TV complaints report: Q4 (October to December) 2017.
12 The Net Promoter ScoreTM measures the willingness of customers to recommend a company’s products or services to
others, on scale of -100 to 100, see Annex 2.
13 Under Section 137A, Communications Act 2003. These powers allow Ofcom to specify, in a proportionate way, data that
providers should record.
14 Providers need to make systems and process changes to be able to gather this new data. Providers signed up to the
automatic compensation scheme (BT, Virgin Media, TalkTalk, Sky) will start collecting this new data in March 2019, and we
will look to publish it late 2019/early 2020.
14In addition, we have developed a new webpage where consumers can find out more about service
quality issues to help them choose the right provider. 15
Other work to improve service quality
This report is part of Ofcom’s wider strategy to drive service improvements in the telecoms
industry. 16 Other key work includes the following:
• Introducing automatic compensation when things go wrong: Following an Ofcom review,
BT, Sky, TalkTalk, Virgin Media and Zen Internet have agreed to introduce automatic
compensation when things go wrong. 17 Specifically, from March 2019, they will give their
broadband and landline customers money back when they experience delayed repairs
following loss of service, delayed installations and missed appointments. This should also
incentivise improved service quality.
• Improving Openreach’s performance: In March 2018, we announced measures that will
improve the reliability of the Openreach network, including tougher requirements to ensure
more services are installed promptly and repairs completed when consumers expect them. 18
These came into effect on 1 April 2018.
• Strengthening broadband speeds information available to consumers and businesses:
From 1 March 2019, signatories to the Residential and Business Broadband Speeds Codes of
Practice will be required to provide potential customers with better information on the
broadband speeds they are likely to receive, before they commit to a new contract. 19 The
new codes also strengthen the right to exit that signatories have to offer customers if their
speed falls below a minimum guaranteed level.
• Supporting further rollout of networks: We have published a package of measures to
encourage the deployment of competing full-fibre networks which will ultimately benefit
consumers as more UK homes will have access to ultrafast broadband, and more reliable
networks which came into effect on 1 April 2018. 20 In addition, the broadband USO will help
improve speeds for those who currently get less than 10 Mbit/s. 21
• Improving complaints handling: We continue to monitor providers’ compliance with
Ofcom’s complaint handling rules through an open enforcement programme. 22 New rules
will come into effect on 1 October 2018 to ensure that providers deal with complaints from
consumers promptly and effectively.
15 Ofcom, Choosing a provider.
16 The strategy was first set out in Ofcom’s Digital Communications Review, which concluded that a step change in service
quality was needed.
17 The providers are BT, Sky, TalkTalk, Virgin Media and Zen Internet. Further details can be found here.
18 Ofcom, 2018, Quality of Service for WLR, MPF and GEA Statement.
19 Ofcom, 2018, Better Broadband Speeds Information – Voluntary Codes of Practice Statement.
20
Ofcom, 2018, Wholesale Local Access Market Review Statement.
21 The Electronic Communications (Universal Service) (Broadband) Order 2018.
22 Ofcom, 2018, Monitoring and Enforcement Programme on complaints handling.
15Legal framework for this report
Under Section 3 of the Communications Act 2003 (“the Act”) our principal duty, in carrying out our
functions, is to further the interests of (a) citizens in relation to communications matters; and (b)
consumers in relevant markets, where appropriate by promoting competition.
In preparing and publishing this report, we have carried out a number of our statutory functions:
• Under Section 14 of the Act we have a duty to carry out consumer research on certain
topics. Under Section 15 we have a duty to publish the results of such research; and to
consider and take account (to the extent we think fit) of the results of such research in
carrying out our functions.
• Under Section 26 of the Act we must arrange for the publication of such information and
advice about matters in relation to which we have functions, including to the customers of
communications providers.
• Under Section 134D of the Act we may carry out and publish comparative overviews of the
quality of public electronic communications services, in the interest of the end-users of such
services. 23 Under Section 136(1) of the Act we may require communications providers to
provide us with such information as we consider necessary for the purpose of carrying out a
comparative overview under Section 134D. We used this power to obtain some of the data
set out in this report.
23 As well as the prices of such services.
16Residential landline and
fixed broadband services
Overview
This section explores the service quality experienced by consumers using landline and fixed
broadband services in 2017, 24 including:
• Overall satisfaction - how satisfied consumers were with their service, and whether they
would recommend their provider to a friend.
• Getting a new service - how long it took for new landline and fixed broadband orders to be
delivered.
• Landline and broadband faults – how providers can make a difference to the time taken to
fix faults.
• Missed appointments – the extent to which providers and customers have missed
appointments for installations and repairs.
• Customer service – consumers’ experience of contacting providers.
• Reasons to complain and complaints volumes – whether consumers had a reason to
complain and how many consumers complained to Ofcom.
• Satisfaction with complaints handling - how effectively providers dealt with and resolved
complaints.
• Complaints taken to an alternative dispute resolution scheme – whether complaints
against providers were upheld by an alternative dispute resolution scheme.
24 The fieldwork for the Customer Satisfaction Survey was conducted from 3rd January to 15th February 2018.
17While the focus of this section is on services marketed to residential customers, this information will
be relevant to the many small businesses that also use these or equivalent services.
Overall satisfaction
Customer satisfaction with fixed broadband services has fallen since 2016
Since 2016, there has been a decline in broadband customers’ overall satisfaction with their fixed
broadband service, down to 80% from 87% in 2016. Where customers said they were dissatisfied, 25
the top two reasons were poor or unreliable broadband connectivity (48%) and slow speeds (47%).
Speed and reliability are key factors for broadband customers
There has been a decline in customer satisfaction with the reliability 26 and speed of broadband
services compared to 2016. 27,28 However, a significantly higher proportion of superfast and ultrafast
broadband customers (82% and 86%, respectively) were satisfied with the speed of their service
compared to standard broadband customers (71%). 29
Figure 1: Satisfaction with fixed broadband provider
Source: Ofcom Customer Satisfaction Tracker survey 2018
Base: All adults aged 16+ who are the decision maker and express an opinion on their fixed broadband internet
service. Base sizes are variable. See data tables for more information.
Providers used by fewer than 100 respondents are not shown individually but are included in the total; unless
otherwise stated. ‘Don’t know’ responses have been excluded from the base. Red or green shading and *
indicates significantly lower/higher than the sector average at the 95% confidence level. Arrows represent a
significant increase or decrease compared to 2016
25 11% of customers said they were not satisfied with their broadband service overall.
26 Down to 80% from 86% in 2016.
27 Down to 77% from 83% in 2016.
28 Data tables can be found here and a slide pack of key results can be found here.
29 In this research, we defined broadband speeds as follows: standard - a download speed of up to 30Mbit/s; superfast - a
download speed of between 30Mbit/s and 100Mbit/s; and ultrafast - a download speed of 100Mbit/s or higher. Since
conducting this research, Ofcom’s definition of ultrafast has changed to a download speed of 300Mbit/s or higher.
18Fast broadband has become essential for day-to-day activities such as business, entertainment and
socialising, and the amount of data residential broadband customers used per line last year grew by
44%. 30 Average download speeds have also been rising sharply in recent years. The main reason for
this has been the growth in take-up of superfast broadband packages.
However, although superfast broadband is now available to 93% of premises, 31 around two in five
still use standard broadband. 32 This is reflected in the slow speeds that some households receive.
Most homes on standard broadband packages could receive faster speeds if they upgraded to faster
broadband packages.
Ofcom will shortly be publishing the UK Home Broadband Performance report 2018, with data on
the performance of UK fixed-line home broadband services.
Virgin Media ranked higher than average for satisfaction with broadband speed
Although satisfaction with service, reliability and speed have declined overall, there were however
differences by provider. Virgin Media ranked higher than average for satisfaction with speed of
service, while TalkTalk ranked lower than average for overall satisfaction, as well as for satisfaction
with reliability of service.
Virgin Media’s customers were more likely to
recommend their provider
We asked broadband customers how likely they would
be to recommend their broadband provider to a
friend. 33
Virgin Media customers were more likely than
average 34 to say they would recommend their provider
to a friend, while TalkTalk customers were less likely to
say they would do so.
30
See Ofcom, 2017, Connected Nations Report, p.15
31
Ofcom, Connected Nations Update: Spring 2018
32
See Ofcom, 2017, Connected Nations Report.
33
Net Promoter ScoreTM (NPSTM), see Annex 2 for further details on how this metric is calculated. Full results can be found
in the data tables here and slide pack here.
34
Based on the global NPSTM standards, any score above 0 is considered “good”, 50 and above is considered excellent, see
Annex 2 for further details. The average ‘recommend to a friend’ score in the broadband market was good (6). Virgin
Media’s score was 15, while TalkTalk’s was -13.
19Overall satisfaction in the broadband market was below satisfaction in other sectors
The level of overall satisfaction among broadband customers was below that among mobile and
landline customers, as well as among current account, gas and electricity customers.
Figure 2: Customers’ overall satisfaction with communications providers compared to current
account and energy providers
Source: Ofcom Customer Satisfaction Tracker survey 2018
L1/M2/IN2/PT1/B1/BM3/BM9/BM10: In terms of your (SERVICE) how satisfied are you with the overall service
provided by (PROVIDER)? Would you say you are…
Base: All adults aged 16+ who are the decision maker and express an opinion on their landline service(2252),
their mobile phone service (2861), their fixed broadband service (2263), their pay TV service (1487), their
services taken with the same supplier (2182), their main current account provider (2867), their gas provider
(2212), their electricity provider (2536). ‘Don’t know’ responses have been excluded from the base
Customer satisfaction in the landline market remained high 35
Nearly nine in ten landline customers reported that they were satisfied with their overall service,
which was in line with 2016. The level of customer satisfaction with the reliability of service was also
high and comparable with that for 2016.
Where customers were dissatisfied, 36 the top two reasons were poor or unreliable service (37%),
and the expense of the service (27%).
Overall satisfaction among TalkTalk’s customers was below average. 37
35 Data tables can be found here and a slide pack of key results can be found here.
36
4% of customers said they were not satisfied with their overall landline service.
37
Satisfaction with overall service is not registered as significant for Plusnet due to lower base size of Plusnet respondents.
20Figure 3: Satisfaction with landline provider 38
Average Virgin
BT EE Plusnet Sky TalkTalk
landline Media
Satisfaction with
87% 88% 90% 81% 90% 82% * 84%
overall service
Satisfaction with
90% 91% 92% 87% 90% 87% 91%
reliability of service
Source: Ofcom Customer Satisfaction Tracker survey 2018
Base: All adults aged 16+ who are the decision maker and express an opinion on their landline service (2252).
Base sizes are variable. See data tables for more information. Providers used by fewer than 100 respondents
are not shown individually but are included in the total; unless otherwise stated. ‘Don’t know’ responses have
been excluded from the base.
Red or green shading and * indicates significantly lower/higher than the sector average at the 95% confidence
level.
Landline providers all received a recommend
a friend score in line with the average
For landline, the extent to which customers said
they would be likely to recommend their provider
did not vary by provider, when compared to the
average. 39
Getting a new service
Most landline and broadband orders were delivered on the date agreed
A consumer’s first experience of a provider’s service quality is when they place their first order. It is
important that all new orders are provided quickly, on the date agreed, and that any delays are
managed effectively.
The majority (94%) of landline and broadband orders were delivered by the date agreed with the
customer, including any rearrangements agreed in advance 40 in 2017. 41 Some providers were
38 Comparison with satisfaction measures for 2016 is not possible for EE and Plusnet, as the sample size for these providers
was not large enough in previous research.
39
Based on the global NPSTM standards, any score above 0 is considered “good”, 50 and above is considered excellent. The
average ‘recommend to a friend’ score in the landline market was good (11). See Annex 2 for further details.
40 For providers who could record date changes, around 2% of total orders were rearranged by the provider.
41 Ofcom analysis of data from BT, EE, Virgin Media, Sky and TalkTalk and measured from the last service commitment date
provided to the customer and includes home moves and regrades. It has not been possible to publish provider-specific
figures here. See Annex 1 for further details.
21unable to report on their success at completing a new order on the date first promised to the
customer because they overwrite the original date if any changes are made. We expect to be able to
report on this when we start receiving new data in 2019, under new information gathering powers.
Where a customer was moving home but staying with the same provider, nine in ten (90%) orders
were delivered by the date agreed. 42 This lower success rate may in part reflect dates for home
moves changing at short notice. 43
On average, it took 13 days for a landline or broadband order to be delivered
Across the main providers, it took an average of 13 calendar days to deliver a landline or broadband
order in 2017; 44 this was a slight improvement compared to 2016.45 On average orders in rural areas
took an additional 1 day to be completed . 46
There are several reasons why orders can take 13 days or longer to be delivered. Ofcom rules
require that switches between providers within the Openreach or KCOM networks take a minimum
of ten working days, 47 and orders can take longer to complete if a customer wants the service to be
delivered at a later date (e.g. when the customer is moving into a new home).
The time taken to deliver an order can depend on the type of order and network
In addition, the time taken to deliver a service can depend on the type of order placed by the
customer. On the Openreach network, a product change for an existing customer (such as moving to
a package with a faster broadband speed), took 14 days on average, compared to 16 days for
providing a new customer with a service, and 17 days for a home move. A product change on the
Openreach network takes almost as long as other types of order because upgrading to superfast
broadband on the Openreach network often requires a physical change in the equipment used to
deliver the new service. As customers move onto Fibre-to-the-Premises networks, the average time
taken to deliver a product upgrade on the Openreach is likely to decline.
42 Ofcom analysis of data from BT, EE, Virgin Media, Sky and TalkTalk and measured from the last service commitment date
provided to the customer.
43 For next year’s report, we intend to review with providers the main drivers for this lower success rate.
44 Ofcom analysis of data from BT, EE, Virgin Media, Sky and TalkTalk and measured from the order date to the last service
commitment date provided to the customer and includes home moves and regrades.
45 In 2016, it took 14.5 days to deliver a new landline or broadband order.
46
Ofcom analysis of data from BT, EE, Virgin Media, Sky and TalkTalk and measured from the order date to the last service
commitment date provided to the customer and includes home moves and regrades. Urban and rural postcodes identified
using the Locale classification – see Annex 1 for further details.
47 This is so that a consumer can stop the switch if they have not agreed to it or have changed their mind.
22Figure 4: Time to provide a landline or broadband service on the Openreach network48
Percentage of all Average time to provide
Order type
providers’ orders (calendar days) 49
New Customer Service – where a new
service is ordered, by a new customer,
67% 16
either a new line or a new customer who is
switching from another provider 50
Home Move – where the customer is
moving home and wishes to take over an
8% 17
active line at their new premises while
remaining with their current provider 51
Product Change – where a customer
wishes to stay with their provider but
25% 14
change their current service, for example
by upgrading to a faster broadband speed
Source: Ofcom analysis of BT, Sky, EE, TalkTalk, Plusnet, and Post Office data
On the Virgin Media network, a self-install by the customer typically took 6 days and an engineer-
install of a new line took 19 days. 52 A product change on Virgin Media’s network took 2 days,
(however, this figure is not directly comparable to the figure for Openreach product changes). 53
Some customers upgrading may need to wait for a new router from their provider to arrive; but
where this is not the case, Virgin Media can activate the regrade on the same day.
48 Providers included in this analysis are BT, EE, Sky, Virgin Media and TalkTalk. More information on how Ofcom derived
this and other information from provider data can be found at Annex 1. For 2017, Ofcom reduced the number of “order
types” by including restarts and transfers in the “new line” category.
49 Rounded up to the nearest full day.
50 As set out at Annex 1, this order type combines the “new line”, “restart” and “transfer” categories used in 2016.
51 This does not include home moves where a new customer has switched from another provider.
52 Or to repair a line that already existed.
53 Virgin Media’s data includes regrades provided proactively by Virgin Media, that were not initiated by the customer.
23Figure 5: Time to provide a landline or broadband service on the Virgin Media network54
Average time to
Order type Percentage of all provide (calendar
providers’ orders days) 55
‘Quickstart’ self-install – where the home has an
existing Virgin Media line and the customer can 18% 6
complete the installation themselves
Engineer install - where an engineer is required to
install a new Virgin Media line into the home or 32% 19
repair an existing Virgin Media connection
Product change – where a customer wishes to
stay with their provider but change their current
50% 2
service, for example by upgrading to a faster
broadband speed
Source: Ofcom analysis of Virgin Media data. The ten-day -working minimum switching rules does not apply to
Virgin Media orders. Note: Virgin’s product change data includes regrades not requested by the customer and
is not directly comparable to Openreach providers’ data.
As set out in the tables above, the time taken to deliver an order can depend on the network used.
The vast majority of orders were delivered within four weeks
There were limited differences in the time taken to complete landline and broadband orders by
provider on the Openreach network. Although EE completed fewer orders compared to the other
providers at two weeks, overall there was little difference in the average number of days it took all
providers to deliver a new order. In addition, each provider completed the vast majority of orders
within four weeks.
Figure 6: Percentage of landline and broadband services provided within four weeks of the order
date, and average number of days taken to provide (providers on Openreach network) 56
Three Four Average
Provider One week Two weeks
weeks weeks Days 57
BT 15% 53% 84% 93% 16
EE 11% 38% 89% 96% 16
Sky 17% 55% 88% 95% 15
TalkTalk 11% 54% 90% 96% 15
Source: Ofcom analysis of provider data
54
We have not reported separately on the time taken to complete Virgin Media home moves in 2016 or 2017 but will
explore this for future publications.
55 Rounded up to the nearest full day.
56 Ofcom analysis of provider data. The time taken to provide a new service is calculated by taking the difference between
the order date and service activation date. More detail on our methodology is available in Annex 1. Plusnet and the Post
Office were unable to provide data in line with our requirements and have been excluded from this analysis.
57 Rounded up to the nearest full day.
24Virgin Media, to whom the ten-working day switching rule does not apply, completed almost seven
in ten orders in one week and more than eight in ten orders in two weeks. The main driver of Virgin
Media’s high completion of orders in one and two weeks is the relative ease with which it can deliver
product upgrades.
Figure 7: Percentage of landline and broadband services provided within four weeks of the order
date (Virgin Media) 58
Average
Provider One week Two weeks Three weeks Four weeks
days 59
Virgin Media 68% 84% 90% 94% 8
Source: Ofcom analysis of provider data. Note: This data includes regrades not requested by the customer
and is not directly comparable to other providers’ data.
In 2017, KCOM 60 completed a much lower proportion of its orders in one, two, three and four weeks
than it did in 2016. For example, in 2016 it completed four-fifths of orders in two weeks, whereas in
2017 it completed only three-fifths of orders in two weeks. KCOM reported that this was in part due
to limitations in its IT systems, as well as its Fibre-to-the-Premise (FTTP) rollout programme. 61
Figure 8: Percentage of landline and broadband services in Hull and East Yorkshire provided within
four weeks of the order date (KCOM) 62
Average
Provider One week Two weeks Three weeks Four weeks days 63
KCOM 6% 60% 74% 79% 20
Source: Ofcom analysis of provider data
But a small minority of orders took more than four weeks to be delivered
Very long installation times may cause frustration and inconvenience for consumers, even if their
expectations have been managed by their provider. In 2017, fewer than six per cent of orders
(around 400,000 orders in total) took more than four weeks to be delivered, and around one percent
took more than eight weeks. 64
Sometimes long installation times are due to factors outside providers’ control; for example, where
permission to conduct street works is required, or ‘wayleaves’ need to be agreed to install or run
58 Ofcom analysis of provider data.
59 Rounded up to the nearest full day.
60 KCOM is the universal service provider in Hull.
61 Due to the time taken to deliver FTTP, where a customer ordered an FTTP service and did not already have broadband,
KCOM would provide a standard ADSL service in the interim, to ensure that customers had access to a broadband service.
62 Ofcom analysis of provider data.
63 Rounded up to the nearest full day.
64 Ofcom analysis of provider data for BT, EE, Sky, TalkTalk and Virgin Media.
25equipment on private land. Next year, we intend to look more closely at the reasons why services
took longer than four weeks to be delivered.
Four per cent of orders on Openreach’s network were reported as not working 65
Around four per cent 66 of new orders for landline and/or broadband services on the Openreach
network were reported by the customer as not working on the date of delivery. Such orders require
an engineer visit or a new customer router to be sent out to resolve the issue. This is likely to be a
source of frustration for consumers, and is an area that we will consider further for next year’s
report.
Landline and broadband faults
Having access to a reliable service is essential for landline and broadband customers to be able to
get the most from their service. Where service faults occur, it is vital that these are diagnosed and
resolved quickly.
Faults can occur in the home
Sometimes customers lose their service or experience poor service quality, (such as a slow or patchy
connection), because of a problem originating in their own home. Common in-home issues include
incorrect set-up of the home network, faulty wiring in the home, use of old or faulty equipment, wifi
interference and user error. 67
For these types of problem, effective customer service may be able to help resolve the problem
quickly, and we discuss customer service and complaints handling further below. Providers may also
be able to reduce the frequency of some of these problems by supplying customers with effective
information when they provide a new service, for example on the correct set-up and location of the
wifi router.
Ofcom’s mobile and broadband checker app offers tips on how consumers can improve their
internet connection. 68 We have also published a new consumer guide with practical tips on how to
improve broadband speeds along with a new video guide. 69
65 Data from Virgin Media and KCOM did not allow us to accurately identify and reflect the services delivered not working
that would allow for meaningful comparisons.
66 Ofcom analysis of data provided by Openreach, of services reported as not working within 8 days of services being
delivered using the Reseller Identification Codes identified by each provider for their residential services – see Annex 1.
67 Based on information supplied to Ofcom by providers.
68 Ofcom, Mobile and broadband checker app.
69 Ofcom, Practical tips for improving your broadband speed, which includes new video guide.
26Providers can make a difference to the time taken to fix faults
When problems originate outside of the home, on the customer’s line or wider network, an engineer
will usually be needed to address the fault.
The time taken to restore service will depend on how long it takes to diagnose the nature of the
fault, the speed at which an engineer is dispatched by the provider or their supplier, if one is
required, and the nature of the problem.
We have not been able to publish any provider data on the frequency or time taken to repair faults,
which we believe would be useful information for consumers, 70 however, providers will start
recording new, comparable faults data in 2019. 71
BT and Post Office (broadband) pay for quicker repairs than other providers using
Openreach
All the largest broadband and landline providers in the UK, apart from Virgin Media and KCOM, rely
on Openreach engineers to investigate and fix faults with their customers’ connections. We estimate
that these faults occur approximately every 8 to 9 years for lines carrying standard broadband
services, once every 12 years for landline-only services, and once every 7 years for line carrying
superfast broadband services. 72
When a provider notifies Openreach of a fault on
Openreach’s network, Openreach must repair it within an
agreed time, depending on which service maintenance
level (SML) has been purchased, or pay the provider
compensation. 73 The service levels range from resolution
within two working days (level 1) to within six hours
(level 4). Retail providers have a choice of which service
level to take; one working day is the basic service level
for fibre-to-the-cabinet (FTTC) products. In 2017, there
was no change in the Openreach repair level that
One working day is the basic service level for
fibre-to-the-cabinet products
70 This follows a pilot exercise where we found that the data we could obtain from providers on total loss of service would
not be sufficiently comparable to include in this report.
71 The new data collection coincides with the implementation of the voluntary automatic compensation scheme - under
which a landline or broadband customers would be entitled to compensation if their service has stopped working and is
not fully fixed after two working days.
72 Ofcom, 2018, Quality of Service for WLR, MPF and GEA Statement, para 4.15.
73 Except for circumstances beyond the reasonable control of Openreach, such as when civil engineering works are
required to repair a fault, or where the customer requests a repair appointment beyond the specified timetable (for
example because they cannot be available at the time offered).
27providers used for most of their residential customers. BT and Post Office (broadband) continued to
pay for quicker repairs than other providers using Openreach.
Openreach’s performance for fixing faults within the agreed time improved slightly in 2017.
Figure 9: Comparison of level 1 and 2 faults fixed within agreed timescales, 2016 and 2017
2016 2017
Level 1 faults fixed within two
83% 84%
working days
Level 2 faults fixed within one
78% 79%
working day
Source: Openreach 74
Ofcom has recently raised the quality of service standards applied to Openreach. 75 Amongst other
things, we have introduced a new standard to ensure that the vast majority of repairs are completed
within a reasonable timeframe. By 2020/21, Openreach should complete 88% of landline and
broadband fault repairs within one to two working days of being notified, compared with 80% in
2017. It will also need to complete 97% of repairs no later than five working days after the date
promised. In addition, these standards will now also cover broadband delivered over Openreach’s
fibre-to-the street cabinet (FTTC) that are used to provide superfast broadband services.
Missed appointments
When engineers miss an agreed appointment slot, customers may suffer from delays in having their
service installed or repaired, as well as from the time they spend waiting in and having to reschedule
the appointment.
Different providers use different definitions for missed appointments, making it difficult to draw
comparisons across providers. 76 For this reason, we are not currently able to report on the volume
of appointments missed by these engineers by provider. We expect to be able to report on this
when we start receiving new data in 2019, under new information gathering powers.
74 Openreach, Regulated KPIs.
75 Ofcom, 2018, Quality of Service for WLR, MPF and GEA Statement.
76 See Annex 1 for further details.
28Openreach has continued to reduce the proportion of appointments that are missed
In 2017, Openreach reduced the proportion of repairs and installation appointments that it missed77
compared to 2016. 78 There is now little difference in the missed appointments rates for these two
types of appointment.
Figure 10: Proportion of appointments missed by Openreach, by appointment type, 2017
Type of appointment 2016 2017
Installation 3.6% 1.9%
Repairs 79 2.8% 1.8%
Source: Ofcom analysis of provider data
The proportion of appointments missed by Virgin Media remained low
In 2017, Virgin Media missed 0.3% of all engineer appointments. 80 Figure 11 shows that, as with
Openreach, the proportion of appointments missed fell for installations. However, the proportion of
appointments that were missed for repairs increased slightly in 2017.
Figure 11: Proportion of appointments missed by Virgin Media, by appointment type
Type of appointment 2016 2017
Installation 0.6% 0.4%
Repairs 0.2% 0.3%
Source: Ofcom analysis of provider data
Customers also miss appointments, causing delays to repairs and installations
There are also instances when appointments are missed by the customer, such as when the
customer is not ready when the engineer turns up at the appointment time. For 2017, the
proportion of Openreach appointments missed by the customer was 4.5%. 81 For Virgin Media, this
proportion was 2.7%. Customers therefore missed a higher proportion of appointments than
Openreach and Virgin Media engineers.
77 Openreach defines an appointment as missed if the engineer does not arrive during the originally agreed slot or arrives
before the agreed slot without the prior agreement of the customer.
78 This is based on data from the following providers: BT, EE, Plusnet, TalkTalk, Sky, and Post Office. See Annex 1 for further
details.
79 These figures exclude Post Office, as they were not able to provide data on the proportion of missed appointments for
which the fault was not the customer.
80 For the purposes of this report, Virgin Media only class an appointment as missed if it does not take place on the
scheduled day.
81 This excludes appointments booked with other-third party engineers or the provider’s own workforce.
29Customer service
Phone remains the most popular way for customers to contact their provider
In most instances, customers continue to contact their provider by telephone. In addition, with the
exception of EE and Post Office, the main providers can be contacted via webchat and social media
for queries relating to fixed landline and broadband services. Contact via social media is mostly
limited to Facebook and Twitter, although some providers respond to queries on other social media
platforms.
Sky and TalkTalk can also be contacted via message services that do not require the customer to stay
connected to the advisor or to respond in real time. 82 For example, with Sky this involves a customer
messaging an advisor via SMS or Facebook Messenger.
Some providers also have apps to support landline and broadband customers
BT, Sky, TalkTalk and Virgin Media each have apps that can be used by landline and broadband
customers. The capability of these apps varies across providers, but generally customers can carry
out activities such as checking and paying their bill and checking their data usage. In some cases,
customers can test their broadband speed, run broadband diagnostics, and report and track faults.
EE’s, Post Office’s and TalkTalk’s customers waited less than one minute on average to
speak to their provider on the phone
The average call waiting times were generally higher for landline and broadband customers than for
mobile customers. 83, 84
There were however variations by provider. Landline and broadband customers calling EE, Post
Office or TalkTalk had less than a minute on average to wait to speak to their provider on the phone.
Plusnet, however, was the slowest provider to answer the phone, with an average call waiting time
of just less than eight minutes.
BT was the only provider that offered customers waiting in the call queue the option of receiving a
call-back.
82 This is also referred to as asynchronous messaging.
83 The average call wait time for mobile customers was just under one minute compared to 1min 40s for landline and
broadband customers.
84
The data we requested here differed in 2017, and therefore may not be comparable with 2016.
30Figure 12: Average call waiting times, landline and broadband providers
7min 50s
2min 3s 2min 2s
1min 29s 1min 27s
Average: 1min 40s
53s 52s 48s
Plusnet Sky KCOM Virgin BT Post TalkTalk EE
Media Office
Source: provider data, 2017. Note: the BT data includes call-backs.
Plusnet also had the highest proportion of phone calls that ended while the customer was in the
queue waiting to speak to an advisor.
Figure 13: Calls ended while the customer was queuing to speak to an advisor, landline and
broadband providers
24%
8% Average: 7%
7% 7% 5% 4%
6%
Plusnet KCOM Sky TalkTalk Virgin BT EE
Media
Source: provider data, 2017. Post Office has been excluded from this data set, as they were unable to include
instances where the call was ended without the customer hanging up (e.g. due to technical problems),
meaning that their data was not comparable with the other providers’.
31Reasons to complain and complaints volumes
The proportion of broadband consumers with a reason to complain has increased since
2016
Around one in seven broadband consumers reported that they had a reason to complain 85 about
their provider in the last 12 months, 86 an increase since 2016. 87 TalkTalk consumers were more
likely than average to have had a reason to complain in the past year.
Figure 14: Proportion of broadband customers who had a reason to complain in the past 12
months, (whether or not they went on to make a complaint), by provider
Average Virgin
BT EE Plusnet Sky TalkTalk
Broadband Media
Proportion of
consumers with a 15% 14% 14% 13% 14% 18%* 16%
reason to complain
Source: Ofcom Quality of customer service research, face-to-face omnibus survey, fieldwork carried out by
Kantar Media, January 2018.
Base: All UK households 16+; average broadband (5171), BT (5391), EE (214), Plusnet (175), Sky (1189),
TalkTalk (659) and Virgin Media (1242)
Q. Have you personally had a reason to complain about any of these services or suppliers in the last 12 months,
whether or not you went on to make a complaint?
Red or green shading and * indicates significantly lower/higher than the sector average at the 95% confidence
level. Arrows represent a significant increase or decrease compared to 2016. 88
The most common reason to complain was the broadband service not performing as it
should
Of those with a reason to complain, the main cause was a service issue, such as slow broadband
speeds, complete or intermittent loss of service or service not as advertised. 89 The next most
common causes were a billing or pricing issue, and a problem with a repair to the service.
85 This is regardless of whether or not they went on to make a complaint.
86 Fieldwork was conducted in January 2018, therefore reasons to complain date back to January 2017.
87 The proportion of broadband customers with a reason to complain has increased from 13% to 15%.
88 Ofcom, 2018, Reasons to complain study; Ofcom, 2016, Reasons to Complain data tables.
89 This has increased to 81%, up from 73% in 2016.
32Figure 15: Reasons to complain about broadband provider
The service not performing as it should 81%
A billing, pricing or payment issue 9%
A problem with a repair to the service 9%
A problem relating to the installation or set up
6%
of your service
Dissatisfaction with customer service from a
5%
previous occasion or contact
Source: Ofcom Quality of customer service research, face-to-face omnibus survey, fieldwork carried out by
Kantar Media, January 2018.
Base: All UK households 16+ who had a reason to complain about broadband (764)
Q. What was the issue\s you had reason to complain about in connection with your fixed broadband internet?
Arrows represent a significant increase or decrease compared to 2016
The proportion of landline consumers with a reason to complain has fallen since 2016
Only four percent of landline consumers had a reason to complain in 2017, which represents a fall
since 2016 (5%). Sky consumers were less likely than average to have had a reason to complain. 90
Figure 16: Proportion of landline customers who had a reason to complain in the past 12 months 91
Average Post Virgin
BT EE Plusnet Sky TalkTalk
landline Office Media
Proportion of
consumers with a 4% 4% 3% 4% 7% 2%* 5% 4%
reason to complain
Source: Ofcom Quality of customer service research, face-to-face omnibus survey, fieldwork carried out by
Kantar Media, January 2018.
Base: All UK households 16+; average landline (5227), BT (2042), EE (181), Plusnet (132), Post Office (85), Sky
(964), TalkTalk (607) and Virgin Media (1021)
Q. Have you personally had a reason to complain about any of these services or suppliers in the last 12 months,
whether or not you went on to make a complaint?
90 All other apparent differences are not statistically significant.
91 Whether or not they went on to make a complaint.
33You can also read