SERVICE STANDARDS - BOARD ADOPTED: OCTOBER 25, 2018 BOARD AMENDED: OCTOBER 24, 2019 - INDYGO
←
→
Page content transcription
If your browser does not render page correctly, please read the page content below
Service Standards

        Board Adopted: October 25, 2018

        Board Amended: October 24, 2019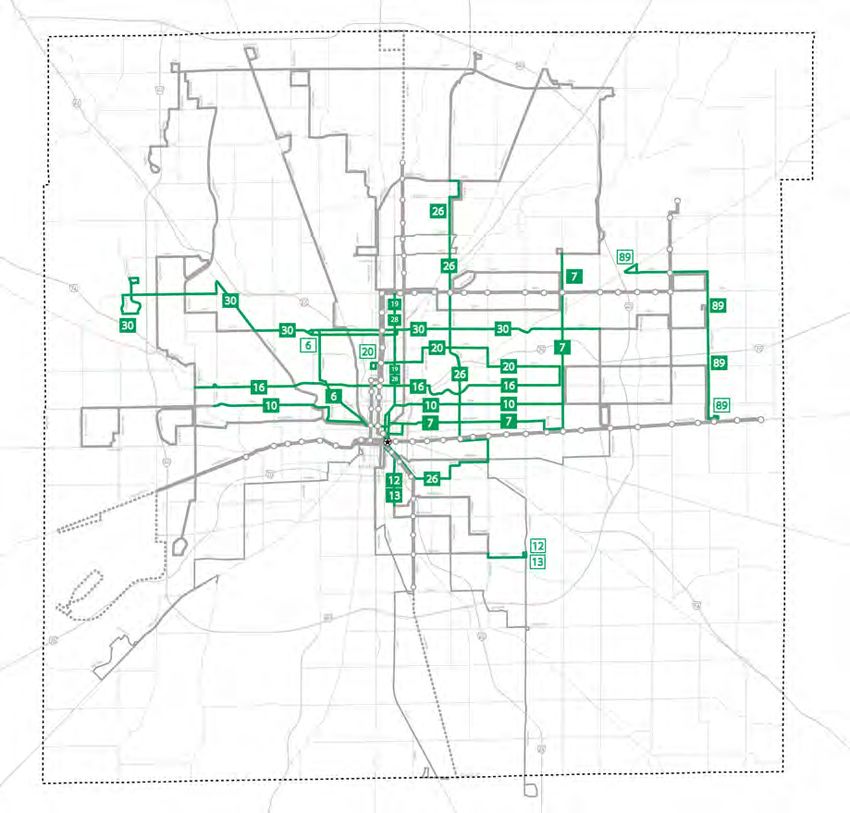
Contents
Definitions .................................................................................................................................................... 1
Purpose......................................................................................................................................................... 3
Principles Governing these Standards ........................................................................................................ 3
   Network Design Principles ....................................................................................................................... 3
Service Categories ........................................................................................................................................ 4
   Rapid ......................................................................................................................................................... 4
   Frequent ................................................................................................................................................... 5
   Basic.......................................................................................................................................................... 5
   Coverage ................................................................................................................................................... 5
   Paratransit ................................................................................................................................................ 5
Elements for Service Categories .................................................................................................................. 6
   Defining Features ..................................................................................................................................... 6
   Service Quality Targets ............................................................................................................................ 9
   Outputs ................................................................................................................................................... 14
Using and Updating these Standards........................................................................................................ 15
   Monitoring the Standards ...................................................................................................................... 15
   Productivity Review ............................................................................................................................... 17
   Responding to Service Requests ........................................................................................................... 19
   Updating the Service Standards ............................................................................................................ 19
APPENDIX A: Additional Considerations.................................................................................................... 20
   Frequency Changes Due to Low Productivity ....................................................................................... 20
APPENDIX B: Responding to Service Requests ......................................................................................... 20
APPENDIX C: Updating Service Purposes .................................................................................................. 22
APPENDIX D: Assessing Compliance with the Ridership/Coverage Split ................................................. 24
APPENDIX E: Modifications to these Standards ........................................................................................ 25

                                                                                                                                                                   i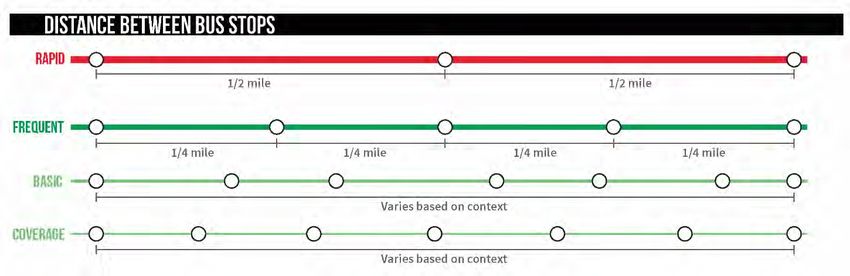
WHAT ARE SERVICE STANDARDS?
Transit agencies set goals for transit services provided, which are called Service Standards. These
standards enable a transit agency and its partners to monitor transit performance. IndyGo’s service
standards are organized within three overarching categories: Defining Features, Service Targets,
and Outputs.

DEFINING FEATURES
Service features necessary for a route to be designated as either Rapid, Frequent, Basic, or Coverage.

 FREQUENCY                        DAILY & WEEKLY SPAN                        STOP SPACING
                                               The hours of the day
            How often a bus                    and days of the week
            arrives at a stop                                                   The average distance
                                               that service operates            between bus stops

SERVICE TARGETS
Desired outcomes for service categories. These four targets often have a significant impact on
whether or not someone chooses to rides transit.

  TRAVEL SPEED                                          RELIABILITY
                 The average travel speed                                 The percentage of
                 of buses along a route or                                on-time bus arrivals
                 route segment

  STOP AMENITIES                                        PASSENGER LOAD
              The type of amenities available                          The maximum load of passengers
              at a bus stop, including shelters,                       on a bus, in proportion to the
              seating, trash cans, etc.                                number of seats

OUTPUTS
Metrics that IndyGo uses to understand how a route is performing.

  PRODUCTIVITY                                           COVERAGE
             The number of boardings per                               Service that is provided without
             hour of revenue service; a                                the expectation of a high level of
             measure of cost-efficiency                                ridership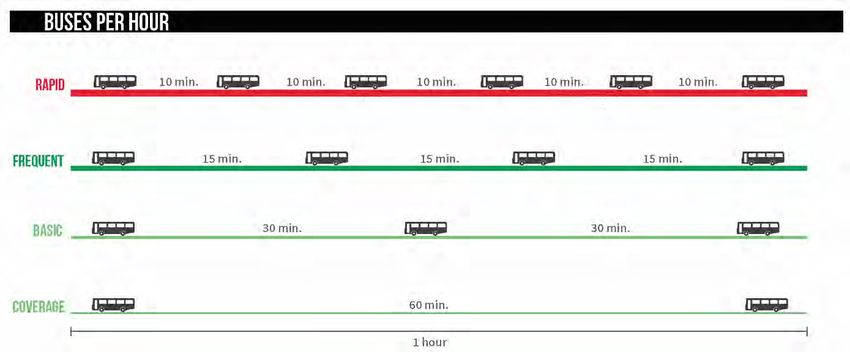
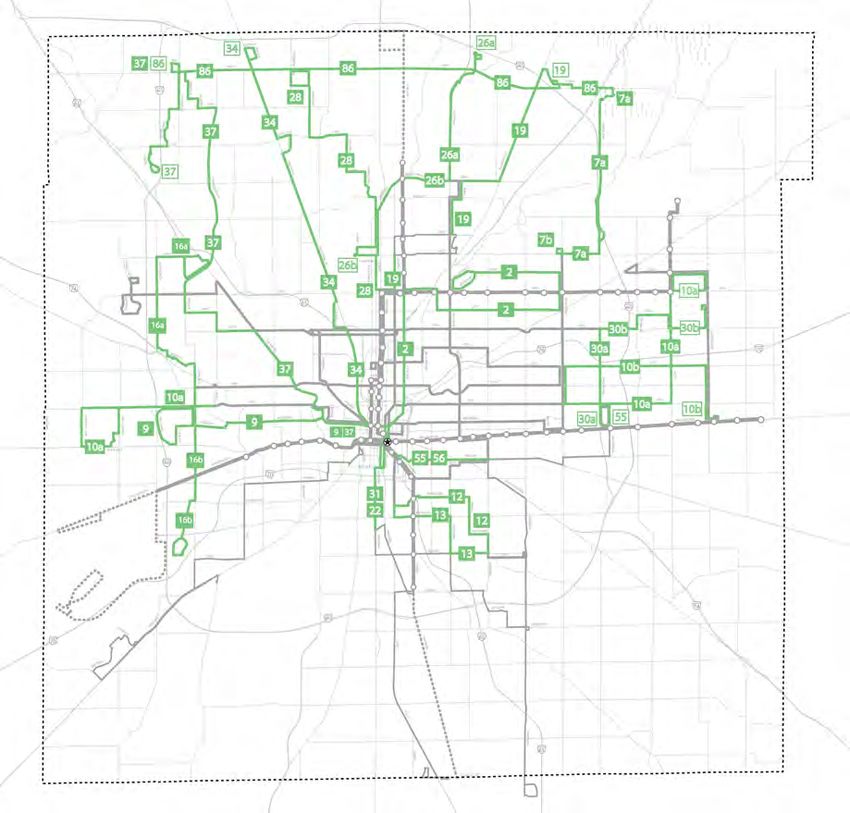
SERVICE CATEGORY: Rapid
 IndyGo’s bus service consists of four service categories: Rapid, Frequent, Basic, and Coverage. Service
 standards for Rapid service (including the Red Line, Purple Line, and Blue Line) and a map of Rapid
 service are shown below:

        DEFINING FEATURES                  SERVICE TARGETS                          OUTPUT

        10
         MINUTES
                        20
                        HOURS DAILY*
                                           25      AVERAGE
                                            MPH BUS SPEED
                                                               MAXIMUM
                                                                   BUS STOP
                                                                   AMENITIES
                                                                                        27+
                                                                                        BOARDINGS
                                                                                        PER SERVICE HOUR
rapid

             BUS STOPS EVERY
                                           90%               150%                      NOT
                                                                                    COVERAGE
                                                             MAXIMUM
              HALF-MILE                    ON-TIME ARRIVAL
                                                             PASSENGER LOAD          SERVICE
                                                                                 * 16 hours of service on Sundays

                                                                                                    Frequency

                                                                                                    Daily & Weekly
                                                                                                    Service span

                                                                                                     Bus stop spacing

                                                                                                     Bus travel speed

                                                                                                     reliability

                                                                                                     Bus stop amenities
                                                                          Red line
                                                                          blue line                  Passenger load
                                                                          purple line
                                                                                                     productivity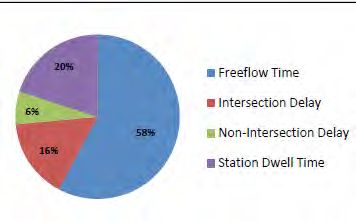
SERVICE CATEGORy: frequent
 Service standards for Frequent service and a map of Frequent route segments are shown below:

           DEFINING FEATURES            SERVICE TARGETS                         OUTPUT

           15           20              17                 MODERATE
                                                               BUS STOP          27
frequent

                                               AVERAGE
                                        MPH BUS SPEED          AMENITIES         BOARDINGS
            MINUTES     HOURS DAILY*                                             PER SERVICE HOUR

                BUS STOPS EVERY
                                        85%               120%                      NOT
                                                                                 COVERAGE
                                                          MAXIMUM
              quarter-MILE              ON-TIME ARRIVAL
                                                          PASSENGER LOAD          SERVICE
                                                                                * 16 hours of service on Sundays

                                                                                                Frequency

                                                                                               Daily & Weekly
                                                                                               Service span

                                                                                                 Bus stop spacing

                                                                                                 Bus travel speed

                                                                                                reliability

                                                                                                Bus stop amenities
                                                                     Frequent
                                                                     service
                                                                                                Passenger load

                                                                                                productivity
SERVICE CATEGORY: Basic
Service standards for Basic service and a map of Basic route segments are shown below:
DEFINING FEATURES SERVICE TARGETS OUTPUT
30
MINUTES
18
HOURS DAILY*
14 AVERAGE
MPH BUS SPEED
MODERATE
BUS STOP
AMENITIES
21
BOARDINGS
PER SERVICE HOUR
basic
BUS STOP DISTANCE
85% 120% NOT
COVERAGE
MAXIMUM
VARIES BASED ON
CONTEXT
ON-TIME ARRIVAL
PASSENGER LOAD SERVICE
* 16 hours of service on Sundays
Frequency
Daily & Weekly
Service span
Bus stop spacing
Bus travel speed
reliability
Bus stop amenities
basic
service
Passenger load
productivitySERVICE CATEGORY: Coverage
Service standards for Coverage service and a map of Coverage route segments are shown below:
DEFINING FEATURES SERVICE TARGETS OUTPUT
60 16 14 LIMITED
coverage
AVERAGE
BUS STOP
MPH BUS SPEED AMENITIES NO STANDARD
MINUTES HOURS DAILY FOR PRODUCTIVITY
BUS STOP DISTANCE
85% 120% COVERAGE
MAXIMUM SERVICE
VARIES BASED ON
CONTEXT
ON-TIME ARRIVAL
PASSENGER LOAD
Frequency
Daily & Weekly
Service span
Bus stop spacing
Bus travel speed
reliability
Bus stop amenities
coverage
service
Passenger load
productivityFrequently asked questions Why can’t a bus stop be located closer to my home or workplace? Bus stops are located strategically along routes. More bus stops located along a route mean the bus has to stop more frequently. This slows the overall bus travel speed and makes bus trips longer for all passengers. IndyGo must balance bus stop access and passenger convenience with the desire to keep the bus in motion. See page 11 for more information. Why can’t my bus route be changed to be closer to my home or workplace? For transit to be useful and efficient for the greatest number of people, bus routes need to be linear, with a straight direction of travel and limited turning movements. IndyGo is not able to make major bus route adjustments based on individual rider requests. Door-to-door local bus service is neither financially efficient nor operationally possible for IndyGo to provide. See page 8 for more information. Why is my bus running late? Traffic delays along a bus route, the number of times a bus needs to stop to pick up passengers, and the length of time a bus spends at each stop are the most common reasons why a bus may be running late. IndyGo has several options available to improve reliability, including traffic signal timing adjustments, dedicated bus lanes in congested areas, addressing bus stop spacing, adding more off-board fare collection options, and more. See pages 14-15 for more information. Why is my bus full or over capacity? High demand for bus service along a route can be a reason for a full bus. IndyGo monitors how full a bus is in order to make informed decisions on whether or not larger capacity buses are needed, or if additional buses need to be added along a route. See page 17 for more information. Why does my bus stop not have a shelter or bench? Shelters and benches require significant capital and operating expense. This means that IndyGo must be selective about where shelters or benches are placed. Stops with higher ridership are more likely to have amenities. Additionally, in many locations there is not enough space for shelters or benches within the public right-of- way (the street space owned by the City). IndyGo is constantly evaluating its existing bus stops in order to identify opportunities to add seating and shelters. See page 16 for more information. Why don’t buses run 24 hours per day, 7 days per week? IndyGo is limited to its available resources, so 24/7 service is not an option at this time. However, IndyGo is increasing the hours of service for many routes on weekdays and weekends. Bus service will also run 7 days per week on all bus routes. If additional funding becomes available, or if ridership increases, individual routes will be evaluated for possible service improvements. See page 26 for more information.
Frequently asked questions
Why does my bus only arrive every hour?
IndyGo weighs a number of factors when determining how frequently a bus travels
on a route. These factors include existing ridership, proximity to jobs, available
resources, adjacent land use and development characteristics, and other factors. See
page 9 for more information.
Why is the bus so slow?
With the exception of IndyGo’s Rapid transit services, buses are often affected by the
same traffic congestion as all other vehicles, plus the added time needed to let riders
on and off. IndyGo and the City of Indianapolis can collaborate to increase bus
speeds by prioritizing buses using dedicated transit lanes or traffic signal controls.
See page 13 for more information.
Why is the bus empty?
IndyGo buses may have fewer passengers on them when they are just starting or
completing a trip, or when they are heading to and from the garage.
Why are there only three rapid transit lines?
As part of the Marion County Transit Plan, resources were identified for three rapid
transit lines. Frequent transit routes also provide high-quality transit service and
serve many areas of Marion County. Frequent routes will be individually evaluated to
better understand if an upgrade to Rapid transit service is warranted. See page 8 for
more information.
How does IndyGo evaluate its own performance?
IndyGo has access to many data points to understand and evaluate how each bus
route is performing. However, the primary way is to calculate the number of riders
per revenue service hour, also known as Productivity. If a route is performing well,
then Productivity will meet the established standard for its service category. If not,
IndyGo staff will review to better understand why it is not meeting the standard. See
page 20 for more information.
Why can’t I ride the bus to Plainfield or other cities and towns outside of Marion
County?
IndyGo only operates bus service in Marion County, with some limited exceptions.
For IndyGo to run in other areas, those areas will need to either contract with IndyGo
for service or identify a funding source to cover the capital and operating expenses
required for new connecting transit service.
marion county transit plan
            network design principles
                        THE ROUTES IDENTIFIED IN THE MCTP
                   WILL BEST SERVE CURRENT AND FUTURE RIDERS
                            BY OPERATING IN AREAS OF:

DENSITY                                      WALKABILITY
Areas with more people going to and com-     Areas with more sidewalks, safer street
ing from destinations located near stops.    crossings, and a connected street grid.

HIGH RIDERSHIP

                                                  HIGH                  LOW
                                               RIDERSHIP             RIDERSHIP
LOW RIDERSHIP

CONTINUITY                                   LINEARITY
Routes that avoid traveling through          Routes that run frequently and in
long gaps of low-density development.        straight lines with few deviations.

HIGH RIDERSHIP                               HIGH RIDERSHIP

LOW RIDERSHIP                                LOW RIDERSHIP
Definitions
Comprehensive Operational Analysis – Commonly referred to as the COA, this analysis examines
existing conditions and routes future service plans. Typically updated every five years.
Coverage service – Transit service that has a purpose of providing geographic coverage of an area in
order to provide transit access to as many people and jobs as possible.
Farebox recovery – Fare revenue from a service relative to the cost to operate a service; calculated by
dividing fare revenue by the operating cost.
Frequency – the number of buses that operate per hour along a route for a majority of the day, which
is expressed by the number of minutes between bus arrivals.
Key Transfer Locations – Scheduled connections between routes to allow individuals to transfer from
one route to another. These are key components of a grid-based system as the transfers allow the
system to maintain frequency and riders to move easily from one part of town to another.
Marion County Transit Plan (MCTP) – The transit plan for Indianapolis through 2021, which includes a
70% increase in local route service and the construction of 3 rapid transit routes.
Paratransit – Paratransit is federally-required door-to-door service for qualified individuals; in
Indianapolis in accordance with the Americans with Disabilities Act (ADA) and IndyGo policy; the
service is called Open Door and is operated by a contractor managed by IndyGo.
Passenger Load – The number of passengers on a bus relative to the number of seats on a bus;
presented as a percentage.
Peak – The time of greatest demand for transportation, there are usually two peak periods: morning
and evening. Morning peak is from 6 a.m. to 9 a.m. and evening period is from 3p.m. to 6 p.m.
Productivity – Productivity measures the ridership on a service relative to the cost of providing that
service.
Reliability – A measurement of on-time performance, or how often a bus adheres to its scheduled
time; calculated as a percentage of time points on a route when a vehicle arrived on time.
Revenue hour – One transit vehicle and its driver operating in revenue service for one hour.
Ridership service – Transit service with the purpose of attracting high ridership numbers.
Route – A specific and fixed path of travel of a transit vehicle.
Route segment – A portion of a transit route.
1Service Area – The area served by public transit, typically a measure of a distance from a fixed route. In
Indianapolis, the Service Area is the entirety of Indianapolis, with some service provided by contract
to excluded cities.
Service category – A sub-type of transit service, based on the frequency of service; for IndyGo service
categories include Rapid, Frequent, Basic, and Coverage.
Service span – The hours of the day and the days of the week that a transit service operates.
Service Standards – Measurable benchmarks for key areas of transit service performance.
Stop Amenity – An object located at a bus stop that improves the rider experience, including seating,
shelters, boarding pads, lighting, waste receptacles, bike racks, real-time arrival information, wi-fi,
and more.
Stop Spacing – The distance between bus stops.
Time Point – A specified location along a route assigned a time of arrival for vehicles.
Travel Speed – The average speed of a bus from the beginning of a route (or route segment) to the end
of the route (or route segment).
2Purpose
Service standards are intended to provide measurables for a transit system that can then be
monitored. The standards provide clear indicators when performance falls below the benchmark. The
indicators will trigger a service evaluation and action plan to resolve identified performance issues. In
addition to transit service performance reviews, the service standards will also be used to support
service evaluation as part of IndyGo’s Title VI reporting process.
The Service Standards presented in this document are a direct result of significant public involvement
as part of the 2015 Comprehensive Operational Analysis (COA) and the Marion County Transit Plan.
The benchmarks expressed in the Service
Standards are related to two kinds of goals:
Marion County Transit Plan: Outlines
• Ridership goals, which are met through
transit being used by more people. significant service improvements to
• Coverage goals, which are met through local routes and the construction of 3
transit being available regardless of
how much it is used.
rapid transit routes.
IndyGo seeks to spend 80 percent of its budget pursuing the highest possible ridership per unit of cost
and 20 percent of its budget providing coverage service.
Principles Governing these Standards
There are several principles that are being used to govern the standards identified in this document.
First, the performance of services is best measured against their intended purposes. Since not all
transit services are designed to achieve the same goals, the service standards will differ for each
service category based on the intended service goals
Second, while service standards are conventionally applied to entire transit routes, there are
instances where the application of some standards will be different along certain segments of a route.
A route may comprise multiple segments that differ in purpose. Therefore, each route segment should
be assigned a service category and should be evaluated based on the service standard assigned to
that service category.
Third, while communication of these standards is important for transparency, staff discretion is an
important part of any policy document. Therefore, in an evaluation, staff may recommend no changes
because of factors outside the control of IndyGo.
Network Design Principles
The real benefits of transit present themselves at the systemwide level. This is especially true of high-
frequency services, where the interdependence between routes is key to the system design.
3Service Area
IndyGo’s service area is defined as Indianapolis which is approximately 370 square miles; by special
arrangement, IndyGo provides service to jurisdictions that do not contribute to its local funding.
Directness
IndyGo bus routes are designed for travel along paths that can be perceived as reasonably linear,
providing efficient service to passengers while controlling operating costs. More information about
how IndyGo weighs route deviations against route directness is provided below.
Simplicity
IndyGo will design and maintain a network of routes that are simple to learn, navigate, and remember
for new passengers. Simplicity must be emphasized and safeguarded by IndyGo, as many service
requests fielded can introduce increased and unnecessary network complexity. More considerations
of simplicity vs. complexity are discussed below.
Service Categories
Service Map Predominant
Purpose
Category Representation Frequency*
Color reflecting
name of route
Rapid 10 minutes or better Ridership
(e.g. red for Red
Line)
Thick dark
Frequent 15 minutes or better Ridership
green line
Medium light Mix of ridership and
Basic 30 minutes
green line coverage
Thin light
Coverage 60-120 minutes Coverage
green line
Table 1: Service Categories and their associated map colors, predominant frequencies and purposes. * The "predominant
frequency" is the frequency that is sustained throughout the weekday morning, midday, and evening, and in the daytime on
weekends.
Rapid
Rapid services (10 to 15-minute frequency) must be ridership-justified. The concentration of resources
on these corridors is essential for achieving the higher ridership and productivity expected of these
corridors. In IndyGo’s current service, the Rapid category applies only to bus rapid transit lines.
While Rapid service almost always runs frequently, it differs from Frequent service due to its speed.
The higher speeds of rapid transit are achieved through wider stop spacing, dedicated lanes, transit
4signal priority (TSP), level boarding, and off-board fare collection. Rapid service is generally perceived
by transit riders as being more useful than other service categories because it has a faster average
vehicle speed.
Frequent
Frequent services (≤15-minute frequency) must also be ridership-justified. Generally, Frequent service
has high ridership, but not high enough to warrant the resources committed to Rapid transit. Top
performers in this category will be reviewed for potential upgrade to Rapid service as soon as a full
analysis can be completed and as resources become available.
Basic
Basic Services can be categorized as either ridership or coverage. Basic services that are considered
ridership-justified are high performance routes (or route segments) which may be upgraded to
frequent service if/when resources permit. Basic services that are coverage-justified generally have
high enough ridership to justify frequency greater than one trip every hour. Because conditions for
very high ridership are not present, these routes are unlikely to be upgraded into the Frequent service
category. Generally, coverage-justified Basic services are more productive at their greater frequencies
than they would be if the service were cut to hourly.
Coverage
Coverage services are intended to provide transit in places that are harder to serve due to lower
population density. In some places equity considerations drive the need for some level of service.
Coverage services achieve low levels of ridership relative to service cost, but that is accepted as
ridership is not the purpose of providing Coverage service.
Paratransit
The services described above are complemented with paratransit service, called Open Door,
throughout the service area. These services are required by the Americans with Disabilities Act (ADA)
and are operated in accordance with federal statutes and regulations. IndyGo is required to provide
door-to-door services for individuals who qualify within ¾ miles of fixed route service. IndyGo serves
all of Marion County, which exceeds the federal ADA mandate. The service is required to operate the
same hours as fixed route service. Standards for Paratransit are not included in this document but are
included in other IndyGo planning documents.
5Elements for Service Categories
Defining Features
These describe features that must be present for the service to be in the given category. If a service
does not have these features, it should not be in this category. These features include:
• Frequency
• Daily and Weekly Span
• Stop Spacing
The following section describes each Defining Feature, with the characterization required for a route
to be considered in a service category.
Frequency
Frequency is the number of buses that operate per hour along a route for a majority of the day, which is
expressed by the number of minutes between bus arrivals. Service during the periods in the early
morning and late evening are often less frequent than peak hour service due to reduced demand.
Service Category Frequency
Rapid 10 min.
Frequent 15 min. or better
Basic 30 min. or better
Coverage 60 min. or better
Table 2. Frequency by Service Category
Figure 1: Graphic representing the frequency presented by the different Service Categories.
6Daily and Weekly Span
Span refers to the hours of day and the days in the week that a service operates, and the hours that it
runs at its defining frequency. Routes meant to drive ridership should have longer spans of service
because the service is more useful, providing trips for work and entertainment.
Service Weekdays Saturdays Sundays & Holidays
Category
Total Hours Service Service Service Service Service Service
Hours at Hours at Hours at Hours at Hours at Hours at
defining lower defining lower defining lower
frequency frequency frequency frequency frequency frequency
Rapid 20 14 6 14 6 0 16
Frequent 20 14 6 14 6 0 16
Basic 18 16 2 16 2 0 16
Coverage 16 16 0 16 0 0 16
Table 3. Service span by service category.
Stop Spacing
Stop Spacing is the distance between bus stops. Stop spacing is a key contributor to the operational
efficiency and productivity of a transit route.
Figure 2. How buses on Route 8, on Washington Street, spends their time.
Serving a stop takes time, regardless of the number of people boarding or alighting. The more stops a
bus makes, the slower its average operating speed is, the less useful it is to passengers, and the
costlier it is to operate. To achieve higher travel speeds and ridership, IndyGo encourages its
customers to gather at fewer stops. Although fewer stops can be inconvenient, the increased
frequency and speed of routes is intended to mitigate it.
7Stop spacing standards are mostly motivated by the need to reduce delay, as delay can discourage
ridership and make service more expensive to operate. However, wider stop spacing has other
advantages:
• Safer pedestrian environment. Wider stop spacing increases the likelihood that every
stop can be located at a place where it is safe to cross the street. IndyGo resists placing
stops on two-way routes where it is not possible to cross the street safely. Any round trip
will require using stops on both sides of the street, but stops are not useful if crossing the
street is difficult, dangerous, or impossible for most customers.
• Better stop amenities. Wider stop spacing increases the percentage of customers who
will have access to higher quality bus stop amenities at their typical bus stop locations.
These amenities may include benches, shelters, real-time bus arrival information, off-
board fare collection, and other amenities. The fewer stops there are, the greater the
proportion of stops that will have these amenities.
Stop spacing for Rapid and Frequent routes must be managed carefully to ensure that stops are not
too close, resulting in the bus stopping too frequently. The Marion County Transit Plan recommended
Rapid service stopping, on average, twice per mile (approximate distance of a half-mile between
stops). The expectation is that Rapid service will be fast and frequent enough that riders will be willing
to walk further to access it. An emerging industry standard for Frequent service is to space stops
approximately four times per mile (approximate distance of a quarter-mile between stops). Basic and
Coverage route stop spacing varies based on the physical context of an area and whether the
pedestrian infrastructure provides a safe walking environment. Often times, additional stops need to
be provided due to unsafe or non-existent pedestrian infrastructure or a disconnected street network.
Factors staff consider when evaluating stop spacing include:
• Land use and zoning
• Presence and condition of pedestrian infrastructure
• Geographic and right of way considerations
• Connecting routes
• Ridership of the stop
8Service Stops per Ideal distance
Category mile between stops
Rapid 2 stops ½ mile
Frequent 4 stops ¼ mile
Basic 4 to 6 stops Varies based on
context
Coverage 4 to 6 stops Varies based on
context
Table 4 Stop spacing by service category
Figure 3. Stop spacing by service category.
The service standards in the table refer to averages, with an understanding that actual stop spacing
will reflect local challenges and needs. The average for each category should be within the stops
spacing range from that category.
Flexibility is key for the low-ridership coverage services. Coverage routes may change over time and
experiences may vary across different urban forms, too frequent stop spacing may result in issues
associated with travel speed and reliability. Such situations require flexibility in determining stop
spacing.
Service Quality Targets
These describe outcomes that result from other features, but they are inputs into peoples’ decisions
to use transit. These include:
• Travel Speed
• Reliability
• Stop Amenities
• Passenger Load
9• Vehicle Assignment
The following section describes each Service Quality Target and the target anticipated for each route
in any given service category.
Travel speed
The travel speed of a bus route has a direct impact on its usefulness and its operating cost: slower
service requires more buses to deliver a given frequency. Maximizing ridership requires services that
maintain high average operating speeds relative to alternative options.
Service Category Scheduled Speed
Rapid 20 to 22 mph
Frequent 13 to 17 mph
Basic 13 to 17 mph
Coverage 14 to 18 mph
Table 5. Scheduled speed by Service Category
Travel speed standards determine scheduled speed, which is in turn used to build route schedules.
When actual speeds do not adhere to scheduled speeds, schedule adherence, as measured through
on-time performance, will suffer.
Routes often have varying service categories along different segments of the route. Because of this,
scheduled speed should be evaluated for each unique route segment.
Operating speeds are affected by:
• Ridership-related delays. These types of delays result from increased ridership and therefore
slower boarding and alighting times. A transit agency has tools to improve travel speeds
despite high ridership, including reducing the number of stops per mile. Other tools available
to improve travel speed include all-door boarding, off-board fare collection, or upgrading to
digital fare payment systems (which process payments more quickly than cash payment
methods).
• Traffic congestion and signals. Transit agencies often collaborate with City engineering
departments on transit signal priority systems that reduce the amount of time buses spend at
red lights and/or provide infrastructure (such as dedicated transit-only lanes) that allows
transit vehicles to “queue jump” cars waiting at congested intersections. Transit-only lanes
can also be incorporated along longer sections of congested roadways.
10On-Time Performance
On-time performance measures how often the bus adheres to its scheduled time. The better the on-
time performance, the more reliable a system can feel for riders. This reliability provides confidence
and comfort to transit riders that the bus will arrive on time and take them to their destination as
intended.
IndyGo’s current standard for on-time performance is as follows: if a bus is less than one minute early
or less than five minutes late at a time point, it is considered on-time. The table below outlines the
2017 Reliability standard and the 2021 Reliability standard, which are both expressed as the
percentage of buses that arrive on-time.
Service 2018 Reliability 2021 Reliability
Category Standard Standard
Rapid 90% 90%
Frequent 75% 85%
Basic 75% 85%
Coverage 75% 85%
Table 6. Reliability by Service Category. Reliability is measured as percentage of buses that arrive on-time.
There are two reliability standards to reflect the resource reality of today versus the planned
investments for the 2021 system. The resource-constrained reality of today requires a lower-reliability
standard. IndyGo, however, will work to improve the on-time performance as more buses and drivers
are added.
Under normal conditions Rapid and Frequent services are likely to experience the greatest delays
(because of their high ridership and more congested operating environments), and it can be tempting
to set lower standards for them. However, Rapid and Frequent services also carry the most people and
are meant to maximize the number of riders they attract, so their delay has a greater influence on the
overall percentage of IndyGo’s riders who experience delays.
Because routes often have varying service categories along different segments of the route, reliability
should be evaluated for each unique route segment as opposed to being evaluated as full routes.
It is impossible to achieve and maintain 100 percent on-time performance due to varying traffic and
weather conditions, construction activity, detours, collisions, and other service interruptions.
Nevertheless, every effort should be made to ensure that all IndyGo buses operate safely and arrive
“on-time”.
Key Transfer Locations
One of the benefits of a grid-based transit network is the increased ability to get to and from many
destinations more directly without always having to transfer at one central transit hub. Because of the
11increased likelihood of transfers within a grid-based network, higher reliability standards should be
set for on-time performance at key transfer locations where a high number of riders will transfer
between routes. IndyGo has identified two key transfer locations: Downtown Transit Center and
Washington Square Mall. IndyGo will monitor the on-time performance of transfers at these locations,
but at this time will not set a standard or require recommendations based on any transfer
performance at these transfers.
Stop Amenities
IndyGo considers multiple factors when determining what amenities to place at bus stops. Often
these factors, many of which are outside of IndyGo’s control, limit what types of amenities can be
included at a bus stop. The factors IndyGo considers during stop amenity improvement decisions
include:
• Existing ridership numbers
• Availability of public right-of-way (ROW)
• Adjacent and nearby property zoning and land use
• Access to popular destinations
• Proximity to stops with existing amenities
• Pedestrian infrastructure (connecting sidewalks, curb-ramps, crosswalks, etc.)
• ADA accessibility
• Proximity to key transfer locations and where routes connect
Not all amenities listed in the following table will be present at every stop type.
Amenities Typical Ridership
Basic Bus Stop Bus Stop Sign Default
Boarding Pad (if possible)
Bus Stop with Basic Bus Stop Amenities and: 10-20 Boardings Per Day
Bench Seating (Bench or Simme-Seat)
Sheltered Bus Basic Bus Stop Amenities and: 20+ Boardings Daily
Stop Shelter
Lighting
Waste Receptacle
Seating
Bike Racks
Super Stop Sheltered Bus Stop Amenities and: Based on Route Service
Larger Shelter Category
Near-Level Boarding
Real-Time Information Display
Security Cameras
Off-Board Fare Payment
Rapid Transit All Super Stop Amenities and: Determined by Planning
Station Station Signage Effort
12Level Boarding
Fully Covered Platform
WiFi
Transit Center All Rapid Transit Station Amenities and: Determined by Planning
Public Restrooms Effort
On-Site Security
Staffed information desk
Table 7. Stop Amenities by Boardings.
Passenger Load
In managing bus crowding, there is a balance between maximizing passengers on a bus and providing
a comfortable passenger experience. The intent of passenger load standards, then, is to identify a
quantifiable balance between passenger comfort (and safety) and operating efficiency. These
standards define maximum passenger loads to ensure acceptable levels of rider comfort and safety
while promoting efficiency.
Passenger load is defined as the percentage above seated capacity of a vehicle. Passenger load is
measured by evaluating average ridership per trip against vehicle capacity. A passenger load of 120
percent (which means there are 20 percent more passengers than the number of seats on the bus)
generally reflects a comfortable standing load and is recommended as a balance point between
maximizing passenger comfort and productivity. However, for Rapid service, a passenger load of 150
percent is set, as it is expected that riders will be more accepting of increased passenger loads due to
increased service speed, shorter trip times, and overall service efficiency.
Category Passenger Load
Rapid 150%
Frequent 120%
Basic 120%
Coverage 120%
Table 8. Passenger load by Service Category.
If the load standard is exceeded, IndyGo should evaluate the potential for improving service
frequency.
Vehicle Assignment
IndyGo policy is to distribute vehicles equitably amongst its routes based on the age of the vehicle.
High ridership routes are more likely to be assigned vehicles with higher capacity. Rapid routes are
only assigned 60’ articulated vehicles. Vehicles may also be assigned to routes based on other factors
beyond age.
13Outputs
Outputs measure achievement towards the highest-level goals of the IndyGo network, productivity
(ridership per unit of cost) and coverage (provision of service to socially important places and people).
Output: Productivity
Productivity measures the ridership on a service relative to the cost of providing that service.
Productivity is measured as boardings per service revenue hour. A revenue hour represents one transit
vehicle and its driver operating in service for one hour.
Service Minimum Productivity
Category Productivity Threshold
Rapid > 27* 18
Frequent 27 18
Basic 21 14
Coverage None N/A
System- 23 15
wide
Table 9. Productivity by Service Category. *Rapid routes should have a productivity that exceeds Frequent routes.
Productivity tracks generally with farebox recovery (fare revenue / operating cost). Farebox revenue is
based on productivity, but also on average fare per boarding. Productivity will be measured as an
annual average that includes a complete cycle of seasons and school years.
Because routes often have varying service categories along different segments of the route,
productivity will be evaluated for each segment of a route based on its service category; these are
called major segments.
Output: Coverage
The goal of a coverage service is to provide transit access to as many people and jobs as possible,
acknowledging that the purpose of the route is to provide geographic coverage. While IndyGo has set
a long-term goal of 20 percent of its operating budget to go towards coverage services, that
percentage will be higher in the short-term. IndyGo will work towards achieving 80 percent ridership
and 20 percent coverage levels by adding additional ridership-based service in the future, not
necessarily by cutting coverage service.
14Category Minimum Coverage
Rapid None
Frequent None
Basic None
Coverage Maximize residents and
jobs near coverage
services
Table 10. Coverage by Service Category.
One measure of the outcome of both decisions - to dedicate up to 20 percent of the transit budget to
providing coverage and to run those coverage services as close to as many people and jobs as
possible - is the percentage of Marion County residents and jobs that are within a half-mile of service.
Using and Updating these Standards
Monitoring the Standards
Service standards provide measurable benchmarks from which performance can be monitored and
evaluated. The standards indicate when an aspect of performance is not what the agency or its
partners intended. Such indication should trigger an evaluation of the problem and a plan of action
for resolving it. Table 11 identifies the review process for a service standard and when staff will
recommend modifications based on the review; these are all subject to the professional discretion of
IndyGo staff.
Title VI Service Monitoring Report
IndyGo is required to evaluate its service using these service standards to determine if the service
delivered has a disparate impact and/or disproportionate burden on minority and/or low-income
individuals in its service area. The Service Monitoring Report is required as part of a Title VI Program
Update that is completed every three years by IndyGo.
Analysis of IndyGo’s service for the purpose of the Title VI Program Update will not consider the
following parts of these defined Service Standards:
• Route segments. Routes will be analyzed at the route level, not the segment level as
outlined in these standards.
• Outputs. These standards and policies are designed to document the planning
process required for the network. The standards define Output metrics: Productivity and
Coverage. These outputs are relevant only to the network planning and not to the Title VI
analysis.
15Standard Review Process Modifications
Recommended
Frequency • Corridor Planning Plan recommendations*
• COA
DESIGN FEATURE
Daily and Weekly Span • Corridor Planning Plan recommendations
• COA
Stop Spacing • Corridor Planning Plan recommendations**
• COA
• Productivity Review
Travel Speed • Productivity Review Below standard
• COA
Reliability • Productivity Review Below standard
SERVICE TARGETS
• COA
Stop Amenities • Staff discretion Increase in boardings, or
street redesign process
Passenger Load • Productivity Review Exceeding maximum
• COA load for a Service
• Staff discretion Category
Productivity • Productivity Review < 2/3 of Service Category
Productivity
OUTPUTS
Coverage • COA ***
• Staff discretion **
Table 11. Standard timing and change table. *Frequency changes should be done only during a rigorous and comprehensive
transit planning process. The process for evaluating frequency is identified in the Appendix.
**Stop spacing may change as a result of the annual review of network and route productivity.
***New service requests are likely to be for Coverage routes. There are steps outlined in these Service Standards to evaluate
whether additional Coverage is justified.
Review Process
Frequency, span, and stop spacing are all outcomes of service planning activities. They can be
measured and checked against the standards at the time any plan (corridor or short-range network
plan) is proposed and adopted. The Service Quality Targets (Travel speed, reliability, stop amenities,
passenger load) may be evaluated on a more regular basis, as part of the Productivity Review. Table
12 provides an overview of different IndyGo service review processes, including the frequency of the
process. The Productivity Review is described in additional detail further in this section.
16Review Process Process Frequency General Process Purpose
Comprehensive Four to five years. A comprehensive review of existing operations and
Operational Analysis suggestions for service changes.
(COA)
Corridor Planning As Needed Typically prompted by a COA, corridor planning evaluates
transit demand for a particular corridor, analyzing
demand and providing a recommendation for service.
Productivity Review Annually Review of Service Standards for the existing network and
modification recommendations for any substandard
routes.
Staff Discretion By discretion Staff continually reviews service data and customer and
employee feedback. Staff may decide to make minor
changes to a route based on their information-gathering.
Table 12 Service review processes
Productivity Review
IndyGo should evaluate its network and route performance according to these Service Standards on
at least an annual basis. This process is defined as the “Productivity Review”. This review
encompasses evaluation at the route (and segment) level of productivity of the network. Any new
service or network element should be allowed to run an entire year before judgements are made
about its productivity.
The process is outlined as follows:
1. Review services relative to associated service standards
2. Identify underperforming services,
3. Evaluate deficiencies causing performance issues,
4. Recommend modifications,
5. Obtain approval from appropriate decision-makers,
6. Implement the modifications, and
7. Monitor route performance.
Review services relative to associated service standards
The productivity of each major segment in each route will be determined. Staff decide what major
segments are and their defining characteristic is their Service Category. As Figure 4 conveys, a route
may have several major segments.
17Figure 4. Example of Major Segment determination process.
Identify underperforming services
Productivity outcomes are the result of an entire network layer of a given frequency. Thus, the
standard presented in Table 9 is for the average across the entire category. A deficiency occurs when a
single major segment for a route drops below 2/3 of the standard outlined in Table 9. This recognizes
the interdependence found in a public transit network. The entire route is then analyzed, with
particular focus paid to the major segment considered deficient.
Evaluate deficiencies causing performance issues
Once a deficiency is identified, the Service Quality Targets and underlying metrics should be
evaluated. On-time performance data is available to IndyGo daily, though the most advanced transit
information systems allow for it to be monitored in real time. Automatic Vehicle Location data should
be queried to diagnose potential problems. Through a detailed analysis it may be possible to
determine whether a delay problem correlates with a particular route segment or a particular time of
day, or other factors.
Other Targets, including speed, stop amenities, and passenger load should be investigated equally.
Recommend modifications
The application of productivity standards to existing routes is a flexible process. The purpose of the
standards is to help identify routes that are most in need of service modifications, such as
restructuring to eliminate lower-productivity segments or branches, adjusting service frequency to
better reflect the demand for service, or providing additional promotion of low ridership routes.
Elimination of routes is only intended as a last resort, when it has been determined that no cost-
effective actions are able to improve the productivity of the route.
Potential solutions to resolve performance issues include, but are not limited to:
• Alter bus stop spacing or bus stop locations (far side or nearside of intersection)
• Install signal priority
• Implement off-board fare collection and all door boarding
• Add dedicated transit lanes or intersection queue jumps
• Create public campaigns about helpful passenger practices for fast operation
18• Adjust bus schedule
• Add additional buses to improve frequency
• Improve bus stop amenities
• Simplify bus routing
Table 13. Identified deficiencies and possible actions to resolve issues.
Obtain Approval from Appropriate Decision Makers
Present recommendations to internal IndyGo staff and adjust as needed. The changes should then be
presented to any appropriate stakeholders (such as the City of Indianapolis’ Department of Public
Works) and IndyGo subcommittee(s), and then to the Board of Directors for approval.
Implement the Modifications
Modifications should be implemented once the Board of Directors has approved and as soon as
resources are available. If resources are unavailable, the most critical improvements, as determined
by staff, should be prioritized.
Monitor route performance
Modified routes should be monitored but not analyzed until a year after changes occur. The same
approach should be taken for COA, Corridor Planning, and any other comprehensive transit planning
implementation. Route performance monitoring should follow the Productivity Review or other
process as approved by the Board of Directors and deemed appropriate by staff.
Responding to Service Requests
IndyGo routinely receive requests to operate new service, typically out of their existing operating
budget. The majority of these requests will be for low-ridership services which, if provided, would
reduce the overall productivity of the transit network.
IndyGo must balance the need to serve every resident within its service area against the public
demand for a highly productive, efficient, and useful transit service, given a limited budget. Service
requests are evaluated to balance these demands. Details on how IndyGo staff will respond to service
requests is found in the Appendix.
Updating the Service Standards
These standards should be evaluated and modified only after a Comprehensive Operational Analysis
or other significant, comprehensive transit planning effort. While corridor plans may affect a single or
multiple routes, they will not provide a comprehensive picture of standards for all service categories.
19APPENDIX A: Additional Considerations
Frequency Changes Due to Low Productivity
Productivity standards are segment-based, so they will require segment-level assessment of
boardings and revenue hours. Once a route is divided into meaningful segments, automated queries
of Automated Passenger Count (APC) data can be developed for ease of reporting.
Rapid and frequent routes are strongly interdependent (because their higher frequencies increase the
number of available transfer opportunities). Any low-performing frequent route should be analyzed as
follows before considering reducing its frequency:
• Does the route have an inner segment that connects with other frequent routes, and outer
segments that do not? If so, look at the productivity of these outer segments in isolation to
see if they have markedly lower productivities than the inner segment. If they do, the
segmentation of the route can be revised; the outer segment can be considered for
demotion to the basic or coverage service categories.
• Does the route show evidence of high transfer volumes at key network intersections? If so,
assume that any service reduction will cause ridership drops not just on the route in
question but also on the intersecting route(s).
APPENDIX B: Responding to Service Requests
Step 1. Will the requested service increase productivity in the near term?
Does meeting this request achieve ridership comparable to that of the ridership network? This can be
assessed by asking if the request improves or worsens the following features of the high-ridership
network:
• Density. The network’s stops are surrounded by a high density of residents, jobs, or other trip-
generating land uses.
• Walkability. The network is focused on areas where it is easy and safe to walk between bus
stops and the surrounding development.
• Linearity. The network’s routes are as straight as possible, so that they are perceived as a
reasonably direct path between any two points on the route.
• Continuity. Service does not need to cross areas with long spans of undeveloped or
underdeveloped land.
• Uniqueness. Parallel routes are far enough apart that they do not compete for the same
riders.
If a service request would not be a clear net improvement in the feature of the ridership network, then
it is a coverage request. Meeting a coverage request will predictably lead to lower ridership (shifting
resources anyway from higher productivity routes), so coverage requests must be met out of the
portion of the budget assigned to coverage.
20Step 2. Will the requested service increase productivity in the long term?
Sometimes, developers or advocates ask transit agencies to fund a service because they believe it will
help a community develop in a certain way, leading to a long-term ridership outcome. Transit
agencies must view these arguments with caution, because it puts the transit agency in the position of
gambling on the land use outcome using its operating budget. There is almost always a way to invest
service toward a shorter-term ridership outcome, one that depends on fewer uncertain factors, so
investing in these possible futures comes at a cost to potential riders in the present.
The actual policy toward a developing area must reflect the degree of likelihood that the development
will occur as planned. Fully financed development on the verge of construction must be treated as
existing land use, but development in earlier planning stages requires the cautions outlined above.
Step 3. Will the requested service increase the number of people or jobs near service?
If the request substantially improves the system’s performance on the coverage output target, and
does so at a modest cost, it should be identified as a possible coverage improvement. Possible
coverage improvements should be prioritized for allocation from the portion of the operating budget
that is dedicated to the coverage goal. Coverage improvements on this list can be implemented if and
when:
• The budget grows to the point that more total funding can be devoted to coverage.
• The Board elects to shift the policy split of the budget between ridership and coverage
purposes.
• Other coverage services are deleted, possibly those that provide coverage less efficiently.
Step 4. If the answer to the above questions is “no”
IndyGo should be very reluctant to introduce services that do not satisfy one of the above tests. If
there is a strong desire on the part of the Board to add the service for other reasons, options can
include:
• Seeking external funding for the service, ideally from the parties most likely to benefit from it.
• As a last resort, creating a third slice of the budget, distinct from the ridership and cover slices,
called “discretionary.” This slice could be devoted to any services the Board desires regardless
of objective policy justification.
Short term solutions when everything is no: Alternative forms of mobility, such as ride-matching,
vanpools, and subsidized taxis.
Long term solutions: Coordinate with businesses, the City of Indianapolis Department of Metropolitan
Development, and others to encourage people, businesses and institutions to locate along existing
transit service.
21APPENDIX C: Updating Service Purposes
Individual routes are assigned a category based on its purpose; either to maximize ridership or
provide transit access to as many jobs and residents as possible. IndyGo may wish to revise the
purpose of each route; this process of this determination is outlined below:
Route Purpose
Rapid and frequent services are all ridership-justified. Coverage services are all, by definition,
coverage-justified. The primary challenge is the basic category.
In certain cases:
• If there are clear reasons to expect ridership to dramatically improve soon, such as imminent
development or redevelopment, provisionally assign the route to the ridership purpose. Any
such imminent improvement should be an improvement in one or more of the necessary
features for ridership that arise from the built form: density, walkability, linearity, and
continuity.
• If the built environment is mostly unfavorable to transit (in terms of generally low density,
walkability, linearity, and continuity) and shows little signs of changing for the better, assign
the route to the coverage purpose.
• In a small number of cases, a route may be running at 30-minute frequency its purpose is
ideally just coverage or just ridership, yet some constraint prevents it from running at higher
or lower frequency.
Segment Purpose
One challenge of using frequency-based or purpose-based standards is that part of a route may be in
one category and part in another.
Many routes in the recommended networks have an inner frequent segment which is clearly ridership-
seeking and less frequency tails or branches which are meant to provide coverage.
In these cases, we recommend that:
• If the low-frequency portion of a route is less than 10 percent of the total revenue hours, the
entire route can be analyzed in the higher-frequency category.
• Otherwise, the frequent and infrequent segments should be separated and assigned to
separate categories.
• If a low frequency segment is part of a short mid-route split or minor variation in route, the
route should be identified in the higher-frequency category.
Measuring Productivity of Outer Segments
Separately analyzing the productivity of inner and outer route segments (where the inner segment has
higher frequency) requires an extra step. One analytical method is as follows:
22You can also read