Pickers' Guide to Acoustics of the Banjo, parts I and II
←
→
Page content transcription
If your browser does not render page correctly, please read the page content below
HDP: 21 – 01
arXiv:2104.02480v1 [physics.pop-ph] 4 Apr 2021

                                                     Pickers’ Guide to Acoustics of the Banjo, parts I and II

                                                             David Politzer∗ , Jim Woodhouse† , and Hossein Mansour+
                                                                                (Dated: April 2, 2021)

                                                   The results of an investigation of fundamental banjo acoustics and physics are now
                                                 readily available.[1, 2]. The papers describe measurements and calculations which
                                                 demonstrate the extent to which the sound of a banjo can be represented by linear
                                                 modeling of the basic parts common to the banjo family: strings, drum head, light
                                                 floating bridge, and break angle. This note summarizes the conclusions of that work
                                                 and outlines some of the physics involved. While the scrutinized banjo behaviors
                                                 are well-known to discerning builders and pickers, the focus here is how these arise
                                                 from the physics. A practical application (discussed in an addendum) concerns head
                                                 tap-tuning: what’s going on, how it works, and why some people and some tuners
                                                 can’t get it right.

                                                 ∗ 452-48   Caltech, Pasadena CA 91125; † Cambridge University Engineering Depart-
                                                 ment, Trumpington Street, Cambridge CB2 1PZ; + Dassault Systèmes – SIMULIA,
                                                 5005 Wateridge Vista Dr., San Diego, CA 92121
2

          Pickers’ Guide to Acoustics of the Banjo, parts I and II

                                  I.   INTRODUCTION

   What happens when you use a drum head for the soundboard of a plucked instrument?
You get a banjo — or one of its many cousins from cultures around the world. Their sounds
share features that distinguish them from instruments that are similarly strung and played
but use thin wood (or some such material) in place of the drum head.
   “What happens...?” can also mean: What’s going on from a physics perspective? How
does it work?
   In all acoustic string instruments, string vibrations activate the soundboard. The sound-
board vibrations disturb the surrounding air, and that turns into the sound we hear.
The simplest distinction of the banjo from, say, an identically strung guitar of compa-
rable size, is that the head and bridge are much lighter than the analogous parts on
the guitar. Energy is transferred faster by the strings to the banjo head, and it moves
more.   So, the banjo sound is louder at first and decays faster.        But there are many
more consequences of the drum-as-soundboard.         (To hear an example, you can go to
http://www.its.caltech.edu/~politzer/pickers-guide/four-pluck-comparison.mp3 or simply
click here for gentle plucks on a typical banjo and a guitar, at the same place along equal
scale-length open steel strings.) Using acoustic guitar again for comparison, well-studied
guitar physics and acoustics imply that, if it were physically possible to build a wood
soundboard and bridge as light as a banjo’s, it would still not sound like a banjo.
   Physics and structural engineering deal with numbers and equations. Ref. [1] translates
banjo into a form appropriate for that kind of analysis. The approach and tools are mostly
ones long used to study stringed instruments. There is also a body of previous research
that has specifically addressed drums. However, it hadn’t all been put together to study
drum-topped string instruments. In addition, yet other physics from other contexts enters
as well. Guitar and violin, which are both more widely familiar and have been intensively
studied, provide useful comparisons. Ref. [1] has links to sound files at an on-line science of
musical instruments resource, Euphonics[2], put together by author J.W. These are sounds
synthesized using the physics models developed in ref. [1]. You can judge for yourself how
well straightforward linear modeling of strings, bridge, and head account for banjo sound.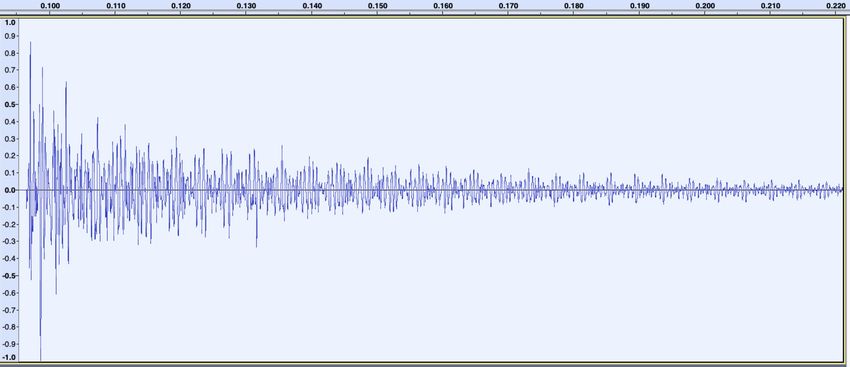
3

Furthermore, the Euphonics sound links include variations of the relevant parameters, such
as bridge mass and break angle. The agreement of the variation in modeled sounds with
actual players’ experience is yet further confirmation that the basics have, indeed, been
captured by the modeling. Sketched below are some of the physics details of that work.
   Strings, floating bridge, and drum-like head are the elements common to all instruments
with banjo sound. To be sure, there are many other features whose design variations con-
tribute discernible sound differences.[3] To understand those, knowledge of the basics can’t
but help. There are also certainly non-linear effects, even in the basic elements, that can be
heard if one listens closely.

                                II.   ENERGY & DISSIPATION

   On an acoustic guitar (or any wood topped instrument), sound carries away only a small
fraction of the energy that is put in by a pluck. Most of the energy is dissipated into heat.
The dominance of dissipation into heat is frustrating if you want a simple perspective on
what’s going on. Those losses are functions of frequency that cannot be deduced from simple
physics models. A given resonance of the instrument can contribute to sound production
or sound suppression depending on the degree of its loss to friction. It is possible to study
frictional dissipation empirically. By and large, higher frequency motions lose a larger frac-
tion of their energy to heat than lower ones. Furthermore, the sound radiation efficiency
of soundboard vibrations grows with increasing frequency. Together, these effects make the
higher frequency sounds weak and short-lived. The total sound is dominated by the response
of a handful of low frequency resonances of the body. And their properties are sensitive to
the detailed design of the instrument.
   The vibrations of a wood soundboard depend on its internal properties and the applied
forces but not particularly on the surrounding air. In contrast, drums have long been of
intellectual interest in physics precisely because the surrounding air and produced sound
have a strong impact on the actual head motion.
   In ref. [1], a variety of lines of inquiry show that heat loss is relatively small in any part of
banjo sound production. This means that dissipation-free, linear equations govern most of
what’s going on. The equations imply that the drum head has increasingly more resonances
than a wooden soundboard as frequency increases and that the radiation efficiency decreases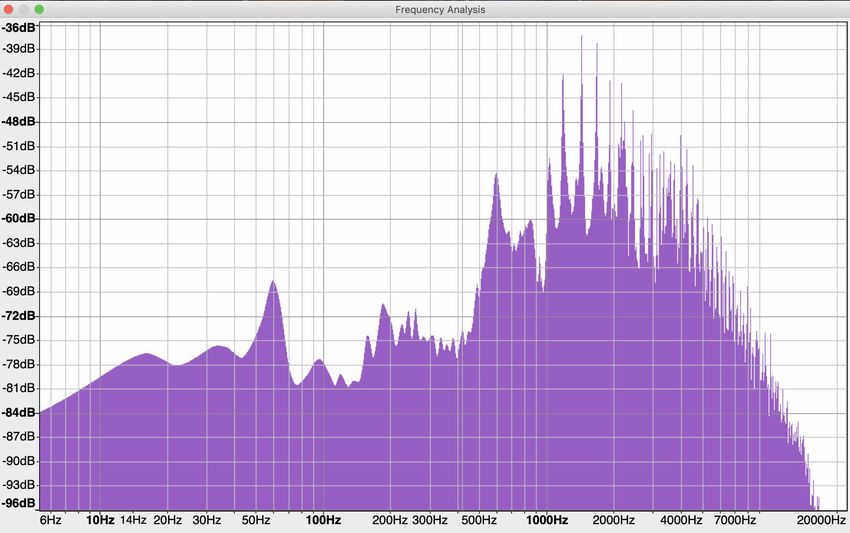
4

with increasing frequency. Compared to guitar, together these give a sound spectrum that
is much richer at high frequencies, and those high frequency components have sustain that
is comparable to the low frequency ones.
   Several observations come together to support this perspective on dissipation in the banjo
and its contrast to the guitar. The simplest evidence presented in ref. [1] is the success of
the analytic and numerical modeling in reproducing measured behavior with little or no
energy loss besides energy carried away by sound. Somewhat more subtle are analyses of
pluck sounds into mode frequencies and lifetimes. On guitar, recognizable string modes
have much longer lifetimes than body modes. This gives strings the time to dissipate energy
themselves without most of it proceeding to sound production. On banjo, the string resonant
frequencies die off on times comparable to body modes, suggesting that’s how strings lose
most of their energy, i.e., by transferring it to the body.
   To go further, we turn to a particular measure of how plucked strings get the soundboard
moving.

                              III.   BRIDGE ADMITTANCE

   Imagine plucks on a banjo and a comparable size guitar, strung and tuned identically.
Following a long and successful tradition in the study of guitars and violins, we focus on
precisely what happens when the vibrating string applies a force to the bridge.
   The characterization of bridge motion in response to string force is admittance. Admit-
tance is the velocity at a point divided by the applied force that produces it. For vibrations
in the context of linear physics, we can consider forces, motions, and admittance as func-
tions of frequency. In general, admittance is a complex quantity, with its phase reflecting the
phase difference between the driving force and the produced velocity. Viewed as a function
of frequency, the admittance at the bridge involves all of the subsequent physics — not just
the bridge itself but also the whole head and the surrounding air. (Admittance is precisely
the inverse of impedance.)
   Energy considerations offer another perspective on the interpretation and importance
of admittance. The up-and-down motions of strings apply oscillating forces to the bridge.
However, energy is transferred from a string to the bridge only to the extent that the contact
point moves. Otherwise, there is no energy transfer. So admittance is a direct measure of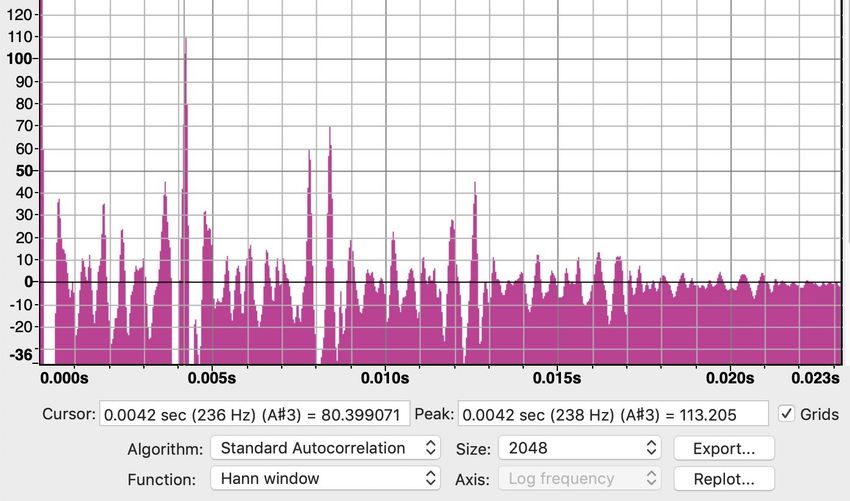
5

how much of the pluck energy gets to the soundboard.

FIG. 1. Measured bridge admittance at the location of the 1st string slot: blue is the head without
bridge & strings, red is with bridge and damped strings, and black is guitar with damped strings.

   Fig. 1 shows measured admittance of a Deering Eagle II banjo and a Martin Woodhouse
steel string acoustic guitar. The guitar is in black. The blue curve is for the banjo without
bridge and strings, forced on the bare head at the location where the bridge ordinarily goes.
The banjo with bridge and damped strings is in red. The vertical applied force and measured
velocity are at the location of the first string on the bridge.
   The contrast of guitar in black with the bare drum head in blue illustrates what’s been
said so far. The drumhead soundboard is louder overall — because it is much lighter. And
it is increasingly more responsive at higher frequencies because there are more and more
resonant modes. Specifically, aside from their lowest several modes, wood soundboards have
resonances that, on average, are equally spaced in frequency. On a drum head, the density
of resonances increases proportional to the frequency.
   Add strings and bridge (and tailpiece) to the drumhead, and the behavior changes radi-
cally.
   The up-down-up-down-up-down aspect of the curves initially obscures some underlying
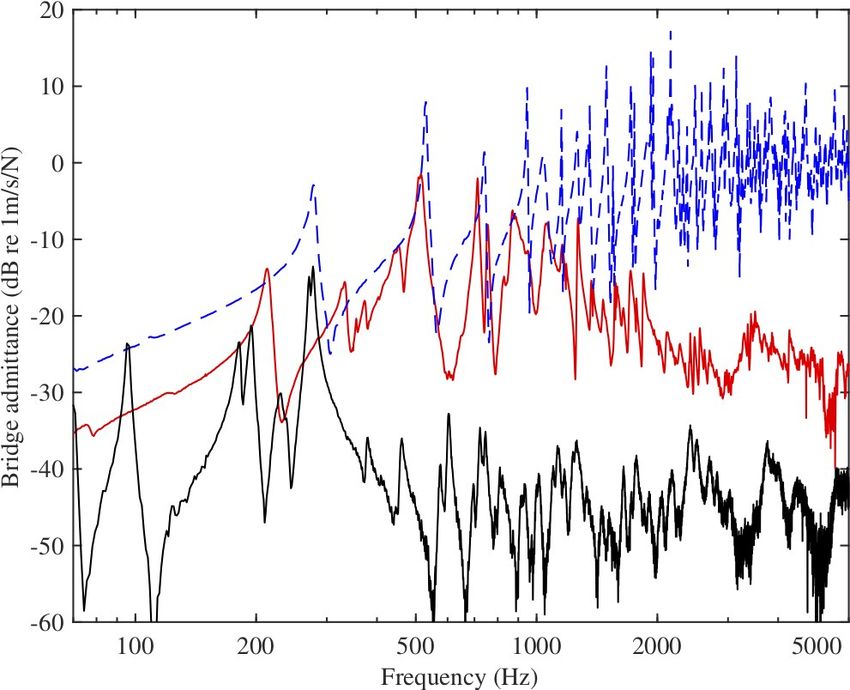
6

trends. Imagine a running average, smoothing out the curves. The guitar admittance is
essentially flat. The bare drum head curve rises. Adding strings, bridge, and tailpiece
lowers the drum head admittance for low frequencies and lowers it again at high frequencies.
This produces a broad intermediate region of strong response, which, in acoustics, is called
a “formant.”
   Ref. [1] reports an explicit calculation for a rectangular banjo with an ideal membrane
for a head, damped strings, bridge, and break angle to tailpiece. (Rectangular geometry
has long been a favorite of physicists because analytic and computer calculations are far
simpler than the corresponding ones for a circular head; they do still sound like banjos.[5])
The well-isolated lowest modes are sensitive to the geometry, but the smoothed trends are
just like in Fig. 1.
   A very general perspective, pioneered by Eugen Skudrzyk[6], predicts the smooth curves
and identifies the crucial elements. The smooth curves reflect the following observations.
The individual peaks of the actual admittance occur at frequencies for which the waves
reflected off the soundboard boundary return to the point of admittance in phase with the
initial disturbance and essentially double it. The intervening troughs occur at frequencies
for which the reflections return 180o out of phase and cancel it. The average is the same as
if there were no reflected wave coming back at all. All of the head motion is outgoing waves
initiated by the bridge motion. That is what would happen if the soundboard were infinite
in extent. So, the smooth curve is that of an infinite head — or, equivalently, any shaped
finite head with a non-reflective edge. Therefore, the smoothed curve for any size and shape
head with the same tension and density would be the same. (Calculations for an infinite
plane are even easier than for rectangles.)
   The solid red line in Fig. 2 is derived using the membrane wave equation. That equation
is simply F = ma for every tiny patch of the head. The mass of each patch is proportional to
its area. The force on each patch is the vertical (i.e., perpendicular to the head) component
of the tension of the adjoining patches. It is the same differential equation for every patch.
How a patch moves depends on what its neighbors are doing. The admittance is the motion
of the particular point where an external force is applied.
   Adding the bridge and (damped) strings changes the head equation of motion only at
the location of the bridge, i.e., where it contacts the head. The simplest approximation to a
bridge is to model it as a point mass at the location where the admittance is evaluated. So
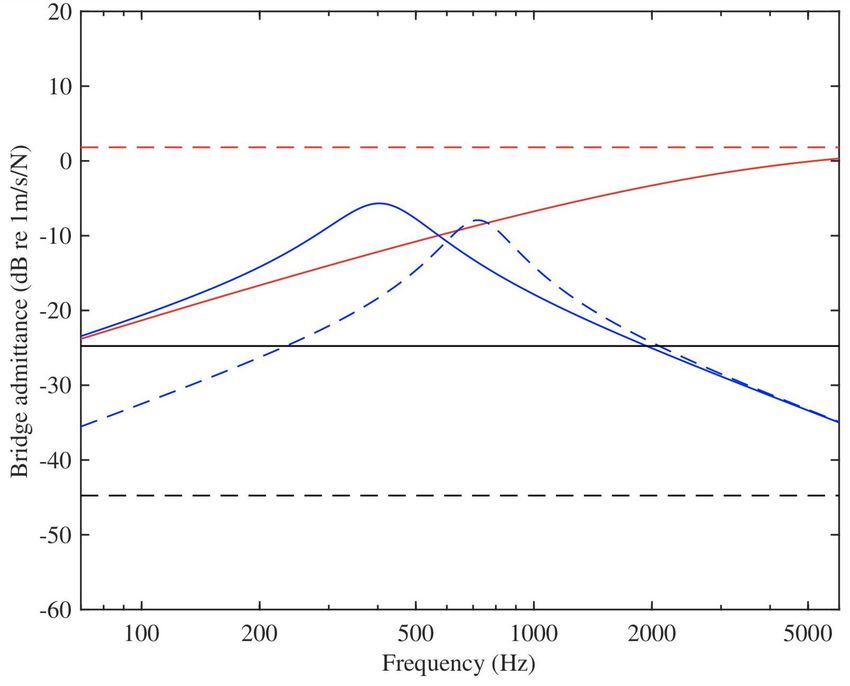
7

there is extra inertia at that point and extra forces — in addition to the applied force and
the uniform membrane wave forces.
   Even though banjo bridges are light, e.g., 2.2 gm, their mass is significant compared to
the nearby head, which might be 11 gm total for the whole 1100 D circle. An additional
mass at the point of admittance suppresses the high frequencies. Larger mass gives greater
suppression. One can say that bridge mass produces a low-pass filter, with the transition
frequency decreasing with increasing mass.
   The origin of the extra forces at the admittance point due to strings and head is a bit
more complicated. At equilibrium, those forces sum to zero. However, when the bridge
moves away from its equilibrium position, there is a net return force due to strings and head
that is in addition to what is supplied by the string and head waves. For small motions,
it is a Hooke’s Law force, i.e., linear in the displacement. It has four sources, and each is
under the builder’s and player’s control — at least to some extent. The string break angle
is non-zero to keep the strings in contact with the bridge as they vibrate. In practice, it
is typically between 5o and 15o at equilibrium. 1) The bridge motion changes the break
angle. That alters the vertical component of the string tension on the bridge. And 2) there
is also a change in the string tension — a higher tension when the bridge displacement is
positive — because the string must stretch when the bridge moves up. The increased-tension
contribution to the Hooke’s Law return force is proportional to the square of the sine of the
break angle and the stretchiness of the strings (the longitudinal consequence of the string’s
Young’s modulus). Bridge motion also produces 3) an analogous change in the break angle
of the head at the feet of the bridge (albeit less apparent to casual observation) and 4)
requires some stretching of the head, which increases its tension.
   These four effects add a springlike return force right at the admittance point, which is
in addition to the return force provided everywhere on the head by its tension. In ref. [1],
this is called the “stiffness.” Stiffness is simple to implement in the Skudrzyk calculation. It
produces a suppression of admittance for low frequencies, which is increasingly effective as
the break angle increases. Equivalently, this is a high-pass filter.
   The effects of the extra mass and return force at the bridge combine to yield a central
frequency region of largest admittance — a formant — and the center of that region reflects
the balance of the two — as illustrated in Fig. 2 by the dashed blue curve. Using realistic
parameter values, this compares well to the corresponding measurement in Fig. 1, shown in
8

red. The significant discrepancies above 3 kHz are due to the additional formants discussed
in the next section, §IV.

FIG. 2. Skrudrzyk admittance calculations — red solid: head alone; red dashed: high frequency limit of
head alone; blue solid: head with a 1.5 g bridge mass; blue dashed: head with a 1.5 gm bridge, realistic

stiffness, and a small amount of damping; black solid: wood soundboard with mass per unit area matching

the head; black dashed: wood soundboard with mass increased by a factor 10 (realistic for a thin piece of

wood).

   The same equations can be described with different words. We can consider the bridge
mass and string/head stiffness as defining a single oscillator. Its motion is very strongly
damped by the energy loss to outgoing waves in the head. Very strong damping implies a
very short decay time and a very broad width in frequency. If the damping were independent
of frequency, it would reduce the peak frequency in the admittance relative to the undamped
oscillator value. However, the rising trend of the head admittance pushes in the other
direction, leaving the total, net peak frequency shift subject to the detailed numerical values.
   This calculation identifies the physics behind simple modifications that are commonly
used to alter the sound of a particular banjo. For example, consider more mellow. Here,
“more mellow” means lowering the central frequency of this main formant. You can increase
9

the mass of the bridge. And there are several ways to decrease the stiffness. Bridge height
and tailpiece design have obvious impacts on break angle; smaller angle is more mellow.
Lower string and head tension and easier stretchiness each promote mellow.
   The bridge is held in place by “pre-tensioned” strings and head. At equilibrium, their
forces cancel. But it is sometimes said that the pre-tension enhances the communication of
string motion to the head. Indeed, the discussion above shows that higher pre-tension raises
the main formant frequency. However, this actually happens by suppressing low frequency
motion rather than enhancing the highs, as illustrated in Fig. 2.

                    IV.    FORMANTS FROM BRIDGE FLEXING

   Careful observation of the Deering Eagle II revealed two additional formants at higher
frequencies, i.e., centered around 3.5 kHz and 5 kHz. The basic admittance measurements
reported in ref. [1] were performed by tapping downward at the 1st string bridge slot. Two
further strategies revealed more about the higher formants’ origins. Tapping downward at
the 3rd string slot enhanced the 5 kHz formant, and tapping sideways on the edge of the
bridge enhanced the 3.5 kHz. In those frequency regions, finite element numerical simulations
showed dramatic bridge flexing. Note that these are not resonant motions of the bridge on
its own. Rather, the resonant motion requires a bridge flexing that fits with head motion
at the same frequency. The head motion is particularly large at the bridge feet while they
maintain contact. Fig.s 3 and 4 show the result of the numerical calculation of resonances
near 3.5 kHz and 5 kHz. (FE/BE refers to a discretization of the solid objects, i.e., “finite
element,” and a continuous fluid calculation of the surrounding air whose specific behavior
in any situation is required to match the motion of its solid boundaries, i.e., “boundary
elements.”)
   Note that these extreme bridge flexing motions are peculiar to the bridge used in the mea-
surements and numerical calculations. The bridge in question is three-foot ebony-topped
maple, standard equipment on the Deering Eagle II. Analogous effects occur at different fre-
quencies with different bridge designs, the relevant factors being flexibility and footprint.[7]
   The speed of sound in hardwood is 10 to 12 times greater than sound in air. So the
wavelengths of longitudinal waves of compression are 10 to 12 times longer. For relevant
frequencies, these are at least 20 times longer than the vertical dimension of a typical bridge.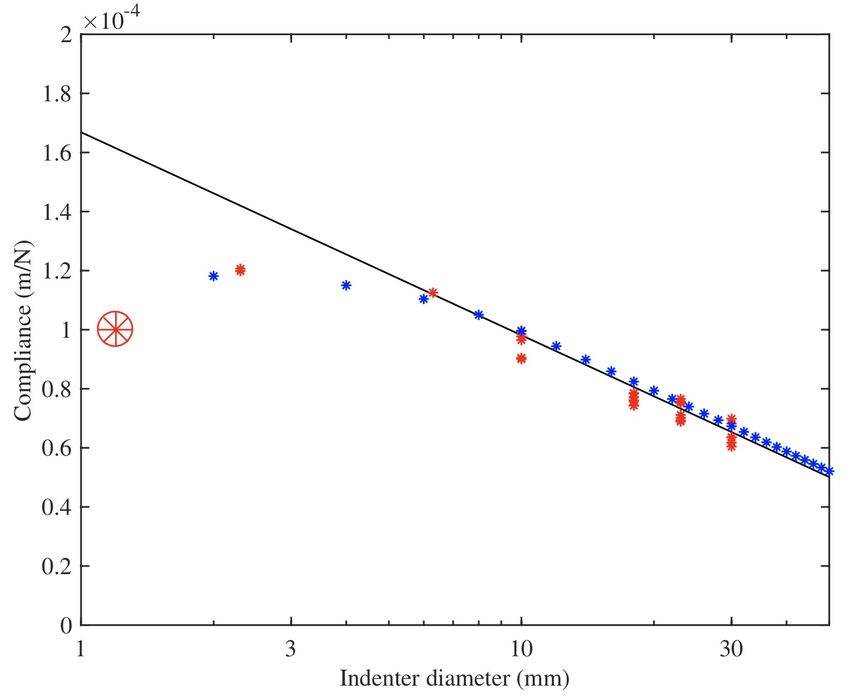
10

           FIG. 3. FE/BE calculation of resonant bridge/head motion near 3500 Hz.

           FIG. 4. FE/BE calculation of resonant bridge/head motion near 5000 Hz.

That means, in terms of sound traveling as compression waves through the wood, the bridge
moves as one, i.e., as a single, rigid piece. There is no real meaning to it taking a particular
path through the bridge. On the other hand, bridges can flex on length scales comparable
to their own geometry, and those frequencies can be much lower than those of bridge-scale
compression waves.
11
V. SOME IMPORTANT PHYSICS
A. wave speeds
Discussing sound production by a soundboard requires establishing a bit about the physics
notions of an ideal drum head and an ideal wooden soundboard.
Just as there is a physics model and equation that gives a reasonable, approximate account
of thin, taut musical strings, there are well-established physics models for the ideal drum
head, known as a “membrane,” and the typical soundboard of a wooden string instrument,
known as a “thin plate.” For the present purposes, members of the international banjo family
are instruments whose heads behave, to a first approximation, like ideal membranes.
The ideal string is a physics abstraction that does a reasonable job accounting for the
behavior of the thin strings of real musical instruments. The ideal string has a uniform
density and a uniform tension that provides the only force that pushes the string back
toward its equilibrium position when it is disturbed. Simple observations confirm that this
idealization is a very good approximation for small amplitude vibrations. One need only
note how well it works. Obvious forces that are neglected are bending stiffness and internal
friction. The long lifetime (in terms of number of cycles) of a plucked string implies that
internal friction is not a primary issue. Bending stiffness makes successive string resonances
sharper and sharper relative to the ideal. This can be observed as a small effect on solid,
thick strings. And that’s why they’re usually wound – to add mass without significant extra
stiffness.
The membrane is an ideal 2-dimensional abstraction. It has a uniform, isotropic tension
that provides the only force that pushes the membrane back toward its equilibrium position
when it is disturbed. This specification of mass and force gives rise to wave behavior that
is well-understood — although not previously explored carefully in the context of banjos.
For the present purposes, a banjo is any string instrument whose soundboard can be ap-
proximated as a membrane. In practice, that means that the tension is high enough, head
thin enough, and amplitudes small enough that tension dominates over other solid material
forces in determining transverse motion. Inherent stiffness or rigidity are ignored. The clos-
est approximation to an ideal membrane in the real world is a soap bubble film. Indeed, an
ideal membrane is actually something of a two-dimensional liquid.12
The thin plate is an idealization that is known to work well for wooden soundboards. The
restoring force is a stiffness arising from the stretch and compression inherent in bending a
solid object that is extended in two dimensions and thin in the third dimension. The resulting
wave dynamics is quite different from the membrane. Beating the general description of
deformation of an elastic solid into a convenient form for thin plates is a more complicated
story than needed for the ideal membrane. But a very useful result emerges, and it is a
standard topic in mechanical engineering education. In physics education, it typically only
appears as an advanced example, applied only to the static equilibrium deformation of a
beam under load.
The resulting wave equations imply that on a membrane, transverse plane waves all travel
at the same speed. On a plate, the speed of waves v of definite frequency f is higher for
√
higher frequencies, i.e., v ∝ f .
B. static deformation & low frequency limit
A constant small force applied at a point along a string produces a small displacement.
That is also true for a plate. However, for a membrane, the displacement is infinite for any
non-zero force applied at a point. The reason is simple. Tension T on a 2D surface is a
force per unit length. If the applied force F is spread uniformly over a disk of circumference
2πr, the resulting static deformation requires F = 2πrT × (the slope of the membrane at r).
F
Hence the slope at the edge of the radius r disk is 2πrT . That implies that the deformation
goes like log r as r → 0. Of course, bridges have finite sized feet. But one lesson is that small
bridge feet can enhance the relevance of forces that were otherwise negligible, e.g., bending
stiffness near the bridge. Measurements as a function of r and calculations for a rectangular
membrane and square footprint are shown in Fig. 5.
The relatively extreme bending of the head at the feet of the bridge has a dynamical
effect, beyond the static displacement. Very high frequency drum-head modes can impact
the low frequency motion of the bridge, even in an analysis restricted to modeling linear
forces. Here is an outline of how that comes about:
Each membrane resonant mode behaves like a forced harmonic oscillator. Each has a
resonance peak. Below its peak, the amplitude of each one approaches a finite value as the
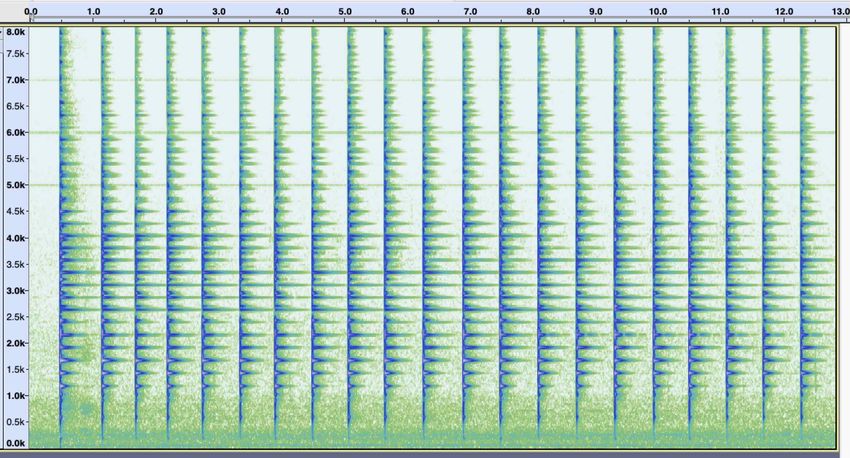
forcing frequency goes to zero. That value is its static equilibrium displacement. The full13 FIG. 5. Compliance (static displacement divided by total applied force) versus diameter of the forcing disk. Red stars: measured static compliance at the centre of the head of the Deering banjo, for different diameters of rigid indenter. (See photo on page 1.) Solid line is the prediction from ideal membrane theory. Blue stars: values deduced for a square loading region at the centre of a square membrane, with a cutoff frequency 10 kHz. Large red symbol: DC compliance deduced from the ω → 0 measured admittance using a hammer with a very small area of contact. membrane is just the sum of its modes. The dynamical admittance measurement, evaluated well below the frequency of the lowest mode is essentially the static compliance. The large red wagon wheel in Fig. 5 is an estimate of that value from admittance measurements of a real head excited by a tiny hammer. So the static compliance at the bridge is made finite by some combination of effects that are not part of the simple physics that otherwise give a first approximation to everything that goes into banjo sound production. Contributors certainly include other forces. In addition, some connection to the infinity of modes as f → ∞ may be relevant because it is the sum over all those modes that gives the naively infinite point compliance. And all these effects have significant impact on the structure of the lowest frequency modes of the finite banjo head. It is unusual in acoustics and much of physics that the lowest frequency, longest wavelength phenomena are sensitive to very short
14

distance physics. In this case, stiffness at short distances enters DC compliance because of
the sharp bending localized right at the feet of the bridge. That sharp bending also means
that short wavelength drum modes can have a significant impact on low frequency motions
— and it happens because of the underlying singular behavior of the point compliance.

   These various effects produce an extreme sensitivity of frequency and lifetime of low
frequency modes to small variations of parameters, as illustrated in §3.4 of the second
paper of ref. [1]. There, the “toy” calculation studies the lowest two modes, modeled as
damped harmonic oscillators with their own mass, spring constant, and damping, as they
are impacted by the contribution to the static compliance due to all other, higher frequency
modes. The resulting frequencies and lifetimes are shown to be very sensitive functions of
that compliance. The take-away is that the details of the lowest modes are very sensitive to
bridge physics and the static compliance.

                              C.   sound radiation efficiency

   When a surface vibrates at a given frequency, a relevant issue is the wavelength on the
surface versus the wavelength in air. If the surface wavelength is smaller than that in air,
neighboring pieces on the surface tend to cancel each other’s contribution to the sound. For
an infinite surface, the cancellation is complete. With a plate, there is a critical frequency
at which the two wavelengths match (i.e., where the wave velocities are equal). Above that
frequency, the plate waves are longer than air waves, and sound radiation is far more effective
than below it.

   For any physically reasonable banjo head, the speed common to all waves is less than
the speed of sound in air. Hence, an infinite head would not radiate sound at all. In more
practical terms, the radiation of sound is intimately connected to the finite size of the head.
This has an important, simple consequence. Radiation efficiency decreases with increasing
frequency for a given size of head. That’s because for high frequency (and shorter wave
length) the head is effectively closer to infinite as measured in units of the wavelength. This
means that the high harmonics in a single pluck sound do not die off quickly relative to the
rest. In fact, all harmonics have comparable sustain.
15
VI. BODY SOUND IN EACH PLUCK
The simplest picture of stringed instruments is that strings drive the soundboard at their
near-harmonic frequencies. For various reasons, the string amplitudes decay, and the sound
decays as well. However, a pluck involves a sudden initiation. That actually excites all
of the modes of the soundboard/body, not just the resonant frequencies of the string. On
wood-topped instruments, most of this energy goes into heat, and the soundboard/body
modes die away very quickly relative to the string modes.
Fig. 6 shows spectrograms of the same note plucked on a banjo (above) and a guitar
(below). The tall, thin lines are related directly to the string modes. The other stuff at the
bottom comes from the body modes.
Three things are different on the banjo. 1) Almost all of the energy goes into sound.
2) String and head/body mode decay times are not as dissimilar as with guitar, primarily
because the strings dump their energy into the head more readily. And 3) banjo music
generally consists of a steady stream of closely spaced notes. So, the decaying head/body
sounds survive for a significant fraction of each note. Note that four notes per second, i.e.,
spaced by 0.25 s, is not particularly fast for banjo music. Hence, head/body modes survive
for much of the time between notes.
VII. SYNTHESIZED SOUNDS FROM PHYSICAL MODELING
The sound files of ref. [2], §5.5, offer a way to listen to a generic synthesis generated by
the linear, physical modeling. You can explore how that sound changes when the various
parameter values are changed one at a time.
One important caveat is that all generated sound files give audio realizations of the
motion of the bridge and not the actual produced sound somewhere in space. This has
several advantages. It is precise and concise. Note that the bridge motion in response to
some pluck or tap reflects not only the physics of the bridge and soundboard but also that of
the strings, the surrounding air, and all their mutual interactions. Bridge motion is crucial
in translating string vibration into produced sound. And calculating the impact of changes
in various model parameters is a feasible task. In contrast, the sound at some point in space
depends on the relation of that point to the instrument and also to the space they are in, i.e.,16 FIG. 6. Spectrograms of a single pluck on the 1st string (G4 – 392 Hz) on a banjo (top) and guitar (bottom). the room and everything else in it. Furthermore, that is a calculationally intensive task that would be a practical obstacle to comparing the results for ranges of the various parameters. To get the bridge motion “sound” to be a bit closer to real instruments’ sound, all the synthesized files include a smooth, slowly varying, monotonic filter that boosts the highs slightly: ×f 0.4 for frequency f . By and large, physically motivated parameter values give a plausibly banjo-like sound. And sound variations produced by varying the parameters track changes that are commonly experienced with real banjos.
17
VIII. CONCLUSION
The essential feature of banjo is the drum head soundboard. Ref. [1] presents efforts to
understand how that works, i.e., to get a first approximation of the linear behavior of the
basic parts. Membrane physics requires that the bridge and tailpiece (through the break
angle) play essential roles and are not merely passive conveyors of string vibration to the
membrane, as is the case with the bridge and saddle on a guitar. This note sketched some
of the results and underlying physics. Many features are in stark contrast to the response
of a similarly strung guitar. The compelling details are in ref. [1]. Even a perusal of the
figures and their captions and a listen to the sound files would give a more complete picture
than was presented here. For the most part, measurements were made on only one banjo
with one bridge. But its features were successfully modeled in considerable detail. The
principle input parameters were simply the design choices of strings, head, and bridge. And
the rectangular banjo model produced a very similar basic behavior. We conclude that the
physics presented here gives a complete first approximation to banjo acoustics.
Even though ref. [1] studied only one bridge and one banjo, the comparison of measure-
ments and calculations provides a compelling picture. That offers many suggestions of how
modifications of the instrument will change the sound. For example, bridge flexing is as-
sociated with the production of high frequency formants, i.e., regions of enhanced sounds.
Hence, bridges with different flex characteristics are expected to sound different.[7]
ADDENDUM: HEAD TAP TUNING
Ref. [1] contains many observations and perspectives that did not make it into this sum-
mary. But something of possible practical interest to players concerns tap tuning the head
for tension adjustment. The ultimate tensioning advice is to adjust the tension to what
sounds best to you. But there are many reasons to use a method that involves less trial &
error. One might want a new head to sound like the previous one. Or one might aspire to
the sound of someone else’s banjo. So a common recommendation is to tap and adjust the
tension to a specified pitch. On an 1100 mylar head, bluegrass tight is G# or A. The problem
is that not everyone can clearly identify the tap pitch. Some electronic tuners will catch it,
and some won’t.
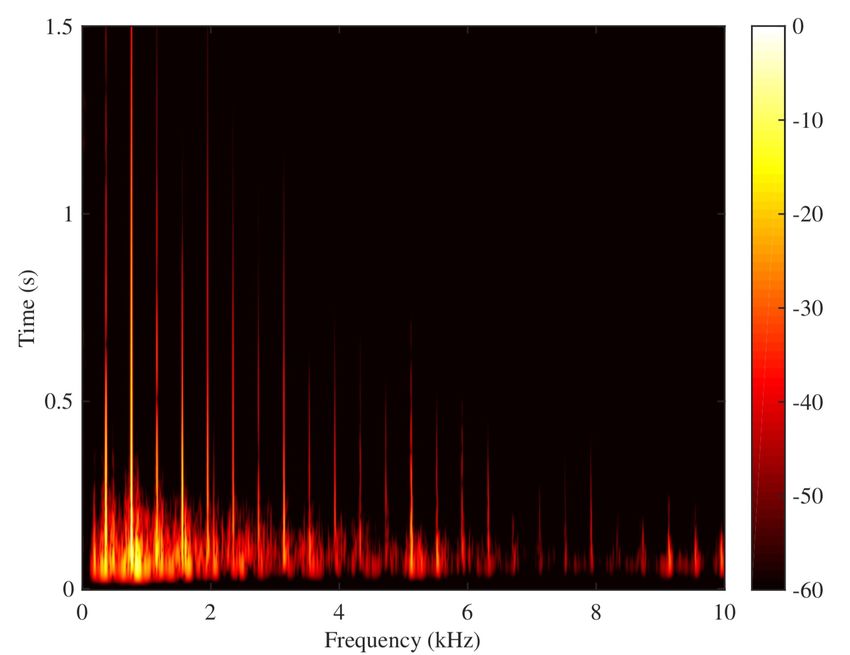
A clue was identified by author and banjo novice J.W., when he had to mount a new18 head to replace the torn original. He recognized a connection with features of the many graphs of spectra and images of modes that we generated. (E.g., consider ref. [1], second paper, Fig. 7.) For tap tuning, one is instructed to tap or scratch, with a very small area of contact, near the rim.[8] J.W. found that damping the central region of the head, e.g., by damping the bridge, enhanced the desired effect. Highly localized tapping near the edge along with damping the interior excites a motion characterized by short wavelengths along the rim and extending only one wavelength or so inward in the radial direction. These are the whispering gallery modes studied by Rayleigh[9] to account for the whispering gallery of St. Paul’s Cathedral in London. Because it’s a sharp tap or scratch near the rim, the frequency spectrum consists of many narrow peaks, going up to substantially high frequencies. However, the perceived tap pitch is not one of them. The key to understanding what’s going on is to look at the differences between successive frequency peaks. Those numbers rapidly approach a single value (asymptotic from above). Although there is no peak whose frequency is that difference value, the combination (“superposition”) of the motions represented by those peaks is approximately periodic with a frequency given by the difference. (For this to make sense, it is essential to remember that the spectrum analysis identifies sinusoidal Fourier components and not simply all motions that repeat with a fixed period.) Depending on hearing acuity, brain function, and how close the actual frequency dif- ferences are to multiples of a common factor, people tend to identify the pitch of such a complex sound as that associated with the common difference. In psychoacoustics, this is called the phenomenon of the “missing fundamental.” In some situations, hearing the missing fundamental is absolutely unambiguous. For al- most any banjo and tuning, a pluck in the lowest half-octave on the 4th string produces essentially no sinusoidal frequency component equal to the pitch. The note is heard never- theless. In fact, the timbre is not noticeably different from the slightly higher notes on that string whose frequency spectra do, indeed, include the fundamental. In the whispering gallery mode description, the difference frequency described above is the fundamental frequency of the whisper. Here is a specific example of a very tight head on a Deering Sierra, tapped at the edge with a pencil eraser, damped at the bridge, and recorded very nearby: click here or go to http://www.its.caltech.edu/~politzer/pickers-guide/whisper-1-just-one.mp3 .
19
Fig. 7 is a spectrogram of a series of such taps. The nearly equal frequency spacing (i.e.,
in the vertical direction) of intensity peaks is obvious.
FIG. 7. spectrogram of a sequence of 21 taps
Using the spectrogram, the common spacing works out to about 237 Hz, which is an A#.
Hearing-challenged author D.P. had a hard time at first to associate the tap sound with a
string pluck pitch. However, in retrospect, it’s a pretty good match. As usual, the actual
octave is ambiguous to some listeners, e.g., it could be 474 Hz.
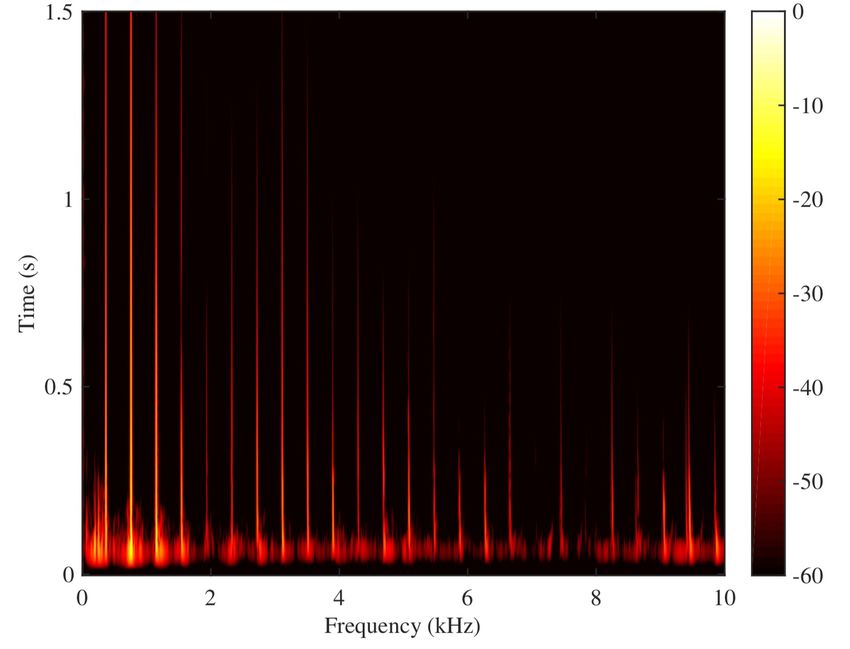
Fig. 8 gives the computed spectrum of the twenty one taps in Fig. 7. Indeed, 237 Hz or
474 Hz are nowhere to be seen.
The waveform of a single tap is shown in Fig. 9. A rough periodicity can be estimated from
from the graph by counting 29 cycles in 0.121 s. That corresponds to 240 Hz. Autocorrelation
is a well-defined mathematical calculation that can be performed on a signal. In cases of
complicated sources, the location of a single high peak of the autocorrelation generally
agrees with the brain’s attempt to identify a single pitch. Audacity’s calculation of the
autocorrelation of the tap from Fig. 9 is shown in Fig. 10. In the Audacity Frequency
Analysis Autocorrelation window, the entry called “Peak:” locates the highest peak at20
FIG. 8. spectrum of the sound of the 21 tap sequence of Fig. 7
FIG. 9. waveform of a single tap21
FIG. 10. autocorrelation of a single tap
0.0042 s, corresponding to 238 Hz (an A#3).
[1] Acoustics of the Banjo: measurements and sound synthesis & theoretical and numerical mod-
elling, J. Woodhouse, D. Politzer, and H. Mansour, Acta Acustica, 5, 15 and 16 (2021)
https://doi.org/10.1051/aacus/2021009 and https://doi.org/10.1051/aacus/2021008; included
are links to synthesized sound samples based on measurements and modeling, which are posted
at https://euphonics.org; specifically, the synthesized banjo sounds are all in §5.5; more gener-
ally, euphonics.org[2] is an extensive resource on the science of musical instruments, currently
being assembled by author J.W.
[2] https://euphonics.org.
[3] For example, subtle but discernible linear physics effects include string polarization[2] and
sympathetic coupling of harmonics between different strings, which is considerably stronger on
banjo than guitar.[4]
[4] D. Politzer, String Sing-Along (Sympathetic Vibration) Is Not the Key to Banjo Sound,22 https://www.its.caltech.edu/~politzer/turkey/turkey.pdf [5] Johnny Butten plays a rectangular banjo built by Mike Gregory: https://www.youtube.com/watch?v=1FxfZ9yZ0PY and https://www.youtube.com/watch?v=rYUoIewJpro [6] E. Skudrzyk, The mean-value method of predicting the dynamic-response of complex vibrators, Journal of the Acoustical Society of America, vol. 67, no. 4, pp. 1105 - 1135, 1980. [7] D. Politzer, High Frequency Formants from Banjo Bridge Design, HDP: 21 – 02, https://www.its.caltech.edu/~politzer/bridge-hills/bridge-hills.pdf [8] Steve Huber’s YouTube on how to tap tune a banjo head: https://www.youtube.com/watch?v=zsLxHOa4RUY [9] J. Strutt, The problem of the whispering gallery, Phil. Mag 20 1001 (1910) (Scientific Papers 5 617 (1912)) and Further applications of Bessel’s functions of high order to the Whispering Gallery and allied problems, Phil. Mag 27 100 (1914) (Scientific Papers 6 211 (1920)).
You can also read