Dynamic swimming pattern of Pseudomonas aeruginosa near a vertical wall during initial attachment stages of biofilm formation - Nature
←
→
Page content transcription
If your browser does not render page correctly, please read the page content below
www.nature.com/scientificreports
OPEN Dynamic swimming pattern
of Pseudomonas aeruginosa
near a vertical wall during initial
attachment stages of biofilm
formation
Nicole Zi‑Jia Khong1,3, Yukai Zeng2,3, Soak‑Kuan Lai1,3, Cheng‑Gee Koh1, Zhao‑Xun Liang1,
Keng‑Hwee Chiam2* & Hoi‑Yeung Li1*
Studying the swimming behaviour of bacteria in 3 dimensions (3D) allows us to understand critical
biological processes, such as biofilm formation. It is still unclear how near wall swimming behaviour
may regulate the initial attachment and biofilm formation. It is challenging to address this as
visualizing the movement of bacteria with reasonable spatial and temporal resolution in a high-
throughput manner is technically difficult. Here, we compared the near wall (vertical) swimming
behaviour of P. aeruginosa (PAO1) and its mutants ΔdipA (reduced in swarming motility and increased
in biofilm formation) and ΔfimX (deficient in twitching motility and reduced in biofilm formation)
using our new imaging technique based on light sheet microscopy. We found that P. aeruginosa
(PAO1) increases its speed and changes its swimming angle drastically when it gets closer to a wall.
In contrast, ΔdipA mutant moves toward the wall with steady speed without changing of swimming
angle. The near wall behavior of ΔdipA allows it to be more effective to interact with the wall or
wall-attached cells, thus leading to more adhesion events and a larger biofilm volume during initial
attachment when compared with PAO1. Furthermore, we found that ΔfimX has a similar near wall
swimming behavior as PAO1. However, it has a higher dispersal frequency and smaller biofilm
formation when compared with PAO1 which can be explained by its poor twitching motility. Together,
we propose that near wall swimming behavior of P. aeruginosa plays an important role in the
regulation of initial attachment and biofilm formation.
In the early stages of biofilm formation, planktonic bacteria swim close to the surface by rotating their flagella and
attach to the surface using their pili. However, little is known about the dynamics of these p rocesses1. Several P.
aeruginosa mutants have earlier been identified to be important in motility and biofilm f ormation2. The mutant
ΔdipA is found to have diminished swimming motility but enhanced initial attachment and reduced dispersal
during early biofilm formation. P. aeruginosa lacking in DipA (ΔdipA) has significantly higher c-di-GMP levels,
resulting in more efficient biofilm f ormation3. In addition to flagella-mediated motility, P. aeruginosa is able to
propagate at surfaces by type IV pili-mediated twitching motility. The type IV pili-mediated twitching motility
contributes to the initial tethering and attachment during biofilm formation4,5. Mutant PAO1 lacking in the c-di-
GMP binding protein, FimX, required for T4P assembly biofilm formation is less capable of microcolony and
biofilm formation due to deficiency in twitching m otility6. Therefore, to fully understand the complex nature of
biofilm formation, it is necessary to look into how each component of bacteria motility patterns contributes to
the entire process of biofilm development.
Numerous motility strategies have been developed by bacteria to allow them to transverse complex natural
environments and to facilitate cell–cell interactions7,8. By studying how bacteria move and analyzing their trajec-
tories, we can extract valuable information on various microbial processes, such as behavioral responses towards
chemical stimuli, signaling pathway mechanisms, as well as the behavioral signatures of different bacterial species
1
School of Biological Sciences, College of Science, Nanyang Technological University, Singapore,
Singapore. 2Bioinformatics Institute, A*STAR, Singapore, Singapore. 3These authors contributed equally: Nicole
Zi-Jia Khong, Yukai Zeng and Soak-Kuan Lai. *email: chiamkh@bii.a‑star.edu.sg; hyli@ntu.edu.sg
Scientific Reports | (2021) 11:1952 | https://doi.org/10.1038/s41598-021-81621-w 1
Vol.:(0123456789)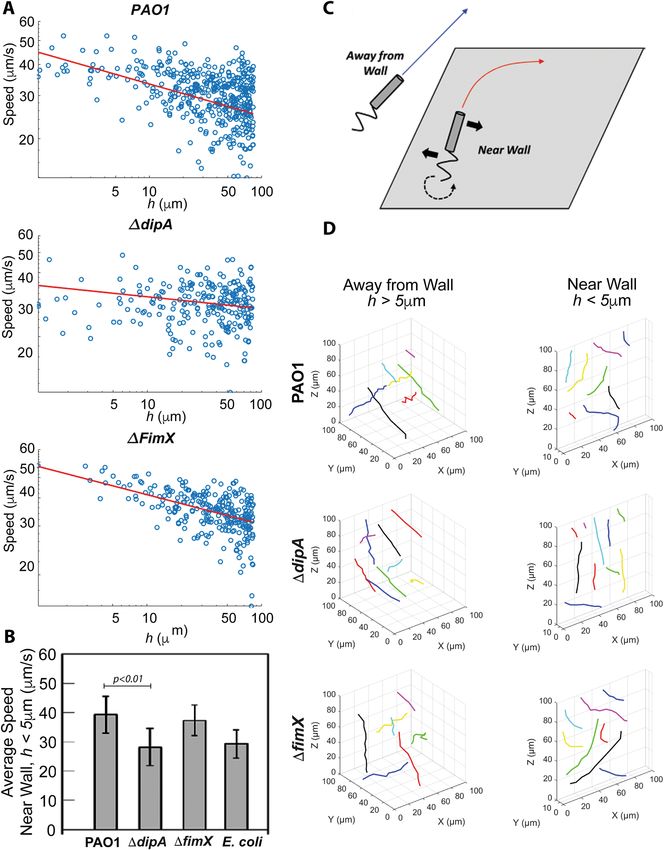
www.nature.com/scientificreports/
during initial attachment of biofilm formation. However, it is extremely challenging to visualize and track bacte-
rial movement and trajectories due to its small size and its variable dynamics, which can span a broad range from
milliseconds to m inutes9. The standard approach to examine bacterial motility is to carry out two-dimensional
(2D) imaging using optical microscopy10,11 or perform swarming assays on agar plates12. Nevertheless, as most
microbial systems are intrinsically three-dimensional (3D) in their organization, 2D approaches may lead to
misinterpretation of behavioral patterns.
Several techniques have been developed to track 3D motility behavior of bacteria. One of the earliest tech-
niques was based on the automatic motion of the scanning stage to keep an individual bacterium in f ocus13. This
technique is limited to observing one cell at a time but provided key understanding of the motility behavior of
Escherichia coli. More recent and powerful optical techniques that have been used include intensity correlation
microscopy, defocused microscopy14, stereoscopic microscopy15 and digital holographic microscopy15–17. Digital
holographic microscopy, in particular, is a preferred method to perform 3D tracking of bacteria because it is able
to capture a large depth of field and therefore providing high throughput data. However, it is often limited by the
lack of contrast of the samples (especially when using unlabeled cells) and secondary scattering of the bacteria,
which produce poor holograms due to overlapping signals when there are too many bacteria cells16. These make
resolving and tracking of individual cell difficult and more errors are generated when the concentration of the
sample is high. Although these techniques aim to image 3D motility of bacteria, they are not able to analyze
biofilm formation on vertical surfaces.
Here, we introduce a novel imaging technique that is sensitive, minimally toxic and can rapidly capture large
fields of view for 3D measurement of individual motile bacterium using the light sheet microscopy. The 3D tra-
jectories obtained do not suffer from the errors mentioned above. Furthermore, our imaging technique allows
proper visualization of bacteria behavior near a vertical wall. Biofilms commonly form on various solid surfaces,
including vertical and tilted walls, ceilings and pipes18. To our knowledge, many studies focused on biofilms
formed on air–water interface or on a horizontal s urface19. The imaging technique described in this paper takes
into consideration bacteria motility near and away from a vertical wall, representative of naturally occurring
biofilms, such as bacteria biofouling that occurs on vertical surfaces of ships. By using fluorescence-labeled cells,
we can directly visualize and track multiple individual cell trajectories and obtain information about swimming
speeds and turns. The design of our technique also allows us to capture swimming patterns of bacteria in bulk
fluid and near wall surfaces. This robust method provides the means to study the dynamics of bacterial motility
and also allows us to examine the structural architecture and microbial processes of microbial communities
on a wall. By comparing the free swimming, near wall dynamic behaviors and initial attachment on a wall of P.
aeruginosa (PAO1) and PAO mutants ΔdipA and ΔfimX, we are able to understand the correlation between near
wall behavior and initial attachment in the regulation of biofilm formation.
Results
3‑Dimensional light sheet microscopy system setup and design for tracking of multiple indi‑
vidual bacterial cell trajectories. PAO1, ΔdipA or ΔfimX were first incubated in the chamber (refer to
supplementary information for detailed construction of the incubation chamber) with ABTGC minimal medium
for 6 h to allow initial attachment. The agarose chamber was then mounted in the Zeiss Z1 light sheet microscope
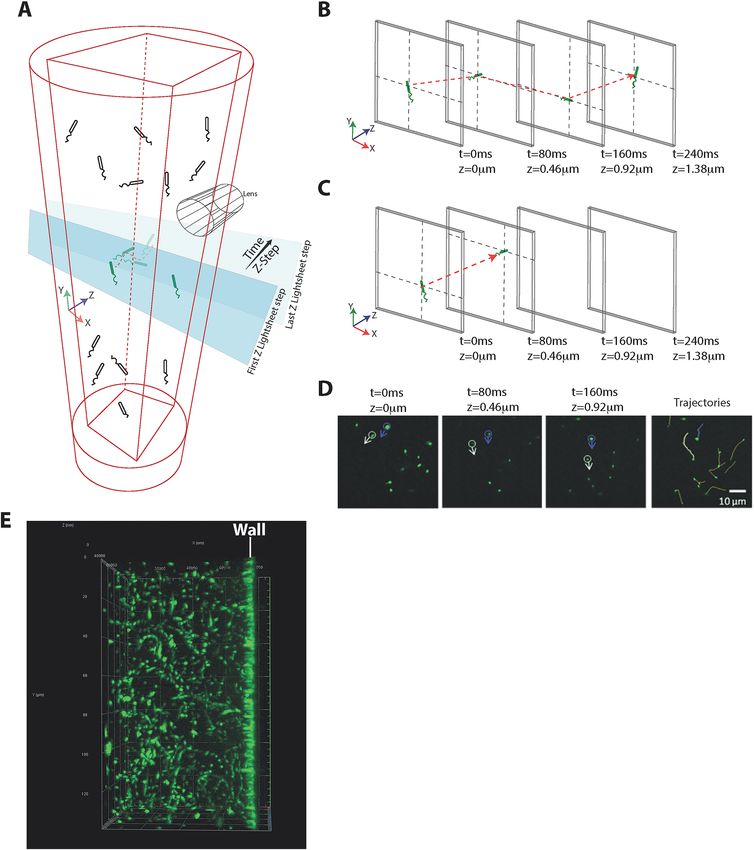
for imaging. (Fig. 1A). The 3-dimensional imaging boundary was defined within 200 z-steps along the z-axis,
and each z-step was set at 0.46 µm (total distance travel of the at z-direction is 200 × 0.46 µm = 92 µm). Light
sheet image acquisition in the z-direction was carried out continuously for 200 z-steps. Since image acquisition
in the z-direction is continuous without delay, the exposure time can then be used as time-interval between each
z-step (Fig. 1A). For instance, when the light sheet imaging acquisition began at 0 z-step, the image was recorded
as 0 µm in the z-axis and 0 ms time interval. In the next light sheet image acquisition, the sample is moved in the
z-direction at a distance of 0.46 µm in a time span of 80 ms. Therefore, the 2nd image was recorded at 0.46 µm in
z-axis and 80 ms time interval. Light sheet image acquisition in the z-direction will then continue until it reaches
the 200th z-steps (Fig. 1B). When bacterial cells moved into the same z direction as the light sheet image acqui-
sition, the x–y–z coordinates of the bacterial cells and the time information on each z-step images can be used
to reconstruct the 3D trajectories (Fig. 1D). If the bacteria turn and swim in the reverse direction during image
acquisition, the trajectory will be cut off with shorter time durations (Fig. 1C). However, owing to rotational
diffusion, the bacterial cell will typically not execute a sharp turn but will instead exhibit a “curved” trajectory
during reversal. Part of this curved trajectory that is moving forwards can still be captured and hence we can
still capture and record a reversal taking place. When all information is combined, a space–time projection can
be created, and we are able to determine the bacterial trajectories in 3D. The space–time projection and the 3D
trajectories of individual bacterial cells in a large field of view can easily be visualized by a simple 3D reconstruc-
tion algorithm (Fig. 1E). We are able to track individual bacterial cells for a duration of 15 s. In general, we can
track hundreds of cells simultaneously to obtain reliable statistics for swimming speeds and turns.
We incubated PAO1, ΔdipA and ΔfimX mutants in the ABTGC medium within the chamber described in
Fig. 1A, and light sheet imaging was carried out after 6 h of incubation. We found that, in the bulk medium
and away from walls, PAO1, ΔdipA and ΔfimX swam with an average speed of 23.9 ± 6.0 µm/s, 23.6 ± 3.9 µm/s
and 24.2 ± 5.0 µm/s, respectively (Fig. 2A,B and Table 1). These values are consistent with previously reported
values2. The average speeds were obtained by averaging the speeds of individual cells over their whole tracked
trajectories. To further validate our imaging and tracking method, we repeated the experiments with E. coli, we
found that E. coli cells swam with an average speed of 15.5 ± 3.9 µm/s (Figs. 2B, S2A and Table 1), also consistent
with previously reported v alues20.
In addition, we can also track when individual bacterial cells change their swimming directions and “turn”.
For every segment of a cell’s trajectory, we can define a turning angle, θ, as the angle between stitched line
Scientific Reports | (2021) 11:1952 | https://doi.org/10.1038/s41598-021-81621-w 2
Vol:.(1234567890)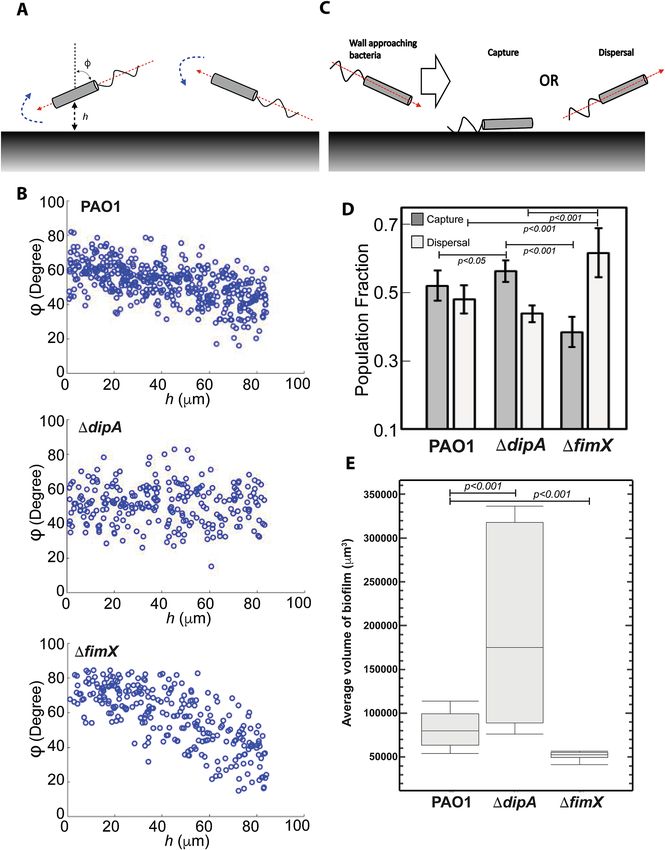
www.nature.com/scientificreports/

                                  Figure 1.  Illustration of light sheet microscopy system setup and design. (A) Fluorescence-labeled bacterial
                                  cells were loaded into custom made agarose chamber (1% agarose in ABTGC medium that supports biofilm
                                  formation). The illumination beam path is orthogonal to the detection beam path. A thin sheet of light is formed
                                  at the focal plane of the detection objective. The sample is moved in the z-direction immediately after each
                                  acquisition and 3D image of the sample is reconstructed thereafter. (B) During light sheet imaging acquisition
                                  in the z-direction, the x–y coordinates of bacterial cells in each z-step can be captured while the exposure time
                                  (i.e. 80 ms) of each z-step can be used as time intervals. (C) During light sheet image acquisition, the trajectory
                                  will be cut off with shorter time durations when bacteria turn and swim in a reverse direction. (D) Tracking of
                                  bacterial cells from the frame by frame analysis. Bacterial cells which appear as “particles” are stitched together
                                  to form trajectories using the linear assignment problem (LAP) method after segmentation utilizing the
                                  difference of Gaussians approach and filtering based on mean intensity and quality. (E) Large field of view of the
                                  3D trajectories of bacteria swimming in the agarose chamber.

Scientific Reports |   (2021) 11:1952 |                https://doi.org/10.1038/s41598-021-81621-w                                                  3

                                                                                                                                              Vol.:(0123456789)
www.nature.com/scientificreports/

                                            Figure 2.  Swimming behavior of PAO1, ΔdipA and ΔFimX. (A) Histograms of the speed of PAO1, ΔdipA and
                                            ΔfimX obtained from 323, 598, and 375 cell trajectories tracked from 5 different experiments, respectively.
                                            (B) Average speeds for PAO1, ΔdipA, ΔFimX and E. coli are 23.9 ± 6.0 µm/s, 23.6 ± 3.9 µm/s, 24.2 ± 5.0 µm/s,
                                            and 15.5 ± 3.9 µm/s, respectively. (C) Turning angles for PAO1, ΔdipA, ΔfimX and E. coli. The turning angle, θ,
                                            represents the angle between stitched line segments between two adjacent frames. It is the angle between two
                                            straight lines, e.g., θ1 is the angle through two-point locations of the same tracked particle in frames i and i + 1.
                                            (D) The distribution of turn angles θ during a swimming trajectory was quantified and analysed for PAO1 and
                                            ΔfimX and ΔdipA.

          Scientific Reports |   (2021) 11:1952 |                 https://doi.org/10.1038/s41598-021-81621-w                                                        4

Vol:.(1234567890)
www.nature.com/scientificreports/
Average speed (μm/s)
Away from wall (h > 5 μm) Near Wall (h < 5 μm) P-value (away from wall vs. near wall)
PAO1 23.9 ± 6.0 39.3 ± 6.2 p < 0.01
ΔdipA 23.6 ± 3.9 28.1 ± 6.2 p > 0.05
ΔfimX 24.2 ± 5.0 36.4 ± 5.2 p < 0.01
E. coli 15.5 ± 3.9 29.2 ± 4.9 p < 0.01
Table 1. The average swimming speed of PAO1, ΔdipA, ΔfimX and E. coli.
segments between two adjacent frames, i.e., it is the angle between two straight lines: the first drawn through
the two-point locations of the particle in frames i and i + 1, and the second drawn through the two-point loca-
tions of the particle in frames i + 1 and i + 2 (Fig. 2C). Unlike the more commonly studied “run-and-tumble”
mechanism of E. coli, where counter-clockwise (CCW) rotation of the flagella leads to forward motion and
clockwise (CW) rotation leads to tumble and hence change of direction, P. aeruginosa makes use of a different
mechanism to s wim21, where CCW rotation leads to forward motion and CW rotation leads to backward motion.
During these reversals from CCW to CW or vice versa, the flagellum typically is not rotating, in a phase which
we term “pause.” During these pauses, rotational diffusion leads to the cell adopting a new direction. We term
this mechanism “run-reverse-pause”.
For PAO1, we found that a typical trajectory comprised a series of straight tracks interspersed with sharp
turns. These sharp turns suggest that monotrichous PAO1 indeed swim in a "run-reverse-turn" mechanism,
where a run corresponds to the single helical flagellum rotating counter-clockwise and reverse to the flagellum
rotating clockwise, with the sharp turns corresponding to changes in the direction of flagellum r otation22. These
results are shown in Fig. 2D, which shows a peaked distribution in the turning angles of PAO1 for 0 ≤ θ ≤ 50°.
In contrast, the distribution of turning angles for ΔdipA shows a peak at larger angles (θ ≥ 100°), corresponding
to curved trajectories with no sharp turns. Thus, ΔdipA mutants exhibit reduced turnings, i.e., reduced flagellar
reversals. This is consistent with previous findings for dipA23. Furthermore, ΔfimX exhibited a similar turning
angle to PAO1 for 0 ≤ θ ≤ 50°. For E. coli, a broad distribution with no peaks is observed, where individual E.
coli cells exhibit “tumbles” that are distributed over a wide range of angles, consistent with the “run-and-tumble”
mode of E. coli swimming (Fig. S2B).
PAO1 and ΔfimX changes its swimming speed near a wall but not ΔdipA. The presence of a wall
can significantly modify the swimming behavior of a bacterial cell that is moving near it. Although there are
many theoretical studies on the interactions between cells and b oundaries21, there are relatively fewer reports of
experiments which quantitatively study cell swimming behavior near a wall. One plausible reason could be the
difficulty associated with imaging and tracking only those cells that are close to the wall, which will require a
three-dimensional setup. There have been several studies on three-dimensional tracking of individual bacterial
cells20,24. However, these studies were not able to track the behavior of individual cells near wall with reasonable
resolution.
Here, we focus on tracking individual cells that are swimming close to a wall. We measure quantitatively the
changes in the swimming speed, trajectories, and swimming orientation that occur for bacterial cells swimming
close to a wall.
The change in swimming speed near a wall has been addressed t heoretically25–27 and we shall not repeat the
theoretical calculations here. Briefly, we expect the swimming speed to increase as the cell swims closer to the
wall. Heuristically, this can be explained as follows. Near to a wall, the viscous drag experienced by a swimming
bacterial cell increase. However, for a rod-like bacterial cell propelled by a rotating flagellum, the component
of the drag coefficient in the direction perpendicular to the long axis of the rod increases faster than the paral-
lel direction. Hence, the swimming speed which varies with the ratio of the perpendicular drag coefficient to
parallel drag coefficient, increases. We plot the speeds of individual cells (μm/s) as a function of how far they
are from a wall (h). If we fit how the speed v varies with the perpendicular distance to the wall h with the form
v ~ h−b, we obtain the relation β = 0.13 for PAO1, 0.056 for ΔdipA and 0.26 for ΔfimX, with the R2 coefficient of
determination of 0.20 for PAO1, 0.0014 for ΔdipA, and 0.36 for ΔfimX. (Fig. 3A). This shows that the speed of
ΔdipA does not increase as it swims near to the wall. Thus, PAO1 and ΔfimX cells indeed swim faster (average
speed of 39.3 ± 6.2 μm/s and 36.4 ± 5.2 μm/s) when they are closer to the wall (h < 5 µm). However, for ΔdipA,
this trend is not present; the mutant cells do not exhibit higher swimming speed (28.1 ± 6.2 μm/s) when they are
closer to the wall (Fig. 3B and Table 1). We wish to reiterate that the swimming speed of PAO1, ΔdipA and ΔfimX
far from the wall are similar (Fig. 2A,B and Table 1). Our finding suggests that the ΔdipA mutation affects the
swimming speed only when the cells are near a wall, necessitating a technique to image and track them near a
wall such as we are describing here. Similarly, E. coli exhibit a higher speed when they are approaching the wall
(Figs. S2C, 3B, Table 1).
PAO1 and ΔfimX cells change their trajectories and orientation, but not ΔdipA cells, when
they are near a wall. For bacteria with helical flagella such as E. coli, they are known to change their tra-
jectories from straight to circular when swimming near a wall28,29. When the helical flagella rotate, they generate
a force that is perpendicular to the direction of motion and parallel to the wall. There is an equal and opposite
force acting on the cell body, which causes it to rotate in the opposite direction as the flagella. Thus, there is a net
Scientific Reports | (2021) 11:1952 | https://doi.org/10.1038/s41598-021-81621-w 5
Vol.:(0123456789)www.nature.com/scientificreports/
Scientific Reports | (2021) 11:1952 | https://doi.org/10.1038/s41598-021-81621-w 6
Vol:.(1234567890)www.nature.com/scientificreports/
◂ Figure 3. Near wall swimming behavior of PAO1, ΔdipA and ΔfimX. (A) Cell speed vs. h which is the perpendicular distance to the
wall plotted on a log–log scale. The red line is a least-squares fit to the form log v = − β log h + C, or v ~ h−β for some exponent β, where
β = 0.13 for PAO1, 0.056 for ΔdipA, 0.26 for ΔfimX. The R2 coefficient of determination for the fits are 0.20 for PAO1, 0.0014 for ΔdipA,
and 0.36 for ΔfimX. (B) The histogram shows the average speeds near the wall (h < 5 µm) for PAO1, ΔdipA and ΔfimX. (C) Illustration
of swimming trajectory of bacteria with helical flagella near a wall and away from a wall. A force perpendicular to the direction of
motion and parallel to the wall is generated when helical flagella rotate. An equal and opposite force acts on the cell body and causes it
to rotate in the opposite direction as the flagella (solid black arrows). This creates a net torque which results in the cell rotating (dashed
black arrow). (D) Three-dimensional trajectories for PAO1, ΔdipA and ΔfimX away from a wall (h > 5 µm) and near a wall (h < 5 µm).
Circular trajectories are observed near the wall of PAO1 and ΔfimX, but not away from the wall. ΔdipA shows trajectories with large
radius of curvature (i.e., effectively straight) regardless of whether it is near (h < 5 µm) or away from the wall (h > 5 µm).
torque which results in the cell rotating (dashed black arrow in Fig. 3C). The flagella of P. aeruginosa cells rotate
in both counter-clockwise (for “running”) and clockwise (for “reversing”) resulting in the cells turning both to
the right and left. 3D Trajectories of PAO1, ΔdipA and ΔfimX cells away from a wall and near a wall are shown
in Fig. 3D. For the near wall trajectories, we see that PAO1 and ΔfimX cells exhibit curves and turns, whereas the
trajectories of ΔdipA mutants exhibit larger radius of curvatures, i.e., their trajectories appear “more straight”
than those of PAO1. This is consistent with Fig. 2D, where the distribution of turning angles for ΔdipA shows a
peak at larger angles (θ ≥ 100°), corresponding to curved trajectories with no sharp turns. Thus, ΔdipA mutants
exhibit reduced turnings, i.e., reduced flagellar reversals. This could be due to the slower swimming speed and
rotation rate of the mutant c ells21. Furthermore, we also see right-handed turns only for E. coli when they moved
closer to the wall (Fig. S2D). Since the flagella of E. coli cells rotate in the counter-clockwise direction for propul-
sion, the cells constantly turn only to the right.
As a cell moves towards a wall, it will be reoriented to become parallel to the surface of the w all11. Referring
to the sketch in Fig. 4A, if a cell is moving towards a wall at an orientation φ (dashed red arrow), then there will
be a gradient in the flow field that will cause the cell to rotate until φ = 0 (dashed blue arrow). The cell trajectory
angle of approach towards the wall, φ, is obtained for each individual cell trajectory by finding the angle between
two lines: the first line is drawn through the location of the particle in the first frame and the point on the wall
closest to it, while the second line is drawn through the location of the particle in the first and last frame. As such,
φ = 0 and φ = 90° denote cells with trajectory paths running perpendicular and parallel to the wall, respectively.
In Fig. 4B, we plot the distribution of orientation φ as a function of distance h from the wall. For both PAO1 and
ΔfimX, we see that the orientation φ approaches 90° as h decreases, consistent with the expectation that the cells
reorient themselves to be parallel to the wall (Fig. 4B). Similarly, E. coli exhibit the same behaviour to reorient
themselves to be parallel to the wall (Fig. S2E). However, ΔdipA cells do not reorient themselves parallel to the
vertical wall (Fig. 4B). Nonetheless, there may still be minor repositioning of the bacteria cells due to mechani-
cal collision with a solid surface. Taken together, our observations suggest that ΔdipA cells do not increase their
speed nor reorient to become parallel to the wall as they approach a wall.
ΔdipA cells tends to form biofilms because of the intrinsic near wall swimming behavior
whereas ΔfimX cells has reduced wall attachment tendencies because of high dispersal fre‑
quency. It is important to understand how near wall behaviour could correlate to the adhesion and dispersal
events during initial attachment stages of biofilm formation. We first analysed the light sheet images by meas-
uring the population fraction of cells that adhered versus those that are dispersed, for both PAO1, ΔdipA and
ΔfimX (Fig. 4C). We consider a cell to be adhered when the average of its near-wall velocity vector is pointing
towards the wall, and dispersed when it is pointing away from the wall. We found that 52% population of PAO1,
56% population of ΔdipA and 39% population of ΔfimX were captured/adhered, respectively; and 48% popula-
tion of PAO1, 44% population of ΔdipA and 61% population of ΔfimX were undergoing dispersal, respectively
(Fig. 4D). Thus, ΔdipA showed a significant higher percentage of capture/adhesion events than PAO1 (p < 0.05)
and ΔfimX (p < 0.001), whereas ΔfimX showed a significant higher percentage of dispersal when compared with
PAO1 (p < 0.001) and ΔdipA (p < 0.001). In addition, we measured the biofilm volume (biomass) on a wall sur-
face with area of 23,267 μm2 using 3D rendering images (Imaris) to show the correlation between near wall
behavior and biofilm size. We found that ΔdipA formed a largest volume of biofilm whereas ΔfimX formed a
smaller biofilm after 6 h of incubation (Fig. 4E). These are consistent with other reports, which suggest that
ΔfimX is deficient in biofilm formation while ΔdipA demonstrated an enhanced initial attachment and lower
dispersal during biofilm formation3,6.
Discussion
The study of the spatial dynamics of bacteria is crucial to formulate solutions against microbial infections and
biofouling. It is challenging to develop an imaging system, which is fast enough to observe the spatiotemporal
activities of free-swimming bacteria with sufficient resolution. We have developed a new technique based on
light sheet microscopy to observe single bacterium swimming behavior with better precision and resolution
compared to other pseudo-3D imaging methods such as holographic particle tracking. Consequently, we are able
to accurately measure bacterial swimming velocity and trajectories that are consistent with existing theoretical
predictions and experimental data. It is known that bacterial swimming behavior is largely influenced by the
presence of solid surfaces and the swimming behavior near a wall is significantly different compared to ‘away
from wall’ regions30,31.
Pathogenic microorganisms colonize and form biofilms on various solid surfaces, causing severe environ-
mental damage and pollution18. In our light sheet microscopy imaging setup, we built a chamber that allows
Scientific Reports | (2021) 11:1952 | https://doi.org/10.1038/s41598-021-81621-w 7
Vol.:(0123456789)www.nature.com/scientificreports/
Figure 4. ΔdipA does not reorient to be parallel to the wall surface, which correlates to a higher capture frequency for better biofilm
formation. (A) Swimming bacteria reorient to be parallel to the surface of the wall. When a cell moves towards a wall at an orientation
φ (dashed red arrow), there will be a gradient in the flow field that will cause the cell to rotate until φ = 0 (dashed blue arrow). (B) The
cell trajectory angle of approach towards the wall, φ, is obtained for each individual cell trajectory. The number of PAO1 and ΔfimX
with φ ending to 0 increases as the distance to the wall h decreases. (C) Schematic of bacterial cell approaching a wall, capture and
dispersal. (D) ΔdipA showed a significant higher percentage of capture events than PAO1 (p < 0.05) and ΔfimX (p < 0.001), whereas
ΔfimX showed a significant higher percentage of dispersal when compared with PAO1 (p < 0.001) and ΔdipA (p < 0.001). (E) The
average volume of biofilm of PAO1, ΔdipA and ΔfimX.
Scientific Reports | (2021) 11:1952 | https://doi.org/10.1038/s41598-021-81621-w 8
Vol:.(1234567890)www.nature.com/scientificreports/
Strain Characteristic Source/reference
E. coli DH5α Competent cells used for molecular cloning Invitrogen
P. Aeruginosa PAO1 Wild type strain from the Washington Genome Center PAO1 mutant library 36
PA5017 transposon mutant PW9424 from the Washington Genome Center PAO1 mutant
ΔdipA 36
library
PA4959 transposon mutant PW9347 obtained from the Washington Genome Center PAO1
ΔfimX 36
mutant library
Table 2. Bacteria strains used in this study.
concurrent and clear imaging of bacteria movement near a vertical wall and in regions away from the wall
(Fig. 1A). Our method is suitable for studying the behaviour of bacteria motility on walls and tilted surfaces,
which contributes to understanding and then tackling the problem of biofouling of ships hulls and pipelines.
Using the technique described in this paper, we investigated the swimming behavior of P. aeruginosa and its
mutants that exhibit varied swimming patterns and ability of biofilm formation. We then imaged and quantified
the statistics of trajectories, speed, and orientation, which can provide valuable insights into bacterial behavior
in both ‘near wall’ and ‘away from wall’ environments. This technique is suitable for characterizing flagella-
dependent motility by comparing wild type species to mutants with defective flagella movement of other bacterial
species to understand mechanistically the function of various bacterial genes implicated in biofilm formation.
Due to the nature of the light sheet imaging plane in a singular direction in the z-axis, it is possible to miss
valuable data if the bacteria cell moves in the opposite direction of the imaging plane. We optimized our 4D
imaging technique by capturing and analysing a large sample data and comparing between WT bacteria species
and its relevant mutants. In this study, we focused on bacteria swimming bahavior near a solid vertical wall.
When bacteria such as PAO1 encounters solid surfaces, they are subjected to pure mechanical contact forces.
These mechanical forces may favour bacteria cell attachment to the surface, or they may repel themselves away
from the solid surface. The outcome of these mechanical forces at the solid–liquid interface is dependent on the
morphology of the bacteria (presence of functional flagella/presence of bacteria surface molecular structures) and
the surface properties of the solid wall (nutrient-rich/surface tension). Here, our imaging chambers fabricated
with agarose have no special nutrients that specifically attracts or repels bacteria cells, and the surface tension
of the agarose walls are kept constant in all experimental trials. Therefore, we expect that there is little external
influence from the solid surface.
Future applications of light sheet microscopy to visualize bacterial swimming dynamics are vast, especially
to naturally occurring bacterial communities. One useful application is to image the initial phases of bacterial
biofilm formation in 4D, the fourth dimension being time. To date, it remains challenging to observe the early
stages of biofilm formation in 4D due to obstacles in imaging techniques. The speed of bacterial displacement
and attachment to early biofilm layers are technically difficult to capture without using our approach. Further-
more, the use of different fluorescence labels makes it possible to image more than one population or species
of bacteria concurrently, within the same field of view. One could couple spatiotemporal analyses of bacterial
swimming with the chemotactic response to varying chemo-effectors to understand the influence of nutrients
in early biofilm formation. The first step to treating biofouling is to understand early-stage bacterial dynamics
through direct imaging of bacteria-surface interactions. Our method developed and described here is robust and
applicable to other living microbial systems. Therefore, we envisage that this technique will transform modern
3D microscopy with potentially massive practical capabilities.
Our findings suggest that PAO1 increases its speed and change its swimming angle when it gets closer to
a wall. This will result in less adhesion and more dispersal events, which eventually results in smaller biofilm
size during initial attachment. The motility behaviour of the pilus deficient FimX mutant, which is less adept in
bacterial colonization of surfaces and formation of biofilms, formed biofilms indistinguishable from those of
WT PAO1. In contrast, ΔdipA mutant moves toward the wall with steady speed without changing of swimming
angle. The near wall behavior of ΔdipA allows it to interact more effectively with the surface or other bacteria
leading to more adhesion and less dispersal events. Thus, a larger biofilm can be formed by ΔdipA during initial
attachment. It has been reported that cyclic-di-GMP regulates bacteria lifestyle and behaviour. It is known that
a high intracellular cyclic-di-GMP induces bacteria biofilm formation while low intracellular cyclic-di-GMP
promotes planktonic lifestyle and biofilm dispersal. DipA mutants were found to have elevated cyclic-di-CMP
levels that seem to be correlated with increased initial attachment during biofilm formation. Increased adhesion
events observed in ΔdipA mutant samples could be due to elevated cyclic-di-CMP levels in the mutant DipA
bacterial cell suspension upon imaging compared to WT PAO1 and the FimX m utants23.
Methods
Bacteria strains and culture. All bacteria strains used in this study is listed in Table 2 in the supplemen-
tary material. All bacteria were grown in LB broth overnight with agitation at 37 °C. Before imaging, the bacteria
were diluted to an optical density of OD600 = 1.5 and stained with Vybrant Dyecycle Green stain (Invitrogen) for
30 min under agitation.
Light sheet microscopy imaging. The light sheet microscopy imaging used in this study requires a cus-
tom-made apparatus that included a bacteria inoculation chamber and Zeiss light sheet Z.1 microscope (Carl
Zeiss). To create a bacteria inoculation chamber, 1% liquid agarose was loaded into a 1 ml syringe and the 1 ml
Scientific Reports | (2021) 11:1952 | https://doi.org/10.1038/s41598-021-81621-w 9
Vol.:(0123456789)www.nature.com/scientificreports/
syringe tip was cut and sealed with a parafilm. Next, a styrene square rod was insert onto a yellow tip holder and
then into the centre agarose cylindrical column to create a hollow chamber for bacterial inoculation. After the
agarose solidified, the styrene square rod was removed and the imaging chamber was then pushed out by the
syringe plunger to a suitable length (about half of the agarose chamber) subsequent light sheet imaging (Fig. S1).
For biofilm formation, the stained bacteria was pelleted down, resuspended in specially formulated ABT
minimal medium supplemented with 2 g of glucose per litre and 2 g of Casamino Acids per litre (ABTGC)32
and loaded into the agarose chamber. After 6 h of incubation at 37 °C, the agarose chamber was mounted onto
the Zeiss light sheet Z.1 microscope. The 3-dimensional imaging boundary was defined within 200 z-steps along
the z-axis with 0.46 µm thickness. Each z-step was recorded at an exposure time of 80 ms using a 40× water
immersion objective (N.A 1.0) and a high-speed camera (Carl Zeiss). The z-step moved to the next z-step
immediately after each acquisition without any delay (Fig. 1A). Each experiment was repeated for 60 times in
three independent experiments.
Data analysis. The trajectories of individual bacterial cells are obtained from the frame by frame analysis of
the captured images. In a single frame, individual bacterial cells appear as "particles." Automated particle track-
ing is then used to stitch together the "particles" to form trajectories. Algorithms for particle tracking have been
extensively reported. Briefly, the particles are first segmented and identified using the difference of Gaussians
approach33. They are then filtered based on mean intensity and quality. Next, the segmented particles are tracked
by linking the individual particles from each frame to the next using the linear assignment problem (LAP)
method34, with modifications to the linking cost calculations with respect to both mean intensity and quality. An
example of this tracking is shown in Fig. 1D.
Received: 7 August 2020; Accepted: 8 January 2021
References
1. Chang, C.-Y. Surface sensing for biofilm formation in Pseudomonas aeruginosa. Front. Microbiol. 8, 2671. https://doi.org/10.3389/
fmicb.2017.02671 (2017).
2. Xu, L. et al. A cyclic di-GMP-binding adaptor protein interacts with a chemotaxis methyltransferase to control flagellar motor
switching. Sci. Signal 9, ra102. https://doi.org/10.1126/scisignal.aaf7584 (2016).
3. Roy, A. B., Petrova, O. E. & Sauer, K. The phosphodiesterase DipA (PA5017) is essential for Pseudomonas aeruginosa biofilm
dispersion. J. Bacteriol. 194, 2904–2915. https://doi.org/10.1128/Jb.05346-11 (2012).
4. O’Toole, G. A. & Kolter, R. Flagellar and twitching motility are necessary for Pseudomonas aeruginosa biofilm development. Mol.
Microbiol. 30, 295–304. https://doi.org/10.1046/j.1365-2958.1998.01062.x (1998).
5. Piepenbrink, K. H. & Sundberg, E. J. Motility and adhesion through type IV pili in Gram-positive bacteria. Biochem. Soc. Trans.
44, 1659–1666. https://doi.org/10.1042/BST20160221 (2016).
6. Jain, R., Sliusarenko, O. & Kazmierczak, B. I. Interaction of the cyclic-di-GMP binding protein FimX and the Type 4 pilus assembly
ATPase promotes pilus assembly. PLoS Pathog. 13, e1006594. https://doi.org/10.1371/journal.ppat.1006594 (2017).
7. Mitchell, J. G. & Kogure, K. Bacterial motility: Links to the environment and a driving force for microbial physics. FEMS Microbiol.
Ecol. 55, 3–16. https://doi.org/10.1111/j.1574-6941.2005.00003.x (2006).
8. Persat, A. et al. The mechanical world of bacteria. Cell 161, 988–997. https://doi.org/10.1016/j.cell.2015.05.005 (2015).
9. Son, K., Brumley, D. R. & Stocker, R. Live from under the lens: Exploring microbial motility with dynamic imaging and microfluid-
ics. Nat. Rev. Microbiol. 13, 761–775. https://doi.org/10.1038/nrmicro3567 (2015).
10. Vaituzis, Z. & Doetsch, R. N. Motility tracks—Technique for quantitative study of bacterial movement. Appl. Microbiol. 17, 584–590
(1969).
11. Berke, A. P., Turner, L., Berg, H. C. & Lauga, E. Hydrodynamic attraction of swimming microorganisms by surfaces. Phys. Rev.
Lett. https://doi.org/10.1103/PhysRevLett.101.038102 (2008).
12. Morales-Soto, N. et al. Preparation, imaging, and quantification of bacterial surface motility assays. J. Vis. Exp. https://doi.
org/10.3791/52338(2015).
13. Berg, H. C. & Brown, D. A. Chemotaxis in Escherichia coli analyzed by three-dimensional tracking. Antibiot. Chemother. 1971(19),
55–78 (1974).
14. Wu, M. M., Roberts, J. W., Kim, S., Koch, D. L. & DeLisa, M. P. Collective bacterial dynamics revealed using a three-dimensional
population-scale defocused particle tracking technique. Appl. Environ. Microb. 72, 4987–4994. https: //doi.org/10.1128/Aem.00158
-06 (2006).
15. Bown, M. R., MacInnes, J. M., Allen, R. W. K. & Zimmerman, W. B. J. Three-dimensional, three-component velocity measurements
using stereoscopic micro-PIV and PTV. Meas. Sci. Technol. 17, 2175–2185. https://doi.org/10.1088/0957-0233/17/8/017 (2006).
16. Molaei, M. & Sheng, J. Imaging bacterial 3D motion using digital in-line holographic microscopy and correlation-based de-noising
algorithm. Opt. Express 22, 32119–32137. https://doi.org/10.1364/Oe.22.032119 (2014).
17. Sheng, J., Malkiel, E. & Katz, J. Digital holographic microscope for measuring three-dimensional particle distributions and motions.
Appl. Optics 45, 3893–3901. https://doi.org/10.1364/Ao.45.003893 (2006).
18. Dzianach, P. A., Dykes, G. A., Strachan, N. J. C., Forbes, K. J. & Perez-Reche, F. J. Challenges of biofilm control and utilization:
Lessons from mathematical modelling. J. R. Soc. Interface 16, 20190042. https://doi.org/10.1098/rsif.2019.0042 (2019).
19. Franklin, M. J., Chang, C., Akiyama, T. & Bothner, B. New technologies for studying biofilms. Microbiol. Spectr. https://doi.
org/10.1128/microbiolspec.MB-0016-2014 (2015).
20. Cheong, F. C. et al. Rapid, high-throughput tracking of bacterial motility in 3D via phase-contrast holographic video microscopy.
Biophys. J. 108, 1248–1256. https://doi.org/10.1016/j.bpj.2015.01.018 (2015).
21. Lauga, E. & Powers, T. R. The hydrodynamics of swimming microorganisms. Rep. Prog. Phys. 72, 096601. https://doi.
org/10.1088/0034-4885/72/9/096601 (2009).
22. Qian, C., Wong, C. C., Swarup, S. & Chiam, K. H. Bacterial tethering analysis reveals a “run-reverse-turn” mechanism for Pseu-
domonas species motility. Appl. Environ. Microbiol. 79, 4734–4743. https://doi.org/10.1128/AEM.01027-13 (2013).
23. Xin, L. et al. Regulation of flagellar motor switching by c-di-GMP phosphodiesterases in Pseudomonas aeruginosa. J. Biol. Chem.
294, 13789–13799. https://doi.org/10.1074/jbc.RA119.009009 (2019).
Scientific Reports | (2021) 11:1952 | https://doi.org/10.1038/s41598-021-81621-w 10
Vol:.(1234567890)www.nature.com/scientificreports/
24. Taute, K. M., Gude, S., Tans, S. J. & Shimizu, T. S. High-throughput 3D tracking of bacteria on a standard phase contrast microscope.
Nat. Commun. https://doi.org/10.1038/ncomms9776 (2015).
25. Brennen, C. & Winet, H. Fluid mechanics of propulsion by cilia and flagella. Annu. Rev. Fluid Mech. 9, 339–398. https://doi.
org/10.1146/annurev.fl.09.010177.002011 (1977).
26. Katz, D. F. On the propulsion of micro-organisms near solid boundaries. J. Fluid Mech. 64, 33–49. https://doi.org/10.1017/S0022
112074001984 (1974).
27. Katz, D. F., Blake, J. R. & Paveri-Fontana, S. L. On the movement of slender bodies near plane boundaries at low Reynolds number.
J. Fluid Mech. 72, 529–540. https://doi.org/10.1017/S0022112075003126 (1975).
28. DiLuzio, W. R. et al. Escherichia coli swim on the right-hand side. Nature 435, 1271–1274. https://doi.org/10.1038/nature03660
(2005).
29. Lauga, E., DiLuzio, W. R., Whitesides, G. M. & Stone, H. A. Swimming in circles: Motion of bacteria near solid boundaries. Biophys.
J. 90, 400–412. https://doi.org/10.1529/biophysj.105.069401 (2006).
30. Lee, S. J., Go, T. & Byeon, H. Three-dimensional swimming motility of microorganism in the near-wall region. Exp. Fluids https
://doi.org/10.1007/s00348-016-2113-0 (2016).
31. Raatz, M., Hintsche, M., Bahrs, M., Theves, M. & Beta, C. Swimming patterns of a polarly flagellated bacterium in environments
of increasing complexity. Eur. Phys. J. Special Top. 224, 1185–1198. https://doi.org/10.1140/epjst/e2015-02454-3 (2015).
32. Chua, S. L. et al. C-di-GMP regulates Pseudomonas aeruginosa stress response to tellurite during both planktonic and biofilm
modes of growth. Sci. Rep. 5, 10052. https://doi.org/10.1038/srep10052 (2015).
33. Lowe, D. G. Distinctive image features from scale-invariant keypoints. Int. J. Comput. Vision 60, 91–110 (2004).
34. Jaqaman, K. et al. Robust single-particle tracking in live-cell time-lapse sequences. Nat. Methods 5, 695–702. https://doi.
org/10.1038/nmeth.1237 (2008).
35. Khong, N.Z.-J. et al. High-throughput 3D tracking reveals the importance of near wall swimming and initial attachment behaviors
of P. aeruginosa for biofilm formation on a vertical wall. bioRxiv https://doi.org/10.1101/2020.05.03.075507 (2020).
36. Jacobs, M. A. et al. Comprehensive transposon mutant library of Pseudomonas aeruginosa. Proc. Natl. Acad. Sci. USA 100, 14339–
14344. https://doi.org/10.1073/pnas.2036282100 (2003).
Acknowledgements
This project is supported by Singapore Ministry of Education Academic Research Funding Tier 1 (RG44-16) and
Nanyang Technological University SUG to H.Y.L. and Tier 1 (RG138/16) to C.G.K. This manuscript has been
released as a pre-print at bioRxiv35.
Author contributions
N.Z.J.K, S.K.L., C.G.K, K.H.C. and H.Y.L. designed the study. N.Z.J.K, and S.K.L. performed all the light sheet
imaging. Y.K.Z. and K.H.C. performed image and data analysis. Z.X.L. prepared and provided all bacteria cells
for light sheet imaging. N.Z.J.K, S.K.L., Y.K.Z., C.G.K, K.H.C. and H.Y.L. wrote the manuscript. All authors read
and approved the paper.
Competing interests
The authors declare no competing interests.
Additional information
Supplementary Information The online version contains supplementary material available at https://doi.
org/10.1038/s41598-021-81621-w.
Correspondence and requests for materials should be addressed to K.-H.C. or H.-Y.L.
Reprints and permissions information is available at www.nature.com/reprints.
Publisher’s note Springer Nature remains neutral with regard to jurisdictional claims in published maps and
institutional affiliations.
Open Access This article is licensed under a Creative Commons Attribution 4.0 International
License, which permits use, sharing, adaptation, distribution and reproduction in any medium or
format, as long as you give appropriate credit to the original author(s) and the source, provide a link to the
Creative Commons licence, and indicate if changes were made. The images or other third party material in this
article are included in the article’s Creative Commons licence, unless indicated otherwise in a credit line to the
material. If material is not included in the article’s Creative Commons licence and your intended use is not
permitted by statutory regulation or exceeds the permitted use, you will need to obtain permission directly from
the copyright holder. To view a copy of this licence, visit http://creativecommons.org/licenses/by/4.0/.
© The Author(s) 2021
Scientific Reports | (2021) 11:1952 | https://doi.org/10.1038/s41598-021-81621-w 11
Vol.:(0123456789)You can also read