Socioeconomic implications of home ownership for Hong Kong
←
→
Page content transcription
If your browser does not render page correctly, please read the page content below
Socioeconomic implications of
                                     home ownership for Hong Kong
 Research                            March 2021
 Brief                               Home ownership ratio in Hong Kong fell to a 20-year low of 49.8% in
 Issue No. 2                         2019, after a nearly four-fold upsurge in flat prices in 15 years. In spite
                                     of a modest rebound to 51.2% in late 2020, it is still far below the 60%
 2020 – 2021                         mark seen in affluent economies. Home ownership has visible social
                                     benefits, such as stronger civic participation and socioeconomic stability.
                                     The share of younger persons aged below 35 heading owner-occupied
                                     families has plunged from 22.1% to 7.6% in 23 years, dampened by
                                     severe land shortage and worsening affordability. During 2009-2019,
                                     renters accounted for the largest growth in households by tenure of
                                     accommodation, contrasted against the period of 1997-2008 when
                                     owner-occupiers registered the largest corresponding growth. This has
Research Office                      knock-on implications for social mobility.
Legislative Council Secretariat
                                     Two-thirds of local home owners had fully repaid the mortgage loans in
                                     2016 and they can afford acquiring additional flats either as second
                                     homes for their children or for investment purpose. This may have
                                     implications for wealth distribution across generations.
                                     Annual average completions of private housing is targeted at only
                                     12 900 units in the next decade, fewer than the actual outturn of
                                     13 500 units during 2010-2019. Raising local home ownership ratio is
                                     likely to remain challenging in the medium to the longer term.
                                     The subject of housing and land supply fall within the policy areas of the
                                     Panel on Housing and Panel on Development respectively.

1.          Introduction

1.1        Home ownership is a multi-faceted milestone in modern society, signifying
a ticket to middle class, a landmark of upward mobility and financial protection from
life adversity. It also helps nurture a sense of belonging to community and foster
socio-political stability. Yet just half of households live in their owned homes in
Hong Kong. In the face of easing home ownership ratio from 54% to 51% after a
nearly four-fold upsurge in flat prices during 2004-2019, some commentators
observe that there are widespread frustrations in the community especially amongst
the younger generation. The Government is aware that housing is "the crux of the
many problems" and it could jeopardize "long-term prosperity and stability". 1
Many academics go further to argue that the "sense of hopelessness" created by
rocket high flat price is one of the latent causes of social instability in recent years. 2

1
     GovHK (2020).
2
     One academic study pinpoints "poverty, high housing price and high cost of living" as one of the
     10 "pre-existing fuels" before the outbreak of social incident in June 2019, whereas another one
     highlights the role of "asset ownership" in shaping political preferences of Hong Kong people. They
     also suggest that housing issues give rise to "localism" and "populism" in recent years. See
     Shek (2020), Wong and Wan (2018), Our Hong Kong Foundation (2020a) and Purbrick (2019).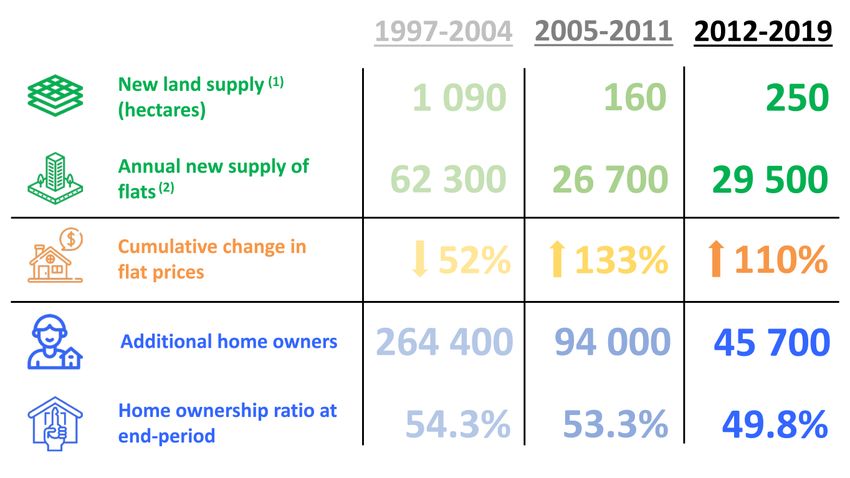
1.2       This Research Brief begins with an overview of global studies on social
benefits on home ownership, followed by an account of trend development of home
ownership ratio in Hong Kong during 1997-2019. It then discusses changing
profile of home owners and concludes with implications of owner-occupation for
Hong Kong society.

2.          Global studies on social benefits of home ownership

2.1       Home ownership means a lot to families, including intangible benefits like
physical safety, personal space and emotional stability. 3 On tangible benefits, not
only housing assets can shield families from financial adversity in life (e.g. ill health
and unemployment), they can also provide an important source of wealth
accumulation. Taking the United States ("US") as an illustration, the median net
worth of a home-owning family was US$255,000 (HK$2.0 million) in 2019, 40 times
that of only US$6,300 (HK$49 400) for renters.4 As home assets account for half
(47%) of the net worth of the former group, home ownership lies "at the heart of
American Dream" and is "a key to upward mobility" in the US. 5

2.2         Home ownership has spillover benefits to the wider community as well. 6
First, given that home purchase is one of the biggest family decisions, buyers have
stronger incentives to maintain community ties in the longer term. For instance,
US home owners mostly in private housing lived in their current homes for a median
duration of 13 years in 2018, far more than just two years for renters. 7 Secondly,
home owners are keener to maintain the neighbourhood in good order, resulting in
better security and environment.           Thirdly, reflecting their stronger civic
participation, home owners are more enthusiastic voters. In the US Presidential
Election in 2016, the voter turnout rate of home owners was 67%, much higher than
renters (49%). 8 For local mayoral election, the differential in voting likelihood was
about 20 percentage points. 9 Fourthly, a study report of the Organisation for
Economic Co-operation and Development ("OECD") points out that those places
with higher home ownership ratio tend to have more equal wealth distribution than
those with lower ratio, as home assets are the most common form of assets held by
citizens. 10

3
     Parliament of Australia (2008).
4
     Board of Governors of the Federal Reserve System (2020).
5
     White House (2001).
6
     Freddie Mac (2018) and Forbes (2016).
7
     Parliament of Australia (2008) and Rosen Consulting Group (2020).
8
     Forbes (2018).
9
     Jiang (2018).
10
     Organisation for Economic Co-operation and Development (2018).

                                                     2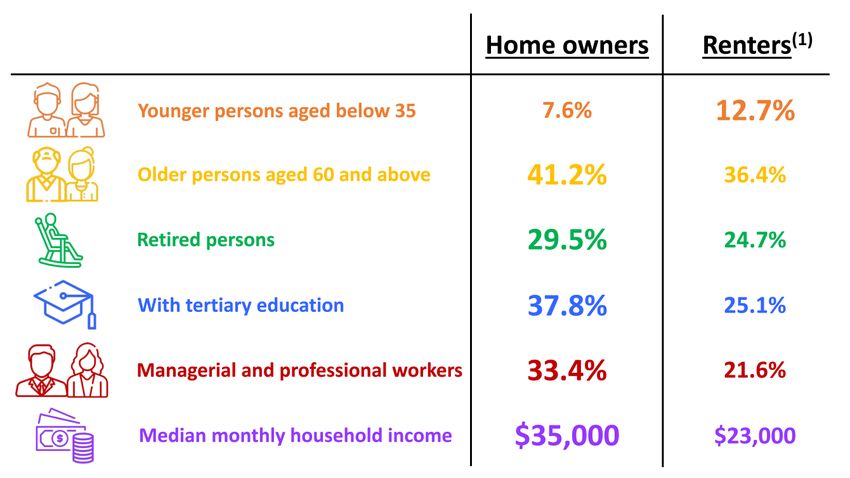
2.3      As a matter of fact, home ownership ratio stands at a high level amongst
affluent economies, generally exceeding 60% (Figure 1). These include the US
(63%) and the average value for 27 member states of the European Union (69%).
For the neighbouring economies in Asia-Pacific, the home ownership ratio also
hovers around this level, including South Korea (59%), Japan (61%), Australia (63%),
Taiwan (85%) and Singapore (90%). They are all higher than the respective ratio of
51% for Hong Kong.

Figure 1 – Home ownership ratio in selected advanced places in 2018-2020

Note: Figures are the latest available figures.
Data source: Organisation for Economic Co-operation and Development.

3.          Recent policy developments on home ownership in Hong Kong

3.1      There are two major categories of home owners in Hong Kong. 11
First and foremost are some 910 000 owner-occupiers in private permanent
housing, taking up seven-tenths of the overall home owners in 2019 (Figure 2).
The rest are 381 000 owner-occupiers in subsidised sale flats ("SSF") built on land
granted by the Government at nominal or concessionary premium and sold at
discounted prices to eligible buyers. Most (96%) of these SSF units were built by

11
     Home owners are households owning the flats they live in. On top of private permanent housing and
     SSF, there are also 11 000 owners in temporary housing, but they took up less than 1% of the total in
     2019.

                                                       3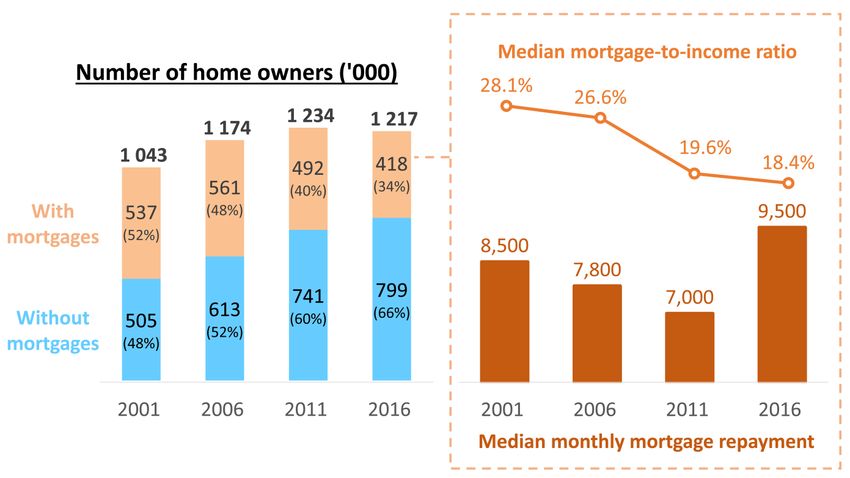
the Housing Authority ("HA"), with the rest by the Hong Kong Housing Society
("HKHS") and Urban Renewal Authority. 12 For those SSF flats freely transferable in
the secondary market upon full payment of market premium by owners, they are
re-categorized as private housing, however. 13

Figure 2 – Home owners by type of housing in Hong Kong, 1997-2019

Note: (1) "Others" includes accommodation provided by employers and rent-free accommodation.
Data source: Census and Statistics Department.

3.2        Home ownership ratio in Hong Kong displays an inverted U-shape over
the past 23 years. After an upsurge from 46.7% to a peak of 54.3% during
1997-2004, the ratio then plateaued around the 53% level till 2011, but eased back
to only 49.8% in 2019 and 51.2% in the fourth quarter of 2020 (Figure 3). As
detailed data for the full year of 2020 is not yet available, subsequent analysis is
based on data up to end-2019 only. To a considerable extent, changes in local
home ownership ratio can be attributable to a number of macroeconomic variables
(e.g. flat prices, mortgage rate and financing policy, stamp duties, household income

12
     SSF units provided by HA include flats under (a) Home Ownership Scheme ("HOS"), Private Sector
     Participation Scheme and Middle Income Housing Scheme; (b) Green Form Subsidised HOS; (c) Buy or
     Rent Option Scheme and Mortgage Subsidy Scheme; and (d) flats sold under the Tenants Purchase
     Scheme. SSF units offered by HKHS cover (a) Flat for Sale Scheme; (b) Sandwich Class Housing
     Scheme; and (c) Subsidised Sale Flats Projects.
13
     Based on HA statistics, some 78 000 SSF units have been re-classified as private housing after payment
     of market premium during 2002-2020, about one-fifth of the stock of SSF completed before 2020.

                                                     4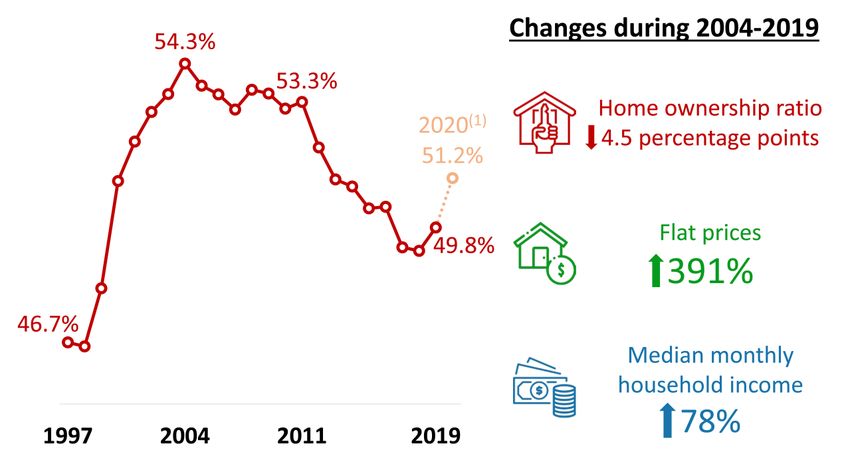
and unemployment rate) and demographic variables (e.g. marriages, divorces,
immigration, population growth and formation of new households).
As macroeconomic analysis of these determinants is well-researched and
documented elsewhere, this brief will not go into it. 14

Figure 3 – Home ownership ratio, household income and flat prices, 1997-2019

Note: (1) Figure for the fourth quarter of 2020 only, as data for the full year of 2020 is not yet available.
Data sources: Census and Statistics Department and Rating and Valuation Department.

3.3      Instead, this brief focuses on policy factors. In a nutshell, the trajectory
of local home ownership ratio during 1997-2019 can be subdivided into the
following three sub-periods, responding to changing market fundamentals and
adjustments in land and housing policies of the Government:

             (a) Rising ratio to a peak of 54.3% amidst ample supply in 2004:
                 In July 1997, the Government made significant pledges in its housing
                 policy, such as (i) increasing substantially overall flat supply to at least
                 85 000 units each year; (ii) achieving overall home ownership ratio to
                 70% by 2007; and (iii) allowing sitting tenants of selected estates of
                 public rental housing ("PRH") to buy their PRH flats upon the launch of
                 Tenant Purchase Scheme ("TPS"). 15

14
     Leung and Tang (2020), Wong and Man (2018), Jayantha and Oladinrin (2019), Hong Kong Monetary
     Authority (2017) and Legislative Council Secretariat (2013a-b).
15
     TPS was launched in 1998 with a view to promoting home ownership, allowing sitting tenants of
     184 000 flats in 39 selected PRH estates to purchase their PRH units at a discount through six phases.
     During 1998-2004, a total of 91 000 TPS flats were sold, representing three-fifths of SSF flats sold
     during the period. See Legislative Council Secretariat (2020).

                                                            5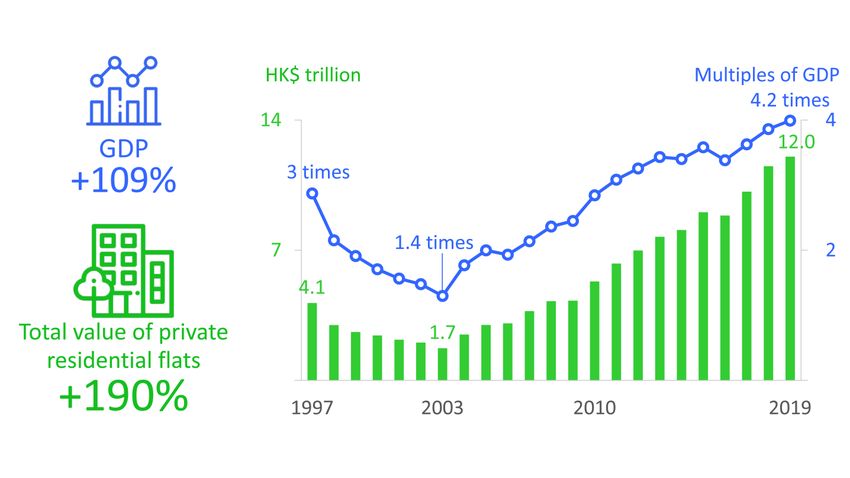
Total completions of housing flats averaged at some 62 300 units each
                 year during 1997-2004. This abundance in supply, coupled with a
                 52% plunge in flat prices triggered by the Asian Financial Crisis,
                 created a rare and golden opportunity for first-time buyers
                 to purchase owner-occupied flats.             Incremental growth of
                 264 400 home owners during 1997-2004 was evenly distributed, with
                 half in private housing and another half in SSF. Home ownership
                 ratio thus climbed to a record high of 54.3% in 2004 (Figure 4);

            (b) Plateauing around 53% amidst a hiatus in new land formation before
                2011: In an attempt to restore the imbalance in the housing market,
                the Government repositioned its housing policy in November 2002,
                tightening land and housing supply. 16 Major measures included
                (i) discarding a numerical target on home ownership; (ii) stopping land
                auctions and making supply of new land conditional on demand from
                developers till 2010; (iii) scaling back development of new land through
                reclamation and site formation; (iv) ceasing construction of SSF
                indefinitely; and (v) halting TPS. 17

                 Total housing completions thus plunged by 57% to an annual average of
                 26 700 units during 2005-2011. Propelled by economic recovery and in
                 anticipation of impending housing shortage, flat prices rebounded
                 sharply by 133% during 2005-2011. There were just 94 000 additional
                 home owners in this period, with most (91%) of them living in private
                 housing, upon cessation of TPS and SSF projects. Nevertheless, home
                 ownership ratio stayed at a high level around 53% during 2005-2011,
                 upon steady absorption of vacant flats in the earlier years; and

            (c) Falling ratio to just 50% in 2019: In the wake of public concerns, the
                Government began to shore up housing supply in 2010. Measures
                included (i) resuming HOS and sale of SSF; (ii) developing new land and
                building a land reserve; and (iii) setting up a Task Force on Land Supply
                in September 2017 to explore means to increase land supply.
                However, these measures seem to be insufficient to meet the demand,
                given a long lead time of at least 11-14 years just for planning and
                development of new land and another 3-5 years for erection of
                buildings. 18 The adverse impacts of hiatus in formation of new land
                during 2002-2011 are still felt nowadays.

16
     GovHK (2002).
17
     Development Bureau (2017).
18
     Development Bureau (2017) and Task Force on Land Supply (2018a).

                                                   6
Total housing supply averaged at just 29 500 units per annum during
2011-2019. As flat prices doubled (up by 110%) again, home
ownership ratio slid to a 20-year low of 49.8% in 2019. There were
only 45 700 new home owners in this period, with three-fifths of them
residing in private housing and the rest in SSF segment.
Figure 4 – Key housing indicators for three sub-periods during 1997-2019
Notes: (1) Sum of newly formed land and newly reclaimed land. Figures represent periods for 2000-2005,
2006-2010 and 2011-2015 respectively.
(2) Sum of average annual completions of PRH flats, SSF and private residential flats.
Data sources: Census and Statistics Department, Rating and Valuation Department and Development Bureau.
3.4 Apart from the land and housing policies, the eight rounds of tightening in
mortgage financing policy by the Hong Kong Monetary Authority ("HKMA") for
prudent risk management between October 2009 and May 2017 also created
hurdles for home buyers, especially the first-time buyers. Before policy relaxation
in October 2019, first-time buyers of small-sized flat (with an area of 40 m2 and
estimated worth of HK$6.5 million) needed HK$2.6 million for 40% down payment
in 2019, as the flat price exceeded the eligibility limit for 80%-90% mortgage lending
under the Mortgage Insurance Programme ("MIP") by then. 19 For a median
household with a monthly income of HK$28,500 managed to save half of the
19
Based on statistics of the Government, the average price for a small-sized flat across the territory was
HKS161,800/m2 in 2019. The maximum property value eligible for 80%-90% mortgage lending was
HK$4.5 million for first-time home buyers before relaxation of MIP on 16 October 2019, but it was
raised to HK$8-9 million after relaxation.
7income, it took 15 years to accumulate down payment. Even after lowering the
down payment requirement to 10% for such a flat after the relaxation of MIP in
October 2019, the same thrifty median family still needs to save four years to meet
the requirement. There is thus a shared concern in the community that "down
payment constraints restrict access to homeownership". 20
4. Changing socioeconomic profile of local home owners
4.1 Given that the local population is broadly divided into two halves in terms
of home ownership, the socioeconomic profile of home owners merits an analysis.
Using household heads as a proxy and based on tailor-made statistics compiled by
the Census and Statistics Department ("C&SD"), the following salient features are
noted (Figure 5): 21
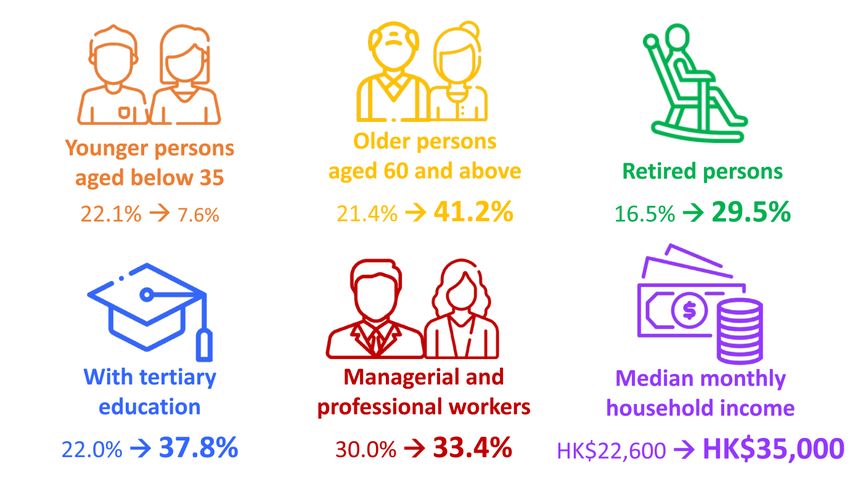
Figure 5 – Changes in the profile of heads of home-owning families, 1997-2019
Note: Figures represent the respective proportion in all household heads of owner-occupiers in Hong Kong.
Data source: Census and Statistics Department.
20
Jayantha and Oladinrin (2019).
21
As there are no dedicated statistics on flat owners in Hong Kong, this section is based on statistics on
heads of owner-occupied families compiled by C&SD. While such heads may not necessarily be the
persons owning the titles of such flats, they make major decisions of the families.
8(a) Skewed age distribution of home owners towards older persons: In
1997, younger persons aged below 35 stood a better chance to be
home owners. There were 198 100 such younger persons heading
home-owning families, accounting for 22.1% of the aggregate
owner-occupiers. However, the respective figures plunged to only
98 200 and 7.6% in 2019, dampened by worsening housing
affordability and reportedly leading to frustrations amongst the
younger generation. 22 According to another survey, the average age
of first-time home buyers was procrastinated to 44 in 2019; 23
By contrast, older persons aged 60 and above heading home-owning
families more than doubled from 192 100 to 536 000 during
1997-2019, along with a rise in their proportion in the total from
21.4% and 41.2%. While this reflects life cycle of wealth
accumulation and the ageing trend in society, it also arouses concerns
over social mobility;
(b) Retired persons holding a larger trunk of owner-occupied flats: In line
with this age profile, 29.5% or 383 900 heads of home-owning families
were retired persons in 2019, broadly doubled the corresponding
figures of 16.5% and 147 500 in 1997. For elderly households
without working income, home assets offer retirement protection.
Under the Reverse Mortgage Programme ("RMP") launched by the
Hong Kong Mortgage Corporation ("HKMC') in 2011, retired persons
aged 55 and above can mortgage the owner-occupied flats for fixed
income flows throughout the lifetime. However, it seems that very
few retired persons have made use of RMP, with fewer than
4 500 RMP applications altogether after nine years of implementation
by end-2020; 24
(c) Better-educated amongst home owners: In line with expectations,
household heads of owner-occupied flats are better-educated, with
the proportion with tertiary education standing at a high level of
37.8% in 2019, far above that of 25.1% for renters (Figure 6).
Relative to the respective figures of 22.0% and 13.5% in 1997, the gap
between these two groups of household heads has widened
moderately over the past 23 years; and
22
Shek (2020) and 新 論 壇 (2020).
23
Squarefoot.com.hk (2019).
24
Hong Kong Mortgage Corporation (2020a-b).
9Figure 6 – Characteristics of household heads of home owners and renters in 2019
Notes: (1) Statistics refers to non-home owners, predominantly renters.
(2) Figures represent the respective proportion in all home owners and non-home owners.
Data source: Census and Statistics Department.
(d) Engaging in higher-end occupations and earning higher income:
For those household heads of home owners still in workforce,
one-third (33.4%) of them were engaged in managerial and
professional occupations in 2019, much more than just one-fifth
(21.6%) amongst renters.
As such, the median monthly employment earnings of home owners
were HK$25,000 in 2019, 39% more than that of HK$18,000 for
renters. Including other income sources, the median household
income of home owners was likewise higher at HK$35,000 per month
in 2019, 52% more than that of HK$23,000 for renters.
4.2 There are public concerns over mortgage debts borne by home owners, as
the average duration of new mortgage loan contracts is lengthened to 27 years by
now. 25 Yet the latest population by-census results depict a more benign picture.
Amongst the 1.2 million home owners in 2016, two-thirds (65.7%) of them had
already paid off the mortgage debts, improving progressively from the respective
figures of 48.5% in 2001, 52.2% in 2006 and 60.1% in 2011 (Figure 7). 26 While
annual average rise in family income by 2.5% may enable economically active
25
Hong Kong Monetary Authority (2021).
26
Census and Statistics Department (2021).
10households to pay off the mortgage debt earlier, it appears that the 391% escalation
in flat prices in just 15 years should also give home owners much financial leeway on
how and when to settle mortgage debts. 27
Figure 7 – Key indicators on mortgage debt of owner-occupiers, 2001-2016
Data source: Census and Statistics Department.
4.3 For the rest of one-third of flat owners still bearing mortgage loans, the
median value of monthly mortgage repayment was HK$9,500 in 2016, representing
18.4% of their median monthly household income, down from 28.1% in 2001.
In face of soaring flat prices, new home owners generally need a longer repayment
period in their mortgage agreements, with the median duration of outstanding
mortgage repayment lengthening from 11 years in 2006 to 12 years in 2011, and
further to 15 years in 2016. 28
4.4 Analyzed by income distribution, those households with the least monthly
income of HK$4,000 or below registered the highest home ownership ratio, at 69%
in 2019 (Figure 8). This may come as a surprise to many readers, but it echoes the
aforementioned findings that two-fifths of owner-occupiers are actually headed by
older persons aged 60 and above. Families with highest monthly income of at least
HK$50,000 came next, with such a ratio generally exceeding 60%. For other
27
信 報 月 刊 (2020).
28
Census and Statistics Department (2021).
11income groups lying between these two extremes, the ratio tends to vary
positively with income, within a range of 30% for those with monthly income of
HK$4,000-HK$10,000 and 52% for those with HK$30,000-HK$50,000.
Figure 8 – Distribution of home owners by monthly household income in 2019
Data source: Census and Statistics Department.
5. Socioeconomic implications for Hong Kong
5.1 In the light of continued buoyancy in the housing market, owner-occupied
flats have become an important source of wealth for better-off families. Based on
the statistics of the Rating and Valuation Department ("R&VD"), it is crudely
estimated that the market value of private residential properties in Hong Kong has
tripled to around HK$12 trillion during 1997-2019, outpacing the 109% growth in
Gross Domestic Product ("GDP") (Figure 9). In 2019, overall private residential
properties in Hong Kong were worth about four times of GDP, much higher than the
respective figure of 1.6 times in the US. 29 The wealth effect arising from changes in
flat prices in turn could have significant implications for local consumption and GDP.
29
The total value of residential properties in the US was estimated at US$33.6 trillion (HK$263.2 trillion)
in 2019, equivalent to 157% of its GDP. See Zillow (2019) and Hong Kong Monetary Authority (2001).
12Figure 9 – Estimated value(1) of private residential flats in Hong Kong, 1997-2019
Note: (1) Figures refer to gross market value, regardless of the value of outstanding mortgage debts.
Data source: Rating and Valuation Department.
5.2 The aforementioned socioeconomic profile of local home owners gives rise
to the following implications for the Hong Kong society:
(a) Home owners in good financial shape: Two-thirds of home owners
have repaid the mortgage loans with strong balance sheets. This is in
stark contrast to the bleak situation in mid-2003, with 106 000 mortgage
loans (22% of the total) suffering from negative equity problem
(i.e. the outstanding value of a mortgage loan higher than the market
price of a flat). 30
On the back of sizable capital gains, many existing home owners can
afford acquiring additional flats, either as second homes (e.g. for their
relatives) or for investment (e.g. leasing out for rental income).
According to a recent survey conducted by a property agency, 26% of
respondents indicating an interest to buy residential flats in 2021 are
investors;31
30
Hong Kong Monetary Authority (2004).
31
While 40% of prospective flat purchasers in the same survey are existing home owners for changing
flats, 34% are first-time buyers. See 明 報 (2020).
13(b) Substantial growth in households living in rental flats in recent years:
There is a big contrast in the landscape of tenure of accommodation
for households over the past 23 years, taking into account effects of
(i) tenure of newly formed households; and (ii) changed tenure status
of existing households. For the earlier period between 1997 and
2008, the stock of households increased by a total of 354 100
(Figure 10). During this period, owner-occupiers went up
substantially by 336 700, while renters grew by just 47 200. As
discussed earlier, abundant supply and affordable flat prices should be
key contributory factors.
For the recent period during 2009-2019, the number of households
grew by 335 000, while owner-occupiers increased by just 80 200. On
the other hand, households renting flats either in public or private
housing surged by 250 200 (including 92 700 subdivided flats with
poorer living conditions); 32
Figure 10 – Net change in households by tenure of accommodation, 1997-2019
Note: (1) "Others" includes accommodation provided by employers or rent-free, as well as temporary housing.
Data source: Census and Statistics Department.
32
Census and Statistics Department (2018).
14(c) Equity concerns on wealth distribution: Income distribution in
Hong Kong in terms of Gini coefficient has widened to 0.539 in 2016,
amongst the highest in the world. However, a recent study shows
that wealth distribution could be much more uneven than income
distribution. Taking OECD as an illustration, while the top 10% of the
income distribution can get hold of 24% of total income only, "the
wealthiest 10% of households" holds "52% of total net wealth".33
While there is no such wealth data in Hong Kong, it can be expected
that the situation should be broadly similar to these advanced places.
A recent survey shows that four-fifths of the assets of local affluent
people (with net worth over HK$10 million) are held in the form of
properties. 34 A local economist also points out that the wealth of flat
owners in Hong Kong is about 30 times that of renters, broadly
comparable to the US figure discussed in Section 2; 35
The widening gap between "haves" and "have-nots" can also be seen
in Figure 10 above, as net changes in the ownership titles of
residential flats during 2009-2019 were mostly acquired by investors
or landlords for leasing to tenants, not for owner-occupation. While
the average tenant households may also save hard to buy flats, they
could easily be priced out from the market with just working income;
(d) Slowing social mobility across generations: There are also growing
concerns that the aforementioned inequality in wealth distribution
may carry forward to the next generation. A couple of surveys show
that local parents are inclined to financially support their children to
buy flats. For instance, HA indicated that 22% of SSF buyers had
parental support in paying down payment in 2017. 36 Another survey
showed that some 70% of local parents were willing to assist their
children to buy a home, with half of them even prepared to
remortgage their own homes for the purpose. 37 As such parental
support from owner-occupiers tend to be greater than renters, there
33
Organisation for Economic Co-operation and Development (2018).
34
According to an annual survey conducted by a commercial bank, there were some 504 000 Hong Kong
people (8.4% of local population) with net worth over HK$10 million in May 2020. Four-fifths (78%) of
the wealth was held in the form of properties, and a majority of which are presumably owner-occupied
flats. For the rest of 22% of wealth, it was held mostly in the form of cash, deposits, stocks and bonds.
See Citibank (2020) and Credit Suisse (2020).
35
信 報 月 刊 (2020).
36
Housing Authority (2018).
37
AIA (2017) and 明 報 (2020).
15are concerns over implications of such wealth transfer for social
mobility across generations over time; 38 and
(e) Retirement protection for asset-owning retirees: As discussed above,
536 000 older persons aged 60 and above live in owner-occupied flats,
yet their financial situation seems to be not as good as expected.
Based on the latest Poverty Report, 112 000 of the asset-owning
elderly lived below the poverty line in 2019 (equivalent to one-fifth of
older persons living in owner-occupied flats), with the median value of
their homes estimated at HK$5.2 million. There are different views
on the financial situation of these owner-occupied retirees. While
the Government regards this as a limitation of the "analytical
framework of the poverty line", some commentators take this as
inadequate retirement protection. 39
6. Outlook for the medium to longer term
6.1 A recent study released at end-2020 reiterates the difficulties faced by
fresh university graduates in owner-occupation. 40 To assist the younger generation
to become first-time home owners, there is strong advocacy in the community to
increase land and housing supply. As seen in the aforementioned episode during
1997-2004, home ownership can expand noticeably when flat prices come down to
more affordable levels on the back of more ample supply of new housing coming on
stream.
6.2 Looking forward, it is still challenging to raise the home ownership ratio in
the medium to longer term. In the latest progress report of the Long Term Housing
Strategy published in December 2020, the average annual production target for
private housing will remain tight at 12 900 units in the next decade till 2030-2031,
after revision of the split ratio between public/private housing from 60:40 to 70:30
in 2018. It is even fewer than the actual outturn of about 13 500 units recorded in
the last decade (Figure 11). Although annual production target for SSF will be
raised from 2 100 units to 9 100 units in the next decade, overall housing supply for
sale is still considered to be too few, compared to the strong housing demand.
38
Organisation for Economic Co-operation and Development (2019).
39
These elderly people are classified as "income-poor, owning property of certain value" in the report.
See Office of the Government Economist (2020) and 香 港 01 (2019).
40
新 論 壇 (2020).
16Figure 11 – Average annual supply of flats during 2010-2019 and LTHS target till 2030
Note: (1) Including Green Form HOS flats.
Data sources: Transport and Housing Bureau and Census and Statistics Department.
6.3 In December 2018, the Task Force on Land Supply recommended eight
supply-side solutions to address the severe land shortage problem in Hong Kong.
They included (a) expediting brownfield development; (b) developing private
agricultural land; (c) assigning part of the Fanling Golf Course for housing
development; and (d) expediting studies on reclamation of some 1 000 hectares of
land in the longer term under the Lantau Tomorrow Vision ("LTV"). 41 The
Government takes on board all recommendations and the Chief Executive also
reports progress in her Policy Address in 2020. 42 On 4 December 2020, the Finance
Committee approved a funding request of HK$550 million to conduct feasibility
studies over artificial islands under the Lantau Tomorrow Vision. Home ownership
will only improve significantly over time when such supply-side solutions bear fruit.
41
Task force on Land Supply (2018b).
42
GovHK (2020).
177. Observations
7.1 The following observations can be made from the above analysis:
(a) Home ownership ratio falling to 51.2% in Hong Kong: Local home
ownership ratio fell from a peak of 54.3% in 2004 to a 20-year low of
49.8% in 2019, dampened by the 391% upsurge in flat prices in
15 years as well as a hiatus of formation of new land before 2011.
In spite of a modest rebound to 51.2% in late 2020, this is far below
the 60% mark seen in affluent economies;
(b) Social benefits of home ownership: Home ownership means a lot to
families (e.g. physical safety, personal space, emotional stability,
upward social mobility and wealth accumulation). It also has
significant spillover benefits to the wider community in terms of sense
of belonging, civic awareness, voting propensity and equity in wealth
distribution. It is thus a multi-faceted milestone in modern society;
(c) Younger persons finding it difficult to become home owners: Younger
persons aged below 35 used to account for 22.1% of overall heads of
home-owning families in 1997, but they plummeted by two-thirds to
only 7.6% in 2019. They are priced out from the market, as their
working income lags far behind the escalation in asset prices.
Reportedly, worsening housing affordability has led to frustrations in
the younger generation;
(d) 110 000 home-owning elderly living below poverty line: About 41%
of household heads of home owners were older persons aged 60 and
above in 2019, doubled the corresponding figure of 21% in 1997.
However, the latest Poverty Report shows that some 112 000
asset-owning elderly families lived below the poverty line in 2019,
whereas there was just a stock of 4 500 applications for reverse
mortgage by end-2020. While the Government sees this as a
limitation of the "analytical framework of the poverty line", others
take this as inadequate retirement protection;
(e) Two-thirds of home owners having paid off the mortgage loans: Local
home owners are in sound financial position, with 66% fully repaid the
mortgage loans in 2016, in stark contrast to the bleak situation in
mid-2003 when 22% of overall mortgage loans suffered from negative
equity. These financially sound home owners can have much
18stronger purchasing power to acquire additional flats, either as second
homes for their children or for leasing out to earn rental income.
This in turn would have implications for wealth distribution across
generations;
(f) Substantial growth in households living in rental flats in recent years:
The landscape of accommodation tenure distribution of households
has changed significantly. While owner-occupiers accounted for
largest growth in household number during 1997-2008, renters in
either public or private housing (including sub-divided flats) registered
the largest corresponding growth during 2009-2019; and
(g) Challenging outlook on home ownership: In the latest progress report
of the Long Term Housing Strategy published in December 2020, the
average annual production target for private housing will remain tight
at 12 900 units in the next decade till 2030-2031, fewer than the
actual outturn of about 13 500 units during 2010-2019. In spite of
larger target supply of SSF, raising home ownership ratio to a higher
level is likely to remain challenging in the medium to longer term.
Research Office
Information Services Division
Legislative Council Secretariat
1 March 2021
Tel: 2871 2125
------------------------------------------------------------------------------------------------------------------------------------------------------------------------------
Research Briefs are compiled for Members and Committees of the Legislative Council. They are not legal or other professional
advice and shall not be relied on as such. Research Briefs are subject to copyright owned by the Legislative Council Commission
(The Commission). The Commission permits accurate reproduction of Research Briefs for non-commercial use in a manner not
adversely affecting the Legislative Council. Please refer to the Disclaimer and Copyright Notice on the Legislative Council
website at www.legco.gov.hk for details. The paper number of this issue of Research Brief is RB02/20-21.
19References
Hong Kong
1. AIA. (2017) Survey Reveals Three Trends Hindering Retirement Planning of
Hong Kong People. Available from: https://www.aia.com.hk/content/dam/hk/en
/pdf/press-release/2017/aia-press-release-20171109-eng.pdf [Accessed
March 2021].
2. Census and Statistics Department. (2018) Housing conditions of sub-divided
units in Hong Kong. Available from: https://www.statistics.gov.hk/pub/B113026
02016XXXXB0100.pdf [Accessed March 2021].
3. Census and Statistics Department. (2021) 2016 Population By-census - Main
Tables (Housing). Available from: https://www.censtatd.gov.hk/hkstat/sub/sp45
9.jsp?productCode=B112160E [Accessed March 2021].
4. Citibank. (2020) Citibank Announces Results of "Hong Kong Affluent Study
2019/2020". Available from: https://www.citibank.com.hk/english/info/pdf/Citi
bank_Announces_Results_of_Hong_Kong_Affluent_Study_2019-2020_Eng_final
.pdf [Accessed March 2021].
5. Development Bureau. (2017) Overview of Land Supply.
Available from: https://www.legco.gov.hk/yr16-17/english/panels/dev/papers/d
ev20170124cb1-461-1-e.pdf [Accessed March 2021].
6. GovHK. (2002) Statement by Secretary for Housing, Planning and Lands on
Housing Policy. Available from: https://www.info.gov.hk/gia/general/200211/13
/1113244.htm [Accessed March 2021].
7. GovHK. (2011) CE unveils new housing measures in Policy Address.
Available from: https://www.info.gov.hk/gia/general/201110/12/P20111012018
3.htm [Accessed March 2021].
8. GovHK. (2020) The Chief Executive's 2020 Policy Address.
Available from: https://www.policyaddress.gov.hk/2020/eng/policy.html
[Accessed March 2021].
9. Hong Kong Monetary Authority. (2001) The property market and the
macro-economy. Available from: https://www.hkma.gov.hk/media/eng/publicatio
n-and-research/quarterly-bulletin/qb200105/fa02.pdf [Accessed March 2021].
2010. Hong Kong Monetary Authority. (2004) An introduction to the Hong Kong
Monetary Authority (2004 Edition). Available from: https://www.hkma.gov.hk/m
edia/eng/publication-and-research/annual-report/2003/Summary.pdf
[Accessed March 2021].
11. Hong Kong Monetary Authority. (2017) Estimating the drivers of Hong Kong's
housing price – Short-run dynamics. Available from: https://www.hkma.gov.hk/
media/eng/publication-and-research/research/research-memorandums/2017/R
M03-2017.pdf [Accessed March 2021].
12. Hong Kong Monetary Authority. (2019) Mortgage Insurance Programme
(effective from 16 October 2019). Available from: https://www.hkma.gov.hk/me
dia/eng/doc/key-information/press-release/2019/20191016e3a1.pdf [Accessed
March 2021].
13. Hong Kong Monetary Authority. (2021) Monthly Statistical Bulletin.
Available from: https://www.hkma.gov.hk/eng/data-publications-and-research/
data-and-statistics/monthly-statistical-bulletin/ [Accessed March 2021].
14. Hong Kong Mortgage Corporation. (2020a) Mortgage Insurance Programme.
Available from: http://www.hkmc.com.hk/eng/our_business/mortgage_insuran
ce_programme.html [Accessed March 2021].
15. Hong Kong Mortgage Corporation. (2020b) Reverse Mortgage Programme
Statistics. Available from: http://www.hkmc.com.hk/eng/information_centre/stat
istics/reverse_mortgage_programme_statistics.html [Accessed March 2021].
16. Housing Authority. (2018) Major findings of the Survey on Applicants of the Sale
of Home Ownership Scheme Flats 2017. Available from:
https://www.housingauthority.gov.hk/en/common/pdf/about-us/housing-autho
rity/ha-paper-library/SHC69-18EN.pdf [Accessed March 2021].
17. Jayantha, W.M. and Oladinrin, O. (2020) An analysis of factors affecting
homeownership: a survey of Hong Kong households.
Available from: https://www.researchgate.net/publication/337930699_An_analy
sis_of_factors_affecting_homeownership_a_survey_of_Hong_Kong_households
[Accessed March 2021].
18. Legislative Council Secretariat. (2013a) Land supply in Hong Kong.
LC Paper No. IN21/12-13. Available from: https://www.legco.gov.hk/yr12-13/engli
sh/sec/library/1213in21-e.pdf [Accessed March 2021].
2119. Legislative Council Secretariat. (2013b) Long Term Housing Strategy. LC Paper No.
IN27/12-13. Available from: https://www.legco.gov.hk/yr12-13/english/sec/librar
y/1213in27-e.pdf [Accessed March 2021].
20. Legislative Council Secretariat. (2020) Tenant purchase schemes in
selected places. LC Paper No. IN06/19-20. Available from:
https://www.legco.gov.hk/research-publications/english/1920in06-tenants-purc
hase-schemes-in-selected-places-20200316-e.pdf [Accessed March 2021].
21. Leung, C. and Tang, E. (2020) Availability, Affordability and Volatility:
The Case of Hong Kong Housing Market. Available from:
https://www.researchgate.net/publication/314477634_Availability_Affordabilit
y_and_Volatility_The_Case_of_Hong_Kong_Housing_Market [Accessed
March 2021].
22. Office of the Government Economist. (2020) Hong Kong Poverty Situation
Report 2019. Available from: https://www.statistics.gov.hk/pub/B9XX0005E201
9AN19E0100.pdf [Accessed March 2021].
23. Our Hong Kong Foundation. (2020a) Cutting Red Tape to Catch Up with
Shortfalls in Land and Housing Supply. Available from:
https://ourhkfoundation.org.hk/sites/default/files/media/pdf/LH_Research_Rep
ort_2020_Eng.pdf [Accessed March 2021].
24. Our Hong Kong Foundation. (2020b) Webinar with Professor Richard Wong -
Livelihoods, Public Sentiment, and Populism. Available from:
https://www.ourhkfoundation.org.hk/en/event/1641/insight-forum/webinar-pr
ofessor-richard-wong [Accessed March 2021].
25. Purbrick, M. (2019) A Report of the 2019 Hong Kong Protests. Asian Affairs,
50 (4), pp. 465-487. Available from: https://www.tandfonline.com/doi/pdf/10.1
080/03068374.2019.1672397?needAccess=true [Accessed March 2021].
26. Shek, D. (2020) Protests in Hong Kong (2019–2020): A Perspective Based on
Quality of Life and Well-Being. Available from: https://link.springer.com/article/
10.1007/s11482-020-09825-2 [Accessed March 2021].
27. Rating and Valuation Department. (2021) Property Market Statistics.
Available from: https://www.rvd.gov.hk/en/property_market_statistics/index.ht
ml [Accessed March 2021].
2228. Task Force on Land Supply. (2018a) How to Tackle Land Shortage?
Available from: https://www.devb.gov.hk/filemanager/en/content_1051/Land_
Supply_En_Booklet.pdf [Accessed March 2021].
29. Task Force on Land Supply. (2018b) Report of the Task Force on Land Supply:
Striving for Multi-pronged Land Supply. Available from:
https://www.devb.gov.hk/filemanager/en/content_1171/Report%20(Eng).pdf
[Accessed March 2021].
30. Transport and Housing Bureau. (2020) Long Term Housing Strategy
Annual Progress Report 2020. Available from:
https://www.thb.gov.hk/eng/policy/housing/policy/lths/LTHS_Annual_Progress
_Report_2020.pdf [Accessed March 2021].
31. Wong, R. (2017) Housing Policy Reform to Narrow Wealth Gap. Our Hong Kong
Foundation. Available from: https://www.ourhkfoundation.org.hk/sites/default/
files/media/pdf/ohkf_land_and_housing_2017_en_17102017.pdf [Accessed
March 2021].
32. Wong, S. and Wan, K. M. (2018) The Housing Boom and the Rise of Localism in
Hong Kong: Evidence from the Legislative Council Election in 2016.
China Perspectives. October, 2018 (3), pp. 31-40.
Available from: https://journals.openedition.org/chinaperspectives/8070
[Accessed March 2021].
33. am730:《 「 半 億 中 產 」 與 「 百 萬 貧 民 」 樓 市 極 度 扭 曲 下 的 產 物 》,
2019 年 6 月 1 日 , 網 址 : https://medium.com/am730hk/半億中產-與-百
萬貧民-樓市極度扭曲下的產物-51ff103c94fa [於 2021 年 3 月 登 入 ]。
34. Squarefoot.com.hk:《 少 年,你 太 年 輕 了:平 均 預 期 44 歲 才 成 功 買 樓
「 上 車 」》, 2019 年 7 月 2 日 。 網 址 : https://www.squarefoot.com.hk/
房地產指南/少年你太年輕了調查平均預期 44 歲才成功買樓上車-65281/
[於 2021 年 3 月 登 入 ]。
35. 香 港 01:《 140 萬 貧 窮 人 口 創 新 高 司 局 長 文 過 飾 非 》, 2019 年
12 月 17 日,網 址:https://www.hk01.com/01 觀 點 /410626/貧 窮 報
告 -140 萬 貧 窮 人 口 創 新 高 -司 局 長 文 過 飾 非 [於 2021 年 3 月 登 入 ]。
36. 香 港 政 策 研 究 所 :《 多 方 面 支 援 首 次 置 業 家 庭 》, 2018 年 , 網 址 :
http://www.hkpri.org.hk/storage/app/media/thumbnail/20180225_Policies_su
pporting_1sttime_home_buyers.web.pdf [於 2021 年 3 月 登 入 ]。
2337. 新 論 壇 :《 香 港 各 世 代 大 學 學 歷 勞 工 (1989-2019) 住 屋 承 擔 能 力
研 究 報 告 》 , 2020 年 , 網 址 :
https://www.ncforum.org.hk/file/upload/file_1007_E6X.pdf [於 2021 年 3 月
登 入 ]。
38. 《 王 于 漸 : 財 富 差 距 取 決 於 樓 99% 不 能 靠 打 工 賺 回 來 》,
《 信 報 月 刊 》, 2020 年 12 月 。
39. 《 今 年 外 資 買 港 樓 未 賺 價 先 蝕 滙 》,《 明 報 》, 2020 年 12 月 9 日 。
Global
40. Board of Governors of the Federal Reserve System. (2020) Changes in U.S.
Family Finances from 2016 to 2019: Evidence from the Survey of Consumer
Finances. Available from: https://www.federalreserve.gov/publications/files/scf
20.pdf [Accessed March 2021].
41. Credit Suisse. (2020) The Global Wealth Report. Available from:
https://www.credit-suisse.com/about-us/en/reports-research/global-wealth-re
port.html [Accessed March 2021].
42. Forbes. (2016) Why Homeownership Matters. Available from:
https://www.forbes.com/sites/lawrenceyun/2016/08/12/why-homeownership-
matters/?sh=c837e3f480f3 [Accessed March 2021].
43. Forbes. (2018) Mid-term Elections 2018: How renters could swing the vote?
Available from: https://www.forbes.com/sites/alyyale/2018/11/01/analysis-rent
ers-could-swing-the-midterm-elections/?sh=4aba020729d1 [Accessed
March 2021].
44. Freddie Mac. (2018) Why Homeownership Matters: The Triple Bottom Line.
Available from: http://www.freddiemac.com/blog/homeownership/20180604_
national_homeownership_month.page [Accessed March 2021].
45. Jiang, B. (2019) Homeownership and voter turnout in U.S. local elections.
Journal of Housing Economics. September, vol. 41, pp. 168-183. Available from:
https://www.sciencedirect.com/science/article/abs/pii/S105113771830041X
[Accessed March 2021].
2446. National Associations of Realtors. (2011) Social benefits of home ownership and
stable housing. Available from: https://www.nar.realtor/sites/default/files/migr
ation_files/social-benefits-of-stable-housing-2012-04.pdf [Accessed
March 2021].
47. Organisation for Economic Co-operation and Development. (2011)
The Evolution of Homeownership Rates in Selected OECD Countries:
Demographic and Public Policy Influences. Available from:
http://www.oecd.org/economy/growth/evolution%20of%20homeownership%2
0rates.pdf [Accessed March 2021].
48. Organisation for Economic Co-operation and Development. (2018) Inequalities
in household wealth across OECD countries: Evidence from the OECD
Wealth Distribution Database. Available from:
https://www.oecd.org/officialdocuments/publicdisplaydocumentpdf/?cote=SD
D/DOC(2018)1&docLanguage=En [Accessed March 2021].
49. Organisation for Economic Co-operation and Development. (2019) Housing,
wealth accumulation and wealth distribution: Evidence and stylized facts.
Available from: https://www.oecd.org/officialdocuments/publicdisplaydocumen
tpdf/?cote=SDD/DOC(2018)1&docLanguage=En [Accessed March 2021].
50. Parliament of Australia. (2008) A good house is hard to find:
Housing affordability in Australia. Available from:
https://www.aph.gov.au/Parliamentary_Business/Committees/Senate/Former_
Committees/hsaf/report/index [Accessed March 2021].
51. Rosen Consulting Group. (2020) Why homeownership should continue to be
incentivized by our federal tax system. Available from:
https://www.nar.realtor/sites/default/files/documents/white-paper-homeowne
rship-incentivized-by-federal-system-02-06-2020.pdf [Accessed March 2021].
52. Washington Post. (2018) Report: Renters lean more Democratic, but much
less likely to vote, than homeowners. Available from:
https://www.washingtonpost.com/business/2018/10/30/report-renters-lean-more
-democratic-much-less-likely-vote-than-homeowners/ [Accessed March 2021].
53. White House. (2001) Home Ownership. Available from:
https://georgewbush-whitehouse.archives.gov/infocus/homeownership/homeo
wnership-policy-book-background.html [Accessed March 2021].
25You can also read


