H1 2018 Results Investor Presentation - Coventry Building Society
←
→
Page content transcription
If your browser does not render page correctly, please read the page content below
H1 2018 Results Investor Presentation

Disclaimer
The following disclaimers apply to the presentation materials following this page. You are advised to read this page carefully before reading,
accessing or making any other use of the presentation materials.
• This presentation is the property of Coventry Building Society (the “Society”) and has not been approved by any regulatory authority. The presentation
  and its contents are provided strictly for information purposes only for the sole use of the parties to whom it is delivered and may not be reproduced in
  any form or further distributed to any other person or published, in whole or in part, for any purpose. Failure to comply with this restriction may constitute
  a violation of applicable laws. By reading this presentation, you agree to be bound by the following limitations.
• This presentation has not been prepared, and is not being made available, in connection with any offer of securities. It does not constitute a prospectus
  or other offering document. Nothing in this presentation shall constitute an offer to sell or the solicitation of an offer to buy any securities, and no regard
  should be had to this presentation, nor any reliance placed on any of the information contained herein, in connection with any investment decision in
  respect of any securities. The information in this presentation is not intended to be, and must not be, relied on as advice for making investment
  decisions. The Society accepts no responsibility or liability whatsoever in connection with any such use.
• This communication is made to and directed only at persons in the United Kingdom who are (i) professional investors falling within Article 19(5) of the
  Financial Services and Markets Act 2000 (Financial Promotion) Order 2005 (as amended) (FPO), (ii) high net worth entities falling within Article 49(2)(a)
  to (d) of the FPO and (iii) other persons to whom it may lawfully be made (together, Relevant Persons). Securities to which this presentation relates are
  only available to Relevant Persons and no other persons should act upon it. It is not intended for retail investors or otherwise to be made generally
  available to the public in the United Kingdom or elsewhere.
• The statements of fact in this presentation have been obtained from and are based on sources the Society believes to be reliable. The Society does not
  guarantee their accuracy, and any such information may be incomplete or condensed. All information contained in this presentation speaks as of the
  date of this presentation unless otherwise stated, is subject to change without notice and has not been independently verified. The Society is under no
  obligation to update or keep current the information contained herein.
• No representation or warranty, express or implied, is or will be made by the Society, its affiliates, advisers or representatives or any other person as to,
  and no reliance should be placed on, the truth, fairness, accuracy, completeness or correctness of the information or the opinions contained herein (and
  whether any information has been omitted from this presentation). To the extent permitted by law, the Society and each of its directors, officers,
  employees, affiliates, subsidiaries, advisers and representatives disclaim all liability whatsoever (in negligence or otherwise) for any loss however
  arising, directly or indirectly, from the use of this presentation or its contents or otherwise arising in connection with this presentation.
• Certain statements in this presentation may constitute "forward-looking statements". Forward-looking statements are sometimes, but not always,
  identified by their use of a date in the future or such words as "anticipates", "aims", "believes", "continue", "could", "due", "estimates", "expects", "goal",
  "intends", "may", "plans", "project", "seeks", "should", "targets", "will" or the negative or other variations of these terms and related and similar
  expressions. These statements reflect the Society’s current expectations and are subject to risks and uncertainties that could cause actual results or
  developments to differ materially from any expected future events or results referred to in or implied by these forward-looking statements, which could
  adversely affect the outcome and financial effects of the plans described in this presentation. You are cautioned not to rely on such forward-looking
  statements, which speak only as of the date that this presentation was prepared. The Society does not undertake any obligation to update or revise any
  forward-looking statements, whether as a result of new information, occurrence of unanticipated events or otherwise, except where required under
  applicable law.
• Nothing in this presentation should be construed as legal, tax, regulatory, financial, accounting or investment advice.
• Certain data in this presentation has been rounded. As a result of such rounding, the totals may vary slightly from the arithmetic total of such data.
• The Society is authorised by the Prudential Regulation Authority and regulated by the Financial Conduct Authority and the Prudential Regulation
  Authority.
1.   Overview
2.   Financial Performance
3.   Asset Quality
4.   Capital
5.   Funding and Liquidity
6.   Contact Details

Overview

Overview
                     Simple business model                                                                                                   Financial Strength

             Providing simple, transparent retail savings products which offer
                                                                                                                                 Strong CET1 ratio highest reported by any top 20 lender.1                                  35.5%
              long term value.
             Helping customers buy residential properties through low risk                                                      Management expense ratio lowest reported by any top 10
                                                                                                                                                                                                                            0.46%
              mortgage lending primarily through intermediaries.                                                                 UK building society.
             Delivering sustainable organic growth without taking on higher                                                     Leverage ratio exceeds regulatory requirements.3                                           4.6%
              levels of risk to protect existing members during periods of
              economic stress, and to safeguard the Society’s future.                                                            The 2nd Largest Building Society in the UK
             Ensuring operations are cost efficient, allowing the society to pay
              above market interest rates to savers, whilst investing in the                                                                           Long term             Short term              Last credit opinion
              future and maintaining capital strength.                                                                             Moody’s                  A2                     P-1                    August 2017
             Underpinned by our CARES values which shape decision making
              and focus on putting members first.                                                                                    Fitch2                  A                      F1                     May 2017

                                   Low risk                                                                                                     Member Focus

             Low LTV lending and third party distribution provides resilience                                                  The Society returned
              to the business model if the market deteriorates.                                                                  £117m of value back to
             Strong margin management capability, with the capacity to                                                          members in H1 2018
              increase margin if needed.                                                                                         (£210m FY 2017) through
             28% of mortgages and 63% of savings on administered rates at                                                       savings rates.
              30 June 2018.                                                                                                     The Society still has a
             Mortgage and savings rates remain competitive with pricing                                                         strong Branch network
              supported by low levels of operating costs, impairments and                                                        consisting of 70 branches
              conduct provisions.                                                                                                and 21 agencies to
             Nationwide distribution of savings and mortgage avoids                                                             service our members.
              geographical concentration.                                                                                       Currently the 7th largest                                 Branch                Agency
                                                                                                                                 mortgage lender in UK
•   1. Source: CML Top 20 mortgage lenders (as published August 2016) - latest published CET 1 data As at 23/02/2018 2.Fitch rating unchanged for 20 years 3.Under the BoE modified calculation excluding Central bank exposure less than 3 months
    4. The Society’s average month end savings rate (society mix of products) compared to BoE WA rate for household interest bearing deposit (market mix of products)
                                                                                                                                                                                                                                           5
Financial Performance
  Highlights from H1 2018

Financial performance

                                                             Financially safe and strong institution with a CET1 ratio of 35.5%, the highest reported
              Capital                                        by top 20 lender1, and a leverage ratio of 4.6%2 , reflecting the low credit risk business
                                                             model.

                                                             Continued focus on cost control with the costs to mean assets ratio at 0.46% (0.41%
                  Cost                                       excluding strategic investments), the lowest reported by any UK building society.1

      Impairments                                             Strong asset performance continues, with an impairment credit of £1.0m.

                                                             Mortgage assets have increased by £1.5bn (4.1%) in H1, without any change in risk
             Growth                                          appetite. Savings balances increased by £0.4bn (1.3%).

                                                             Net interest margin at 100bps, in line with expectations. The Society continues to
                  NIM                                        reward members, returning £117m to them in H1 through competitive product
                                                             pricing.

                Profit                                        Profit before tax of £113.1m, in line with H1 2017.

                                                                                                                                                                                                           7
1. Source: CML Top 20 mortgage lenders (as published August 2016) - latest published CET 1 data As at 23/02/2018 2.Under the BoE modified calculation excluding Central bank exposure less than 3 months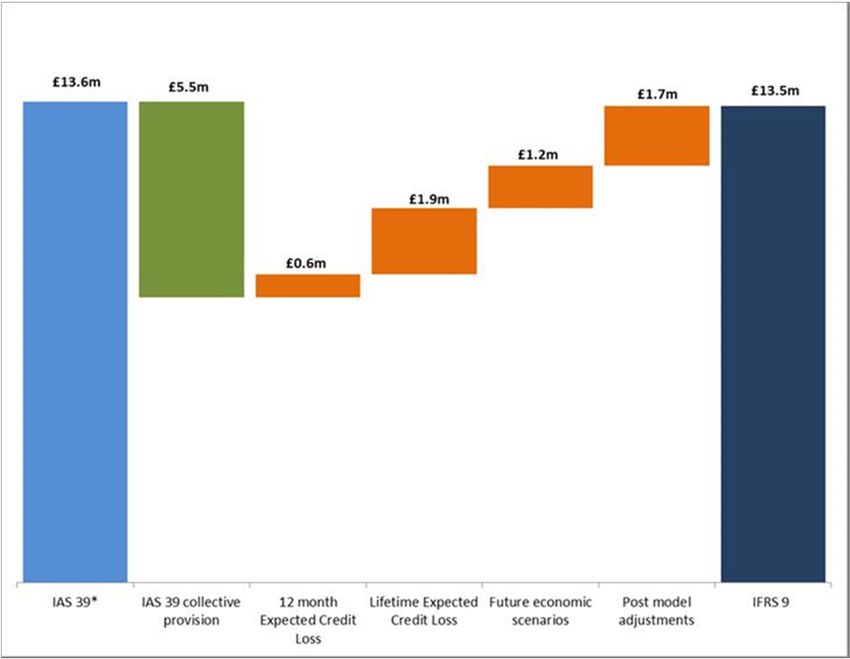
Financial performance
                        Income statement                                                   Balance sheet
£m                                       HY2018     HY2017    £bn                                          HY2018   HY2017
Interest receivable and similar income     480.5     430.5    Liquidity                                       6.0      5.0

Interest payable and similar charges     (266.8)    (238.2)   Loans and advances to customers                37.4     34.5

Net interest income                        213.7     192.3    Derivative financial instruments                0.3      0.4

Other income                                (1.0)      4.9    Intangible and tangible assets                  0.1      0.1

Net gains/losses from derivatives           (0.6)      1.1    Other assets                                    0.0      0.0

Total income                               212.1     198.3    Total assets                                   43.8     40.0
                                                              Shares                                         31.4     29.9
Management expenses                        (99.6)    (81.9)
                                                              Wholesale                                       9.9      7.7
Impairment charges/credit                    1.0       0.1
                                                              Derivative financial instruments                0.2      0.4
Financial Services Compensation Scheme       1.4      (2.5)
                                                              Other liabilities                               0.2      0.1
Provisions for liabilities and charges      (1.0)      1.0
                                                              Subordinated liabilities                        0.0      0.0
Charitable donation (Poppy Appeal)          (0.8)     (0.6)
                                                              PIBS                                            0.0      0.0
Profit before tax                          113.1     112.4
                                                              Members’ interests and equity                   2.1      1.9
Taxation                                   (26.7)    (27.2)
                                                              Total liabilities & equity                     43.8     40.0
Profit for the period                       86.4      85.2

            Net interest income rose 11%
                                                                             Balance sheet growth of 10%
            Profit before tax increased 1%
                                                                                                                             8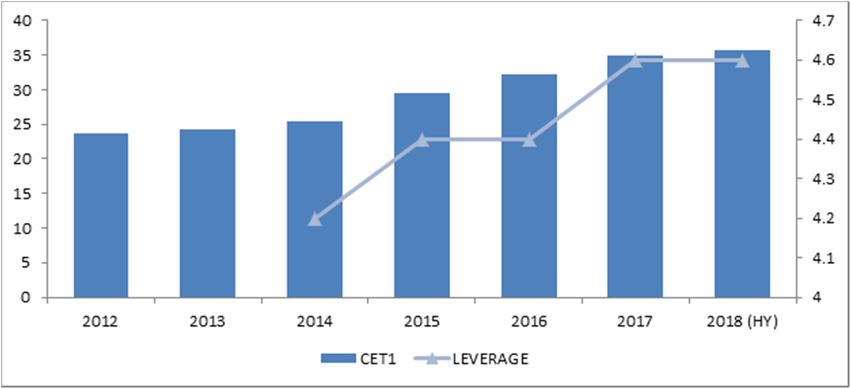
Financial performance
      Net Interest Income 2018: £213.7m (£192.3m HY 2017)

 The Society is committed to providing long-term sustainable value to members through competitively priced saving and mortgage products. Each year
  we retain only sufficient profit to ensure we have the capital we need, enabling us to provide favourable pricing for members.
 Both mortgages and savings have grown ahead of market in H1, and net interest income increased whilst the low risk appetite was maintained, as
  evidenced by continuing low impairments.
 Substantial strategic investments have been made during the year to date, including the redesign of our branches and enhanced data centre capability,
  and with a programme to upgrade the Society’s core technology platform being initiated.
 NIM increased by 1bp, reflecting the benefit of the profit on sale of a BTL portfolio, which added 7bps to margin.

                             Profit before tax                                                  Net interest income (£m) / Margin %

300
                                                                                450                                                                     1.2

250                                                                             400
                                                                                                                                                        1
                                                                                350
200                                                                             300                                                                     0.8
                                                                                250
150                                                                                                                                                     0.6
                                                                                200                                               411
                                                 239.1   242.7                                               363.9      385
100                  201.8         216                                                             341.3
                                                                                150                                                                     0.4
                                                                                        253.1
         132.1                                                                  100                                                        213.7
 50                                                                  113.1
                                                                                                                                                        0.2
                                                                                 50
  0                                                                                0                                                                    0
         2013        2014         2015           2016    2017       H1 2018              2013      2014      2015      2016      2017     H1 2018

                                                                                                                                                    9
Financial performance
Large Proportion of Administered Rates Retail Funding led Lending Strategy
Consistent growth in mortgage balances, growing by over 4.1% in Retail savings growth of 5% over the previous 12 months versus
2018. market growth of 2.7%.2
Mortgage assets continue to be of very high quality with the balance Over 90% of mortgages are funded by retail savings or capital.
weighted average indexed LTV of the mortgage book at just 53.7% as Nearly two thirds of savings are on administered rates, supporting
at 30 June 2018. the commercial scope to manage margins.
The proportion of administered rate mortgage products allows
commercial scope to manage margin if required, with the Society’s
Flexx for Term mortgage offering continuing to attract borrowers to
an administered rate product.
Mortgages Savings
40.0
Savings Mortgages
35.0
30.0
25.0
37% Fixed 28%
20.0
Administered 35.9 37.4
32.9 31.0 31.4
72% 15.0 29.4 28.1
63% 27.0 25.4
24.1 23.4
10.0 21.3
5.0
-
2013 2014 2015 2016 2017 H1 2018
10
1. The Society’s average month end savings rate (society mix of products) compared to BoE WA rate for household interest bearing deposit (market mix of products) 2.Source: Bank of EnglandFinancial performance
Management expenses (%)
0.7 Next best in peer group
0.6 Strategic Investment Spend
0.5 Coventry BS
0.4
0.3
0.2
0.1
0
2006 2007 2008 2009 2010 2011 2012 2013 2014 2015 2016 2017 H1 2018
Low Cost Base
Low cost base gives a competitive advantage.
Cost efficiency is enabled by a simple business model, efficient distribution channel and high average account balances with growth driving
economies of scale.
The costs to mean assets ratio remains the lowest of the top ten UK building societies.1
The difference to the next best in the peer group is 10bps.1
Strategic investments in the branch network, data centre capability and in upgrading the core technology platform will lead to a rise in the
management expense ratio in the short-term (H1 ratio of 46bps, 41bps excluding strategic investment spending).
11
1. Source: CML Top 20 mortgage lenders (as published August 2016) - latest published CET 1 data As at 23/02/2018 2. Next best in peer group HY2017 release used Source: Annual report & accountsFinancial performance
% 2014 2015 2016 2017 HY 2018
Net interest margin / mean assets 1.15 1.11 1.06 1.02 1.00
Cost/ mean total assets 0.42 0.42 0.41 0.42 0.46
Cost / income ratio 35.7 37.2 37.9 40.4 47.0
Retained profit / mean assets 0.53 0.52 0.50 0.46 0.23
Liquidity (as percentage of SDL) 13.6 13.8 13.5 15.5 14.5
Wholesale funding 19.4 20.0 21.6 22.7 24.0
Mortgage assets growth 11.8 9.1 11.8 9.3 4.1
Common Equity Tier 1 ratio 25.4 29.4 32.2 34.9 35.5
Leverage Ratio2 4.2 4.4 4.4 4.6 4.6
Liquidity Coverage Ratio (LCR) >100 141 151 208 177
Financial Strength
Growth in mortgages and savings continued in H1, with both growing ahead of the market.
Net interest margin reflects strong member pricing, whilst being sufficient to support growth and maintain capital ratios, this
includes 7bps uplift due to sale of £350m buy-to-let mortgage portfolio.
Cost control is a key advantage in an increasingly competitive mortgage market. Increase reflects strategic investment projects.
Wholesale funding higher due to TFS drawings.
CET1 ratio highest reported by any top 20 lender1. Liquidity Ratio is significantly in excess of regulatory minimum.
12
1. Source: CML Top 20 mortgage lenders (as published August 2016) - latest published CET 1 data As at 23/02/2018 2.Under the BoE modified calculation excluding Central bank exposure less than 3 months (2017 results)Building for the future – Strategic Investment
Investment for the Future to create competitive advantage
Level of IT and technology change is rising as a result of:
Rising customer expectations for service delivery and enhanced functionality;
Higher levels of cyber threat;
Increased expectations from regulators.
Our capital strength, low cost base and long term view enable us to invest despite a competitive market.
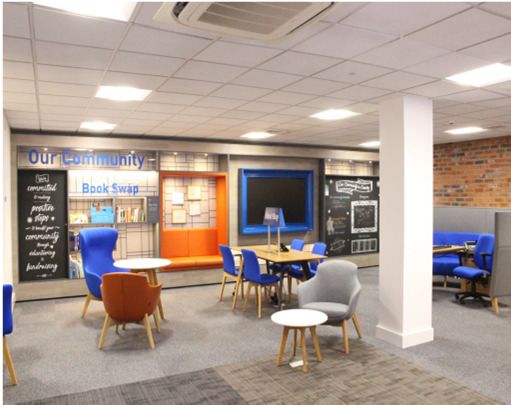
Branch network re-design Operational Resilience Investment in New Banking Platform
Important face of the Society with the To enhance operational resilience we Planning the upgrade of our core banking
membership which builds trust and are progressing a move to a co-located platform to provide greater flexibility in
engages the community. / cloud hybrid datacentre environment. responding to changing customer needs
Branches account for over 30% of Will provide dedicated and resilient and regulatory requirements, more
retail savings acquisition each year and point to point connectivity. quickly and cheaply.
manage around £10.5bn of the total Cloud technology adopted subject to Enhancements will create future
retail book. rigorous risk assessment. competitive advantage.
70 branches concentrated in our Enable scalability of operation, and Supports product and change agility and
heartland. achieve economies of scale in a safe and cost efficiency
The re-design of the branch network secure way. Is a better base on which to build out
will meet evolving needs of members digital capabilities, streamline customer
and better reflect the future of branch journeys and integrate into an Open
engagement Banking market
Flexible design principles will future Build resilience of both architecture and
proof our branches. software
13Building for the future – Strategic Investment
Operational Resilience Branch Network Re-Design
Project to move data from own data centres to co-location
The re-design of the branch
and cloud services.. Delivering cost efficiency and security
by using new technology. network will meet evolving
needs of members and better
Q2 2016 Review of data centres initiated reflect the future of branch
September 2016 Data Centre strategy presented to Board engagement.
and permission to start Feasibility
granted In H1 2018 Leicester branch
January 2017 Board approves Start-Up (GW0) for the Infrastructure pilot opened (May), with
Transformation Programme. positive feedback.
July 2017 Analysis in Start-Up confirms the Hybrid Data Centre approach fits
within Society’s low risk approach. In H2 2018 we plan to complete 6/7more branch transformations
December 2017 Selection of key partners, approved by Board
2018 transformations will
February 2018 Signed the agreement for best-of-breed co-located data centre
provide insight into adapting
provision with BT/Ark following a structured review of the market
and subsequent procurement process. Contract with AWS for the design to different
cloud has been signed branches ahead of a faster
roll out to the full network
In H2 2018 we will Complete core-located data centre infrastructure build ready to
over 2019 - 2021
built ready to accept first applications;
Amazon cloud virtual data centres built ready to accept first
applications;
First applications migrated into the cloud
14Building for the future – Strategic Investment
Investment in New Banking Platform
Moving to a modular, easier to update core banking platform will provide competitive advantage
Supports product and change agility and cost efficiency
Is a better base on which to build out digital capabilities, streamline customer journeys and integrate into an Open Banking market
Build resilience of both architecture and software
In H1 2018 we have completed transition planning and scoping. Through H2 2018 and into Q1 2019 we will be completing detailed solution design
and standing up the infrastructure.
The programme is scheduled to be completed by 2021
Progress to Date
September 2017 June 2018
February 2017 Completed Core Banking
Package selection process Contracts signed with all
Board approved initial Major suppliers
investment to get to (Accenture, Iress and
business case stage April 2018 Temenos)
October 2017 Board approval to pass
Defined the approach through Gateway One
which would gives full
Summit Solution
December 2017
Selected Accenture as our
November 2017 preferred Delivery Partner
Board ratified recommendation / Systems Integrator
to proceed with MSO (IRESS) March 2018
and T24 (Temenos) as preferred Completion of Start Up (& early design)
packages and agreed the Stage. High level solution, E2E plan
approach to Gateway 1 understood
January 2018
Presented detailed approach and plans to Gateway One,
thus commencement of Start Up (& early design) Stage 15Building for the future – Open Banking Opportunity
Changes in the UK savings and mortgage markets provide opportunity for the Society
Open banking and the continued move toward intermediary distribution in the mortgage market provide opportunities for the Society to grow
both aspects of its business.
Savings market opportunity Increase in customer choice in mortgage market
Open banking, and the expected growth of account aggregation The UK market now sees around 70% of mortgage business
services, will give consumers more flexibility and choice in savings generated through intermediaries.
decisions. The Society is already ahead of this trend, with over 90% of
The increased mobility of the low paying funds held at larger lending through intermediaries, and with branch and phone
competitors is an opportunity for the Society - £1 in every £4 is channels sized for the low level of direct distribution.
currently held in current accounts1 The FCA vision centres around customer choice and ease of
The Society already has an agreement with Hargreaves Lansdown switching.
that sees Society accounts offered through their platform. The Society expects to be a net beneficiary of this trend and is
As an active acquirer in the savings market, the Society is well working with a number of top lenders and other parties to design
placed to benefit from technological and competitive change. an integrated technology hub to support customer choice in the
Current Account and Savings Balances1 mortgage process.
80%
60%
Savings
40%
Current Accounts
20%
0%
2013 2017
16
1. Source: CACI Benchmark servicesBuilding for the future – Board Changes
The Society’s Board has been further strengthened by appointments in 2018
Three appointments made this year have added further industry and risk management knowledge to the Board:
Gary Hoffman was appointed to the Board on 26 April 2018 as a Non-Executive Director and Chairman. Gary has held a number of executive
and non-executive positions in the banking, insurance and payment services industry, including as Chairman of Barclaycard and Barclays UK,
Chief Executive of Northern Rock after its nationalisation, and Chairman of life insurer Hastings and of Visa Inc.
Iraj Amiri was appointed to the Board on 6 July 2018, as a Non-Executive Director. Iraj has held a number of executive and non-executive
positions with public and member organisations covering auditing, investments and pensions, including working as a partner at Deloitte,
where he headed the internal audit group and enterprise risk management group.
Martin Stewart will join the Board as Non-Executive Director with effect from 1 September 2018. He is a leading figure in UK financial
services with extensive business experience and a successful career at the UK's prudential regulator.
17
1. Source: CACI Benchmark servicesAsset Quality
Asset quality
                                                                                         Gross lending ≤ 75% LTV
      Low Risk Loan-to-Value (LTV)
                                                                                                                   PRA     CBS
 82% of lending in 2018 has been at LTVs of 75% or below, in     90%                            84%
                                                                              81%                                                    81%
  comparison to the market average of 66% (to end of Q1           80%                                            77%
  2018).
                                                                  70%   64%                64%             65%                66%
 Market lending above 90% in the first quarter of 2018 was
  3.3%; Coventry lending above this LTV was nil.                  60%
 No sub-prime, commercial or second charge lending (legacy
                                                                  50%
  inherited commercial book currently £2.5m in run off).
 Negligible levels of unsecured lending (£26.1m: HY 2018,        40%
  31.8m: 2017 ).                                                  30%
 The balance weighted average indexed LTV of the entire
  mortgage book is 53.7%.                                         20%
 97% of the overall book has an indexed LTV of 85% or less.      10%
 Circa 70% of all buy-to-let lending was originated at 65% LTV
                                                                  0%
  or less.                                                              Q2 2017            Q3 2017          Q4 2017           Q1 2018

                   Total book split by product                                             Total book split by LTV

                                       Other, 0.6%                                        85-95, 3%      >95, 0%
                                                                                  75-85, 8%
Asset quality
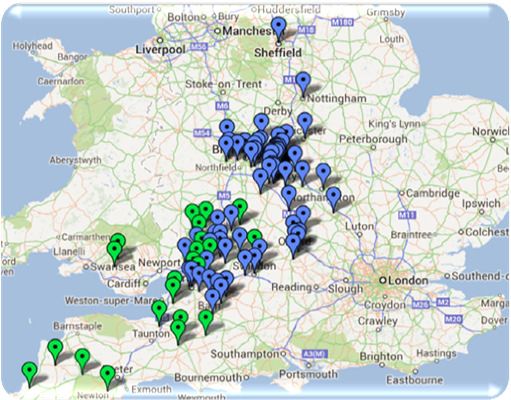
Geographic Split Mortgage Book Performance
The majority of the UK mortgage market is introduced via The Society’s arrears performance continues to improve and to be
intermediaries (e.g. independent financial advisors, mortgage significantly better than the industry as a whole.
brokers, estate agents). The value of loans in arrears by ≥ 2.5% of the mortgage balance at 31
Intermediaries give national coverage and support the geographic June 2018, as a proportion of the total book, has fallen to 0.13%.
diversification of the mortgage book. Unlike some lenders, arrears are very rarely capitalised. There was
Crucially, all underwriting and servicing is performed by Coventry. only 1 case in HY18 for Coventry versus 2,400 for the industry as a
There is no ‘packaging’; the intermediary acts solely as an whole up to Q1.
introducer. IFRS 9 introduced in 2018, with a small decrease of impairment for
consumer loans and a negligible impact on regulatory capital.
Geographic distribution by value Arrears ≥ 2.5% of mortgage balance (including possessions)
Wales and
Scotland, 3.0
South West Northern
3.6%
England, Ireland,
2.5% 2.5
9.1%
2.0
East of London, % Loan Book by Value
1.5
England, 26.6%
11.3%
1.0
Northern
England, 0.5
13.7% South East
Central England, 0.0
Q1 Q3 Q1 Q3 Q1 Q3 Q1 Q3 Q1 Q3 Q1 Q3 Q1 Q3 Q1 Q3 Q1 Q3 Q1 Q3 Q1 Q3 Q1
England, 18.4% '07 '07 '08 '08 '09 '09 '10 '10 '11 '11 '12 '12 '13 '13 '14 '14 '15 '15 '16 '16 '17 '17 '18
14.8% PRA CBS
20Asset quality
Robust Origination and Monitoring Impairment charges as % of loans
Coventry has strong and experienced central underwriting and collections
Net UPL loan charges
teams, with no outsourcing.
The Credit Risk department analyses the performance of the mortgage 0.01 Charges on products no longer originated
book and conducts quality assurance assessments.
We consistently target low risk areas of the mortgage market, primarily Charges on products still originated
low LTV owner occupier and buy-to-let. 0.01
No lending has been advanced at more than 90% LTV since 2009.
Arrears levels are consistently below industry averages at just 0.21% of
accounts being more than three months in arrears (Industry average 0.03 Impairment charge release for
2015, 2016 and H1 18
0.81%).1 0.02 0.02
At 30 June 2018, only 37 properties were in possession.
0.001 0
2012 2013 2014 2015 2016 2017 H1 2018
20
Average Society Possessions per month Very Low Impairments
18
16 Impairments are very low on a mortgage book of £37.3bn.
14
Impairment charges have fallen over the recent past with
releases reported in 2015 and 2016.
12 Impairment charges in the last recession between 2008 and
10 2012 averaged c. 8 bps per year. A significant proportion (55%)
of the impairment charges seen in that period were on loan
8
products that are no longer offered e.g. unsecured personal
6 loans. Impairments have been consistently falling since exiting
4 such markets, with the continued focus being on high quality
lending.
2
0
2013 2014 2015 2016 2017 YTD Jun-18
21
1. Source UK FinanceAsset quality – Buy-to-let
Coventry BTL Experience Coventry BTL Performance
Approximately 2/3 of Coventry’s buy-to-let lending is on houses, with The focus on low LTV lending and on properties that are suitable for
one third on flats. the owner occupier market has led to low levels of arrears, and as at
Buy-to-let demographic is older than typical owner occupied 30 June 2018 the number of loans >3 months in arrears (including
demographic. possessions) reduced to just 0.09%.
Arrears and impairment levels have been very low. On over £25.7bn Buy-to-let lending proved to be even more resilient than owner
of lending since entering the market in 2002, we have incurred total occupier lending during the crisis, with peak > 3 months arrears of
losses of £9.2m. 0.73% compared to 1.34% for the owner occupier book.
The balance weighted average LTV of the buy-to-let book is only 54% 86% of our borrowers have only one property with the Society and c.
as at 30 June 2018. 3% have more than two with the Society (maximum 3 properties).
There have been only 4 losses on all buy-to-let lending originated in
2010 or later (total losses £49k) and only 11 buy-to-let properties in
possession from a book of c. 106,000 properties.
New mortgages by purpose of loan, non-seasonally adjusted, UK (CML) (£m) Coventry vs. CML >3mths buy-to-let arrears (incl. possessions)
8000 Remortgage
7000 House Purchase 3.5
6000 CBS BTL >3mths
Other 3.0
% of Mortgages
5000
2.5
4000 UK Finance BTL >3mths
2.0
3000 (excl. ROR)
2000 1.5
1000 1.0
0
0.5
Jan-14
Apr-14
Oct-14
Jan-15
Apr-15
Oct-15
Jan-16
Apr-16
Oct-16
Jan-17
Apr-17
Oct-17
Jan-18
Apr-18
Jul-14
Jul-15
Jul-16
Jul-17
0.0
22Asset quality – Buy-to-let
Lending Criteria London Market
Interest Coverage Ratio
100% subject to physical valuations. 43% of all BTL Balances are in London compared
=100%,<
the owner occupier market. Coventry lending policy ensures any loan greater
125%
>200% Maximum of 3 properties with the than £1m to be less than 50% LTV, up to 75%
0.9%
21.0% Coventry and an aggregate loan limit of LTV loan size is capped at £500k and above 75%
£1,000,000. is capped at £350k.
>=125%,<
150% 50% maximum LTV on new build flats. Coventry does not lend on licensed HMO
35.6% Minimum rental coverage of 125% for properties.
basic tax payers and 140% for higher Severe stress testing carried out on our London
>=175%,< >=150%,<
rate tax payers. BTL book, showed strong resilience.
200% 175%
29.2% The Society does not lend on Studio and Lower arrears than the rest of the country with
13.0% High Rise Flats (above ten storeys) 2bps >3 months in arrears (8bps national
average).
Balanced weighted average LTV
Interest Coverage Ratio (ICR) Portfolio Landlords
56%
For over 99% of accounts, rent Portfolio landlord regulation introduced
55% 55.3%
provides over 100% coverage of the in 2017. Rest of UK
interest due on the loan. Buy-to-let criteria maintained and 55%
London
The pay rate in this calculation was additional checks by dedicated portfolio 54%
floored at 5%. In actuality, the pay rate underwriters only. 54%
on many of these mortgages is Assessment of geographical
53%
significantly lower, and as such true concentration and whole portfolio.
interest cover is likely to be Portfolio maximum LTV of 65% across 53%
considerably higher. all properties within the portfolio. 52%
52.3%
Prudent assumptions regarding rental The whole portfolio minimum ICR of 52%
voids, rent increases etc .are included 125%.
No individual property with ICR < 100%. 51%
Coventry’s actual indexed ICR for 30
June 2018 was 176.6%. The proportion of portfolio landlords is 51%
c.23% of new business BW Avg LTV 2018
23
Based on original rental at 5% stress rate - All data as at 31 December 2017Low Risk – Interest only
Owner Occupier IO Loans
We have a small legacy owner occupied interest only book. In recent years, there has been increased focus on how borrowers will repay their
interest only loans after the typical 25 years contractual term.
As at 30 June 2018 the number of cases on an interest only basis represented 7.7% of the owner occupier book, compared to 34.8% at 31
December 2011.
Only 17 interest only owner occupier mortgages with a LTV greater than 75% were more than 6 months beyond their scheduled term end date
as at 30th June 2018.
A dedicated team is in place to support IO customers, with first contact made a number of years before maturity. The team focus on making
contact with the customer and finding a suitable solution, which may involve a move to a repayment mortgage where a suitable repayment
vehicle is not in place.
Buy-to-let mortgages, where the property is the repayment vehicle, continue to be predominantly interest only.
Interest only by value as proportion of book (owner occupier)
40
35
PRA Interest Only % CBS Interest Only %
30
25
20
15
10
5
0
24Asset quality – IFRS 9
IFRS 9 – Impact on transition
The impact of IFRS 9 on impairment calculations is a £0.1m reduction in impairment on loans and advances to customers. The
impact on capital is negligible.
At 1 January 2018, 95% of the Society’s loans were in Stage 1, 4% were in Stage 2 and 1% were in Stage 3.
A reconciliation of the impairment charge from IAS 39 to IFRS 9 is shown below.
Bridge of impairments from IAS39 to IFRS 9
25Asset quality – IFRS 9
IFRS 9 – Implementation
Significant increase in credit risk is a relative measure, and there are cure periods applied to each stage, loans can be recorded as
Stage 2 or 3 despite otherwise performing at the reporting period date.
Cure periods work to delay transition of loans to a lower credit risk classification (i.e. from Stage 3 to Stage 2 or from Stage 2 to
Stage 1) by requiring typically 12 months of sustained performance before a loan is reassessed.
Of the balances in Stage 2 as at the reporting date, £1,071.2m (92%) were paid up to date as at the balance sheet date. In
addition, of the £219.7m balances in Stage 3, £68.6m (37%) were paid up to date at the balance sheet date.
Possession levels have remained low, with £6.0m of the loans in Stage 3 relating to properties which are in possession. This
comprises 33 individual cases and represents 0.02% of the total mortgage book.
2018
Stage 1 Stage 2
As at 31 March 2018 Stage 3 ‘Default’ Impairment Total
‘Performing’ ‘Deteriorating’
Loans and advances to customers £m £m £m £m £m
Residential mortgages
Owner-occupier 21,582.6 700.6 142.6 (5.1) 22,420.7
Buy to let 14,286.3 373.5 36.1 (3.5) 14,692.4
Non-traditional mortgages
Residential near-prime 31.6 18.9 20.4 (0.2) 70.7
Residential self-certified 114.7 65.4 19.7 (1.5) 198.3
Commercial lending - 2.0 0.5 (0.8) 1.7
Unsecured 25.4 0.4 0.4 (0.6) 25.6
Pipeline - - - (0.1) (0.1)
Total 36,040.6 1,160.8 219.7 (11.8) 37,409.3
Of which past due 89.6 138.9 219.7
26Capital
Capital
                                                                                                   CET1 and leverage ratios1

          Capital and Reserves                                                                                                     Leverage Ratio Framework

        Following a Supervisory Review process in the first half of 2016 the                                                   A binding UK leverage ratio applies to firms with retail deposits of
         Society has been issued with an ICG, currently 12.8% of RWAs.                                                           £50bn or more. All firms are expected to be in scope under the EU
         Retained earnings from strong profitability are Coventry’s primary                                                      rules from 2019.
         source of CET1 capital, currently c. £1.54bn.                                                                          The components of the UK leverage ratio framework are a
        Capital levels were strengthened by the issuance of £400m of AT1                                                        minimum ratio of 3.25% (excluding Central Bank exposures below 3
         in 2014, a deal which attracted an order book in excess of £3bn.                                                        months to maturity). The CCyB is set by the FPC and is currently 1%
        The whole loan sale s of non-member buy-to-let mortgages to a                                                           not enforced until November 2018. 2
         third party in 2015 and 2018 provide further capital management                                                        The modified leverage ratio on a PRA basis at 30 June 2018 is 4.6%
         options.                                                                                                                (4.1% when Bank of England reserve account is included),
                                                                                                                                 comfortably above the 3.25% minimum level (3.6% including the
                                                                                                                                 CCyB).

                                                                                                                                                                                             28
1.The BoE modified calculation excluding Central bank exposure less than 3 months 2.For Leverage Counter cyclical leverage buffer (CCLB) is calculated as 35% of 1% CCyB
Capital and Accounting Future
MREL
3,000
PIBS AT1 CET1
Under the rules the Society is required to meet an interim
MREL requirement is 2x Leverage + Buffers
MREL requirement of 18% of risk weighted assets by 1 January
2020. The indicative end-state MREL requirement for all firms
will be twice the binding capital requirement, for the Society 2,500
Additional
this is currently two times Pillar 1 and Pillar 2a or 25.6% of risk required
weighted assets. The Society currently exceeds this constraint. £700m
If leverage becomes the binding constraint for the Society, this
will result in the need to raise MREL eligible debt. 2,000
As at H1 2018, an additional requirement of £700m of MREL
would be required to meet 2x leverage constraint
This requirement will be expected to grow in the years leading
up to 2022, as the balance sheet grows, however, this equates 1,500
to a manageable 3 to 4 MREL transactions
1,000
Requirement
on a 3.25%
basis
500
-
Leverage MREL
29Basel IV Capital implications
Basel IV
BCBS Paper released in December 2017 outlining Standardised Risk Weights and output floors that seek to remove variability in internal models
(IRB).
Regulation and implications still need finalising and have national discretion (especially in the treatment of differing mortgage types).
Output floor phased in from 50% in 2022 to 72.5% in 2027.
Assuming the implementation of 50% output floor, the CET1 ratio reduces materially but remains above 22% reflecting the impacts of the flooring
on a low risk business model.
Surplus to regulatory minima remains considerable, equal to over 8 times the actual credit losses experienced in the last 10 years.
Surplus over Basel IV Requirement1
CET1 ratio: 35.5%
CET1 ratio: c.25%
CET1 ratio: c.18%
13 x losses 11 x losses 8 x losses
incurred in incurred in incurred in
previous previous previous
10 years 10 years 10 years
Current Transition (50% Floor) End State (72.5% Floor)
30
1. Based on Portfolio Landlords (landlords with 4 or more properties) risk weighted as real estate exposures with repayment materially dependant on cash flows generated by propertyFunding and Liquidity
Retail funding
                                  Retail Funding Prices vs. Market1                                                                  Retail Savings Focus
    1.95%                                                          CBS (average)                                                Lending is primarily funded through retail deposits.
    1.75%                                                          Market (5 months to May 2018)                                Coventry has a proven track record in acquiring and retaining
                       1.77%
    1.55%                                                                                                                        retail balances.
    1.35%                                               1.49%                           1.52%                                   Savings book growth 5% over the 12 months to H1 2018.
    1.15%                                                                                                                       Savings well diversified over distribution channels; Branch,
                                                                                                                                 Internet and Telephone.
    0.95%
                                                                                                                                Coventry market share increased to 2.4% in 2017, with over
    0.75%                       0.92%
                                                                                                                                 145,000 new accounts opened in the year.
    0.55%                                                        0.63%                           0.64%
    0.35%
                             2016                            2017                         2018 YTD

                                              Funding Channels                                                                                             Retail Product Breakdown
                                                                                                                                                    Offset
                                                                                                                                                   Savings
                                               34% of Accounts                                                                                       4%
                                               opened through
                                                 our website
                                                                                                                                                                              Fixed ISA
                                                                                                                                                                                 18%
                                                                                                                                                            Variable
                   40% of Accounts                                        26% of Accounts
                                                                                                                                                            Non-ISA
                    opened in our                                         opened over the
                      branches                                              telephone                                                                         32%
                                                                                                                                                                               Variable ISA
                                                                                                                                                                                   29%
                                                     Total                                                                                  Current                  Fixed
                                                   accounts                                                                                                         Non-ISA
                                                 opened 2017                                                                               Account/
                                                                                                                                            Money                     15%
                                                    145,226
                                                                                                                                           Manager
                                                                                                                                              3%

                                                                                                                                                                                              32
1. The Society’s average month end savings rate (society mix of products) compared to BoE WA rate for household interest bearing deposit (market mix of products)
Wholesale funding
Funding Strategy Wholesale Funding as at 30 June 2018
Other
Covered
Retail deposits are supplemented by a number of wholesale funding options. deposits
Bonds
Wholesale market access provides competitive advantage and diversification of funding 9%
15%
via:
MTNs.
Covered Bonds.
Securitisation. Medium
Continued move towards longer dated wholesale deals providing reliable long term Term
Notes
funding. TFS 22%
Wholesale funding ratio 23.9% as at 30 June 2018. Drawings
TFS drawings of £4.25bn as at 30 June 2018, No FLS remaining. 46%
RMBS
2%
Repo
8%
Wholesale funding maturity profile2
1800
1600
Senior
1400
350
1200
1000 EUR Senior
580
800
600 AT1
Securisation
Covered Bond 400
400 Covered Bond 1781
750 650 Covered Bond Senior Senior Covered Bond
200 Senior
350 400 400 450 400
0
2018 2019 2020 2021 2022 2023 2024
33
1. Current value after amortisation 2. In GBP, excluding TFSLiquidity
Liquidity LCR / NSFR
Over 99% of core liquidity is eligible as High Quality Liquidity Assets The Society maintains liquidity considerably above regulatory
Buffer and consists of UK Government or Bank of England assets. requirements with LCR 177% as at 30th June 2018.
Core liquidity holdings are solely UK exposure, the Society has no The NSFR was 144% as at 30 June 2018, which is consistent with
direct exposure to peripheral Eurozone countries. the year-end position (145%).
The UK authorities have placed increased emphasis on contingent The Loan to Deposit ratio was 116% reflecting the stable funding
liquidity, from central bank facilities via the pre-positioning of loan profile of the Society
books, retained bonds and other assets. The Society prepositioned
additional mortgage assets in January 2018 as part of its ongoing
liquidity management strategy.
Core Liquidity1 Contingent Liquidity2
Supranational Offa RMBS
Bonds 1% Gilts 2% 2%
Retained Mercia
Covered RMBS
Bonds 21%
£4.6bn 31%
£4.6bn
Contingent
Core Liquidity
Liquidity2
BoE Pre-
Reserves Positioned
97% Loans
46%
34
1.Showing value of unencumbered assets as at 30 June 2018 – The Society held £750m Gilts in repurchase agreements as at 30 June 2018. 2. including £2.1bn unencumbered prepositioned loans at the BoEContacts
Contact details

 Contacts
    Michele Faull                                                  Lyndon Horwell
    Chief Finance Officer                                          Treasurer
    michele.faull@thecoventry.co.uk                                lyndon.horwell@thecoventry.co.uk
    02476 435527                                                   02476 435079

    Phil Hemsley
    Assistant Treasurer - Liquidity
    philip.hemsley@thecoventry.co.uk
    02476 181327

Useful links
• Main website                   http://www.coventrybuildingsociety.co.uk/
• Financial results              http://www.coventrybuildingsociety.co.uk/your-society/financial-results.aspx

                                                                                                                36
You can also read