FEBRUARY MARKET UPDATE - CORN, SOYBEANS, RICE, AND COTTON - LSU AGCENTER
←
→
Page content transcription
If your browser does not render page correctly, please read the page content below
Staff Report No. 2021-16                                                                                                             February 11, 2021

                                                         February Market Update
                                                Corn, Soybeans, Rice, and Cotton
                                                                                         Dr. Michael Deliberto
                                                                      Louisiana State University Agricultural Center
                                                                   Department of Agricultural Economics & Agribusiness

WASDE Summary ............................................................................................................................. pg. 1
Commitment of Traders Report ......................................................................................................... pg. 2
U.S. Average Cash Market Basis ....................................................................................................... pg. 3
Corn ................................................................................................................................................... pg. 3
Soybeans ............................................................................................................................................ pg. 9
Rice .................................................................................................................................................... pg. 12
Cotton................................................................................................................................................. pg. 15
Macroeconomic Indicators................................................................................................................. pg. 14
Projected 2020 CY PLC Farm Program Payment Rates .................................................................... pg. 19
Projected 2020 CY ARC-CO Farm Program Price Parameters ......................................................... pg. 19

WASDE Summary __________________________________ _________________________________
This month’s 2020/21 U.S. corn outlook is for higher exports and lower ending stocks. Exports have been
raised 50 million bushels on account of recent, historically large corn purchases by China. With no other
use changes, U.S. corn ending stocks have been lowered 50 million bushels from last month. The season-
average corn price received by producers is raised 10 cents to $4.30 per bushel.
This month’s 2020/21 U.S. soybean outlook is for increased exports and lower ending stocks. Soybean
exports are projected at 2.25 billion bushels, up 20 million from last month reflecting record marketing-
year exports through January and a slow start to Brazil’s export season that has been plagued with harvest
delays. With crush remaining unchanged, soybean ending stocks are reduced 20 million bushels to 120
million. If this stands, soybean ending stocks would be down 77 percent from 2019/20, and the lowest
since 2013/14. The U.S. season-average soybean price for 2020/21 is forecast at $11.15 per bushel,
unchanged from last month. The price for soybean meal is forecast at $400.00 per short ton, up 10 dollars.
The soybean oil price forecast is raised 1.5 cents to 40.0 cents per pound.
The outlook for 2020/21 U.S. rice this month is for stable supplies and domestic use, lower exports, and
higher ending stocks. Exports are lowered by 1.0 million cwt to 93.0 million, all for long-grain on the
continued sluggish pace of sales and shipments for long-grain milled rice. Projected 2020/21 all rice
ending stocks are raised by an equivalent amount to 39.4 million cwt.
Long grain ending stocks rose to 27.3 million cwt, mid-range between the 16.9 million cwt at the end of
last marketing year, and the 32.6 million cwt level of 2018/2019. Average price is up 20 cents to $12.20.
There were no changes to medium and short grain numbers. California prices are forecast stable at
$19.00, while southern medium grain was up 20 cents to $12.50.

                                                                                1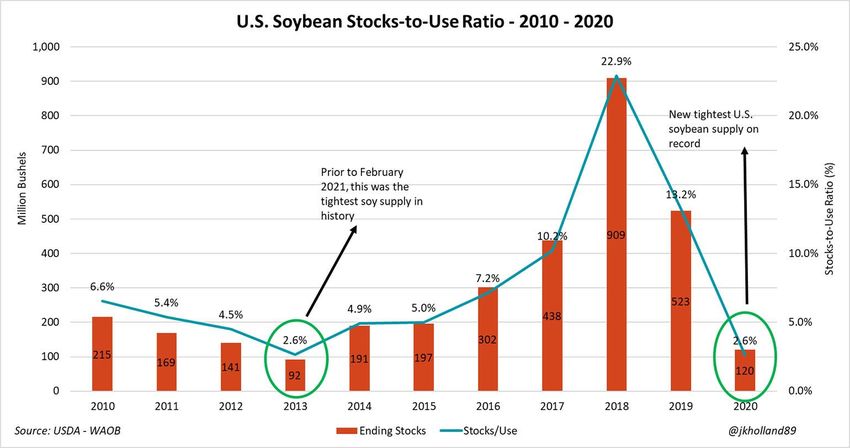
The 2020/21 U.S. cotton supply and demand forecasts show slightly higher exports and lower ending
stocks relative to last month. Production and domestic mill use are unchanged. The export forecast is
raised 250,000 bales to 15.5 million based on a strong pace of shipments to date. Ending stocks are now
estimated at 4.3 million bales, equivalent to 24 percent of total disappearance. The upland cotton
marketing year average price received by producers is projected at 68 cents per pound, unchanged from
January.
Commitment of Traders Report (COT) February 9, 2021 ___________________________________

Cash Market Basis Charts February 10, 2021______________________________________________

                                                    2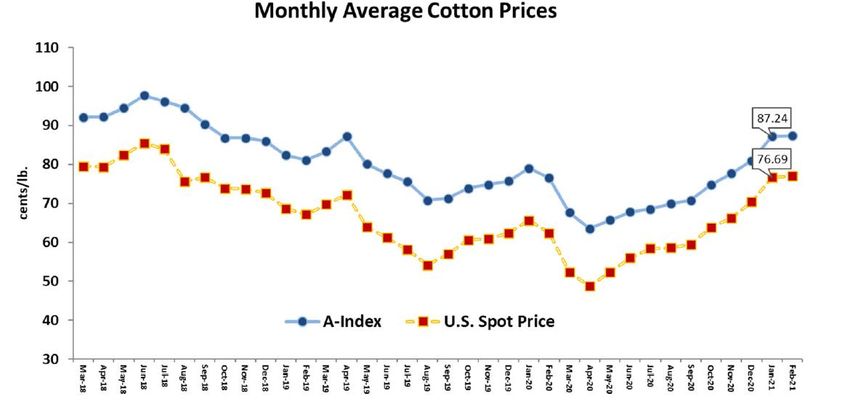
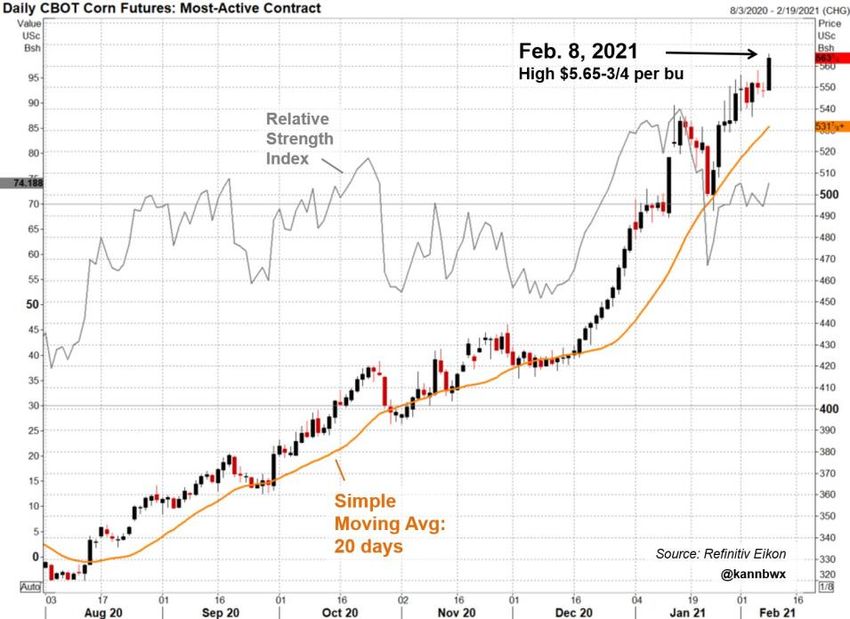
Corn________________________________________________________________________________
As reported on February 8th, the most-active corn futures hit another nearly eight year high ($5.65-3/4 per
bushel) a day ahead of the next supply and demand update from the USDA, which is expected to show
tightening U.S. and global stocks. Relative strength index continues to indicate overbought conditions.

Prior to the release of the latest WASDE report, March corn futures had carved out another new contract
high of $5.74 ¼. The corn market retreated after the USDA raised projected exports by only 50 million
bushels, and settled lower with nearby months posting the biggest losses. March corn settled down 7 1/2
cents to $5.56 ¼, May was down 7 ¾ cents to $5.54 ¼, and December corn was down 2 ½ cents to $4.55
¾. Contracts from March through September made contract highs overnight before retreating, and a 7 ½ -
year-high on a front-month basis. The market had already retreated prior to the USDA report, and that
report added pressure on the market. Corn could see some pressure but on a daily chart it will look like a
range bound market until we know more about the South American crop and US new crop acres. Chart
based support comes in at $4.40 for December corn.

                                                     3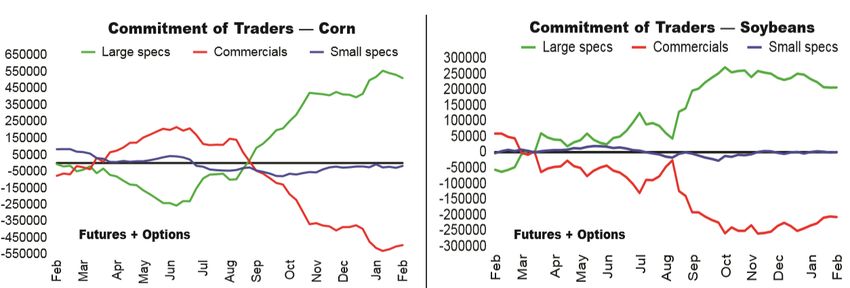
The most surprising estimate issued by the USDA today was the most closely-watched: corn exports. The
USDA had lowered its export estimate by 100 million bushels in January, but after China bought more
than 225 million bushels just last week, a big rebound was expected. Instead, the USDA raised exports
only to 2.60 billion bushels from 2.55 billion last month. The trade was expecting a bigger increase in
exports and a carryout of 1.392 billion bushels. The rest of the balance sheet was unchanged except for
the season average price, which was raised 10 cents to $4.30.
While China could, of course, cancel purchases down the line, the USDA's export revision is very
conservative, and the market's reaction thus far indicates the trade is not fully buying in. Nonetheless,
news received from the latest WASDE was not positive for corn.
U.S. ethanol exports to China are rebounding. November 2020 was the first significant month in terms of
volume of ethanol exports since March 2018, just before the trade war unfolded. U.S. ethanol exports to
China in 2020 totaled 80.5 million liters (1.6% of total). Those were all in November/December but well
off 2016 record of 750 million.

                                                      4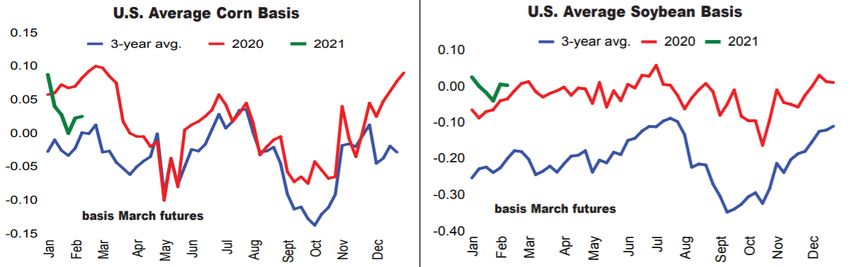
With increased domestic usage largely baked into prices, the lack of adjustment to South American
supplies sent corn futures prices over 1% lower in the moments following the February WASDE’s
release. The USDA trimmed 2020/21 U.S. corn ending stocks by another 50 million bushels from its
January estimates, spilling down to 1.502 billion bushels. Still, that was still notably higher than the
average trade guess of 1.392 billion bushels. The agency largely attributed this decline to a flurry of large
corn sales to China last month. Farm Futures reports that Chinese and unknown buyers have booked
nearly 260 million sales of old crop U.S. corn export shipments in the past month, offsetting weak ethanol
demand to send prices rising to seven-and-a-half-year highs over the past couple weeks.

South American weather is a limited market factor, which in itself is slightly bearish. Some delays will
continue in Brazil over the next 10 days to soybean harvesting and second-crop corn planting, but it will
not likely bring fieldwork to a halt, World Weather Inc. said. The biggest issues will be in northern Mato
Grosso. In Argentina, some near-term drying in southwest and central growing areas isn't welcome, but in
most cases subsoil moisture is sufficient enough to prevent further crop stress. Analysts were expecting
reductions to corn and soybean crops yesterday in both Brazil and Argentina by USDA, but the agency
left them unchanged.
Global coarse grain production for 2020/21 is projected marginally higher to 1,438.9 million tons. This
month’s foreign coarse grain outlook is for higher production, lower consumption, and greater ending
stocks relative to last month. Foreign corn production is up fractionally, with an increase for South Africa
more than offsetting a reduction for Paraguay. For South Africa, production is raised based on higher
indicated area. For Brazil, the corn production forecast is unchanged as greater area is offset by a
reduction in yield. Slow progress for second-crop planting in the Center-West dampens yield prospects
but very favorable prices boost area expectations.
Major global trade changes for 2020/21 include higher projected corn exports for the United States, India,
and South Africa. For 2019/20, Argentina and Brazil corn exports are raised for the local marketing year
ending February 2021 based on larger-than-expected late-season shipments. Corn imports for 2020/21 are
increased for China, with partly offsetting reductions for the EU-27+UK, South Korea, Japan, India,

                                                      5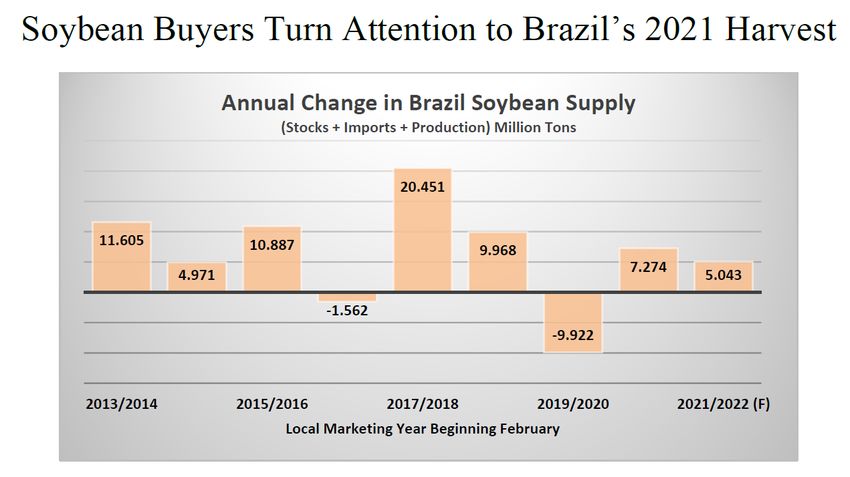
Saudi Arabia, and Turkey. China’s barley and sorghum imports are also higher this month, bringing total
coarse grain imports to 40.3 million tons. Foreign corn ending stocks for 2020/21 are up relative to last
month, mostly reflecting increases for China, South Africa, and Mexico that are partly offset by
reductions for Argentina and Brazil. Global corn ending stocks, at 286.5 million tons, are up 2.7 million
from last month.
Since the January WASDE report, major corn export bids continue to rise with the exception of
Argentina. Argentine bids are down $5/ton to $249 as above-average January rains ease supply concerns.
Brazilian bids are up $13/ton to $277 as the second-crop planting in Center-West is off to a slow start due
to delays in the soybean harvest. Black Sea bids are up $20/ton to $264 on continued strong demand from
China in conjunction with an export quota on Ukrainian corn. U.S. bids are up $11/ton to $251 on robust
sales and shipments, primarily to China.

U.S. exporters reported nearly 5.9 million tons of corn sales to China in January for delivery by the end of
August 2021. The volume alone implies that China imports for calendar year 2021 will again exceed its
tariff rate quota (TRQ), given that China will also buy corn from Ukraine and others. Last September,
China’s National Development and Reform Commission announced that the corn TRQ for 2021 remains
unchanged at 7.2 million tons.

                                                     6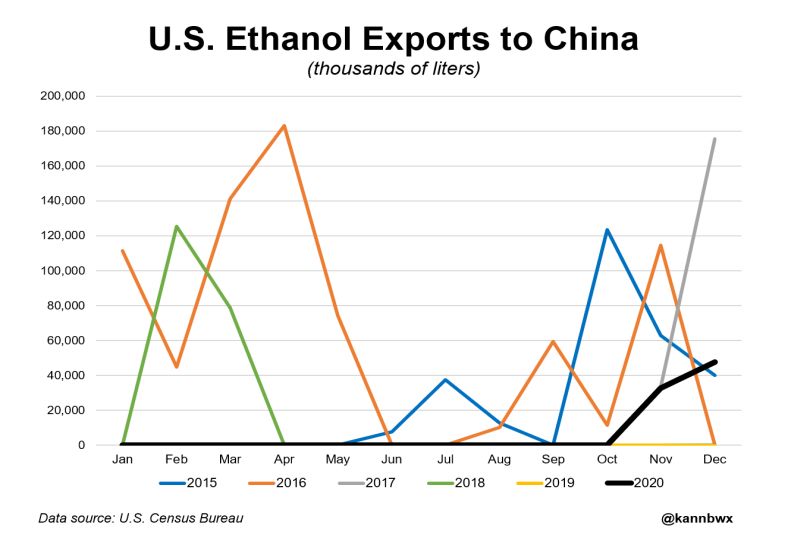
For 2020/21, U.S. total sales and shipments to China stand at a record 17.7 million tons at the end of
January. Reflecting the large volume, Chinese imports are raised 6.5 million tons from last month to 24.0
million. If realized, China would become the largest importer by a sizable margin. Chinese total
consumption is also forecast higher driven by feed and residual use with an assumption that imported corn
is primarily to satisfy robust feed demand in the swine sector. The forecast consumption for food, seed,
industrial (FSI), however, is trimmed based on significantly smaller exports of corn-based products such
as starch, corn gluten feed (CGF) and corn gluten meal (CGM), sweeteners, citric acid, and glutamic acid
for the October-December period. Even though milling data for China is not available publicly,
substantially smaller exports of various corn-based products and higher unit values are indicative of slow
milling activities.
Strong domestic prices could be squeezing margins for milling operations and weakening exports of corn-
based products, while stimulating corn imports to an unprecedented level. The sheer volume of China
imports certainly fuels global trade dynamics.

                                                    7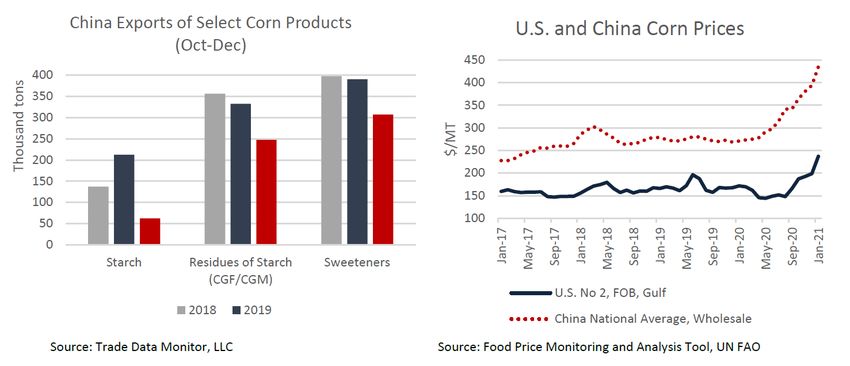
With record corn imports forecast this month at 24.0 million tons for 2020/21, China’s demand for
feedstuffs continues to rise as its swine herd recovers from African swine fever. High corn prices are
supporting record feed usage of both wheat and rice. Although primarily consumed as food grains, feed
use of these grains is rising with increased availability of old-crop wheat and rice from auctions at prices
competitive to domestic corn. Wheat nonfood use (feed and residual) for China in 2020/21 is forecast at a
record 30.0 million tons, more than 10 million higher than the previous year due to record auction
volumes of domestic wheat and stronger compound feed production. High domestic corn prices have
helped to drive these record auction volumes, with more than 12 million tons reported as sold in January.
Beginning in December, domestic wheat prices trended below corn for the first time in more than 6 years
(based on the national monthly average spot price).

                                                     8
Though rice is not normally used in feed due to its higher price, some feed mills in China are also
beginning to use it in feed rations as recent high corn prices have narrowed the premium that rice
typically holds. China has been auctioning older stocks of rice from state reserves at low prices, recently
targeting auctions specifically for feed use. Rice must be crushed by a state-owned enterprise and mixed
as an 85 percent rice and 15 percent wheat blend to ensure its use as feed. This rice-based feed is likely
used for poultry, given narrowing margins in that sector. Rice consumption is raised by 1.5 million tons
this month with much of the additional demand attributed to feed.
Demand for low-priced rice has also spurred higher imports in recent months, especially from Burma and
Pakistan. Additionally, China has begun to import broken rice from India for the first time in decades, to
be used for feed reportedly. With China’s domestic feed use rising, especially for older rice from the
reserves, exports that would otherwise go to price-sensitive markets are expected to decline. Expanded
use of wheat and rice as feed ingredients is expected as a short-term solution to current strong demand but
is not expected to persist in the long-term. This present situation is only viable if wheat and rice are
released into the market in large enough quantities and at significant price discounts to corn. As old-crop
stocks are drawn down, the use of these two grains for feed will likely diminish.
Soybeans_____________________________________________________________________________
As expected, the report featured a modest increase in U.S. soybean sales of 20 million bushels to 2.25
billion bushels, sending U.S. ending stocks to the tightest level in seven years, at 120 million bushels.
That is down from 523 million bushels in 2019-20. The decline was about as expected, with many traders
now assuming that soybeans will need to rise to discourage further demand. There was no increase in
either crush or imports, which some in the trade feel will be necessary at some point.

Futures rallied as the USDA further lowered its already low carryout estimate for 2020/21. Soybeans
ended up 10 to 14 cents, settling at $14.01 ¾ in the March after trading a range of $13.77 ½ to $14.09,
settling at $13.98 ¾ in the May, and $11.90 ¾ in the November. Unlike corn, which saw new contract
highs in old crop months as well as September, soybeans remain a bit off their contract highs set in
January. For March soybeans, that high is up at $14.33. In November soybeans the high is up at $12.03 -

                                                     9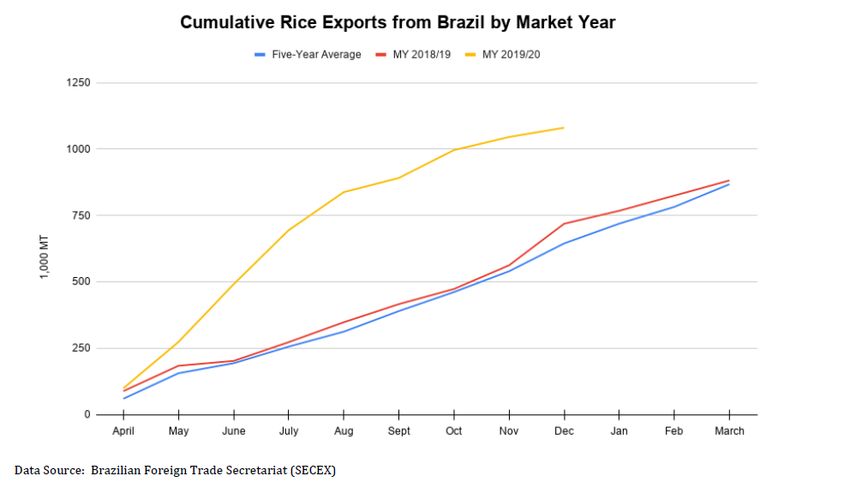
not far from today's close, particularly in a market where concerns about 2021 planted acreage is going to
be high. Soybean meal ended up $1 to $2, with March settling at $438.70, and December at $377.50.
Soybean oil gained 70 to 90 cents, settling at 46.52 in the March, 45.77 in the May and 42.00 in the
December.
March beans closed above $14.00 for the first time since January 15th with momentum studies higher or
turning higher. The key will be follow-through gains to finish the week. Beans probably still need to close
above the Jan. 13 contract high at $14.36 ½ to turn the trend higher.
StoneX reports that the big rally in the CBOT may be on pause until production is confirmed in South
America. China will go on their Lunar New Year soon and exports will slow down during their holiday
period. New crop acres in the US will be debated. The path of least resistance is a lower grind as traders
closely watch South American weather and yield reports.
USDA projected the 2020-21 carryout at 120 million bushels, down from 140 million last month and
slightly below the average analyst estimate of 123 million. The reduced carryout was due to increased
exports, based on the export pace to date and a sluggish Brazil harvest pace. If realized, it would be the
lowest carryout in seven years. While the Brazil harvest delays should be a fleeting market factor and a
large crop will come into the pipeline eventually, the bottom line is there's not much room for error for
soybeans right now. Rebuilding supplies will take a both big jump in planted U.S. acres and strong yields.
The concerns about Brazilian harvest delays, and about a dry season in Argentina, were not reflected in
today's crop estimates. The USDA left their projected estimate for the Brazilian soybean crop unchanged
at 133.0 million metric tons and Argentina unchanged at 48.00 million metric tons. Traders had on
average been expecting the Brazil crop at 132.46 million metric tons and Argentina's at 47.64 million
metric tons.
As U.S. soybean supplies seasonally tighten, buyers are turning to South America, particularly Brazil,
where harvest is getting underway. Production in Brazil is currently forecast at 133 million tons, up 7
million from last year. However, a lower carry-in reduces year-over- year supply growth to 5 million tons.
This opens the door for a repeat of last year’s market conditions where limited availability of Brazilian
soybeans late in 2021 reduces export competition for U.S. new-crop soybeans.
Global demand remains strong with ship lineups in Brazil exceeding 11 million tons in early February.
However, a portion of the lineup may also reflect this year’s delayed harvest. Reports in Mato Grosso
show soybean maturity running behind last year, which translates into a later harvest and, therefore,
slower movement of soybeans to port.
The large lineups also point to a quick run-up in export volume over the next few months. Brazilian
Federal Highway BR163 is now completely paved allowing easier transport to northern ports and
potentially increasing volume shipped through these ports. A complete utilization of ports both north and
south would allow monthly soybean export volume to exceed historic norms and potentially raise total
export volume through September compared to 2020. With strong export and domestic demand coupled
with the smaller supply growth forecast for 2021, an increased export pace would lead to a quicker draw-
down in supplies by October. Consequently, U.S. producers would face limited competition from
Brazilian exports at harvest, similar to the situation observed in the last quarter of 2020.

                                                    10
Export prices for the three largest soybean exporters rose in January despite retreating in the second half
of the month. Prices in the United States and Argentina strengthened for the eighth consecutive month,
reaching the highest levels since June 2014 and March 2014, respectively. Prices continued to rise in the
first half of the month on strong export demand, tightening global stocks, and dry weather in South
America. Monthly gains were partially offset by lower prices in the second half of January owing to
rainfall in South America.
As of January 28, 2021, cumulative global U.S. soybean shipments hit a record of 47.5 million tons. This
record pace is driven primarily by higher shipments to China (32.4 million tons), nearly triple, from the
11same month in 2019/20. Outstanding sales to all destinations are more than double those of this time last
year, led by China. Due to growth in exports and outstanding sales to China, total global export sales
commitments reached a new record of 58.7 million tons, up 7.9 million tons from the previous record in
2016/17.
Rice_________________________________________________________________________________
Rice futures ended mostly lower in light trade. March rice settled down 5 ½ cents to $12.91 ½, after
trading a range of $12.84 to $13.04 ½. May rice was down 3 ½ cents to $13.19 ½, and September rice
settled flat at $12.81 ½. Technically, the market had traded a range of $12.76 ½ to $13.41 when it plunged
last Wednesday, and has remained well within that range since, mostly consolidating in the lower half of
that range.
The outlook for 2020/21 U.S. rice this month calls for stable supplies and domestic use, lower exports,
and higher ending stocks. Exports are lowered by 1.0 million cwt to 93.0 million, all for long-grain on
the continued sluggish pace of sales and shipments for long-grain milled rice. Projected 2020/21 all rice
ending stocks are raised by an equivalent amount to 39.4 million cwt.
Over the past month, U.S. and Uruguayan quotes hovered around $625/ton and $620/ton respectively.
Asian prices trended higher overall on stronger demand in Asian and African markets. Thai quotes rose to
$557/ton as exporters source white rice for shipments that were delayed due to container shipment
shortages. Vietnamese quotes were up slightly to $516/ton, the highest in nearly a decade as supplies
tighten ahead of the next harvest. Pakistani quotes escalated to $452/ton, while Indian quotes surged to
$415/ton, amid strong demand from the Bangladesh government and private sector.
12Creed Rice reports that upon examination of the most recent dismal milled rice export numbers, they
stress just how critical for the U.S. rice industry a potential Iraqi tender could be. The USDA export sales
reported that most all of the tonnage was either paddy, or Calrose business, with the exception of one
14,500 metric ton vessel for Haiti- the only steady destination market for sales of long grain milled rice,
in volume, over the past 15 months. This is what we have been outlining for months; last year was fueled
by heavy paddy demand, a short crop, and virtually no appreciable competition out of MERCOSUR in
U.S. core markets abroad.
Pertaining to Iraq, note the position of U.S. in the list of offers below. Pakistan is currently the cheapest
offer from near east suppliers, Thailand is also proffering some very surprising offers, given their supply
and demand situation, Brazil (followed by Uruguay) are the most competitive rice exporters from the
Western Hemisphere, with the U.S. being tagged with the distinction of having the highest priced rice on
the tender, with the exception of Indian basmati.
13What this all indicates is that U.S. rice is currently priced out of key markets; as such, it risks losing
valuable market share; market share that has not provided even an opportunity for 18 months. As far as
the MERCOSUR region is concerned, aggressive offers out of Brazil are what most catches the eye at the
moment. Whilst, Brazil is often (year in and year out) both an importer and an exporter similar to China
in a lot of ways, it is quite surprising to see an offer, much less, multiple offers. It should be duly noted
that Brazil has had issues in the past with execution at load port and destination grades.
The USDA Post in Brazil raised their MY 2019/20 export forecast to 1.2 metric tons, up 200,000 metric
tons from Post’s projection in September, based the rapid pace of trade. The weak Brazilian real (BRL)
has continued to make Brazilian rice more attractive on the international market. Post maintains its MY
2020/21 export forecast at 700,000 metric tons, based on the expanded planting for the current crop,
paired with a return to trend yields.
As noted above, weakness in the BRL has improved profitability for rice producers, along with enhancing
the attractiveness of exports as international sales are normally denominated in U.S. dollars. Brazil has
exported above-average volumes of rice from April 2020, when the bulk of the MY 2019/20 crop hit the
market, through to August 2020, when stocks began to dwindle. Brazil has exported more than 1 million
metric tons of rice (milled equivalent) in the first nine months of MY 2019/20 (April–December 2020).
That is 168 percent larger than the five-year average for the same period. In fact, Brazil has already
exported significantly more rice in MY 2019/20 than all of MY 2018/19, even though trade data is
available for only three-fourths of the current MY.
In recent years, Venezuela has risen to become one of the largest export markets for Brazilian rice, that
trend for MY 2019/20 continues with large purchases of both paddy rice and white rice. With all of the
economic and social instability in Venezuela, Brazil’s abundant production and relative geographic
proximity have served to make it a convenient rice supplier. Because the BRL remains weak against the
dollar, Brazilian commodities continue to be relatively cheap, and Venezuela has repeatedly turned to its
South American neighbor to purchase staple foods like rice. From April to December 2020, Brazil
exported to Venezuela nearly 189,000 metric tons (milled rice equivalent) of paddy and white rice,
accounting for nearly one-fifth of total exports during that period.
14So far in MY 2019/20, Brazil has also sold more than 90,000 MT of paddy rice to Costa Rica, along with
another 89,000 metric tons to Mexico (between May and July). Brazil sold one-off paddy rice shipments
in excess of 25,000 metric tons to Honduras and Turkey. Many sales were likely a direct consequence of
the devalued BRL.
Between April and December 2020, more than 410,000 MT of white rice was exported by Brazil,
including 90,000 metric tons to Peru, 37,000 metric tons to South Africa, and 30,000 metric tons to the
United States. Broken rice typically makes up one of the largest shares of Brazilian exports, and MY
2019/20 is no different, with broken rice accounting for almost a third of all exports so far this market
year. The largest share of these exports was destined for countries in Africa. Between April and
December 2020, Brazil exported 118,000 metric tons of broken rice to Senegal, 80,000 metric tons to
Gambia, and 75,000 metric tons to Sierra Leon.
The 2020/21 global outlook for rice calls for larger supplies, higher consumption, increased trade, and
reduced stocks. Rice supplies are raised 0.8 million tons to 682.3 million, primarily on higher rice
production for Indonesia, Sri Lanka, and the Philippines as global production is raised to a record high
504.0 million. World 2020/21 consumption is increased 2.2 million tons to a record 504.2 million. The
largest increase is for China, where more old-crop rice is expected to be fed due to rising domestic corn
prices.
World trade is raised 0.9 million tons to 46.3 million as higher exports by India more than offset reduced
exports by Thailand. India’s exports are increased to a record 15.0 million tons as its supplies remain
ample and its export prices continue to be the most competitive among major exporters. Projected
2020/21 world ending stocks are lowered 1.4 million tons to 178.1 million, primarily on higher domestic
use for China and larger exports for India.
Export prices for Indica rice have firmed up across all Asian export markets since November, on the
backdrop of tight supply prospects in Thailand, given the poor outlook for irrigation for its offseason crop
and in Vietnam where concerns over salt-water intrusion and irrigation supplies for the soon to be
harvested 2021 winter-spring crop added to seasonal tightness. The bullish undertone in both markets
amplified interest in more completely priced rice from India and Pakistan, halting the six-month
downward streak in quota from both countries. This all comes at a time of heightened logistical
bottlenecks associated with container shortages across Asia and as exporters strive to complete orders.
The latter from Chinese traders sourcing supplies ahead of New Year festivities, but also from the
Philippines following a late November official rule (eased about a month later) which brought forward the
deadline for licensed imports from most ASEAN suppliers to arrive in the country to 35 days. In the
parboiled segment, sentiment was also influenced by a series of purchases by government of Bangladesh,
its approval of lower duties on private sector imports, on condition that traders market supplies promptly,
as well as December news of Nigeria reopening its land borders to trade. Amid quieter trading activities,
long-grain quotations have moved little in the Americas, except in Brazil where these have eased some
more on ebbing domestic demand ahead of the 2021 harvest.
Cotton______________________________________________________________________________
The USDA’s latest WASDE was friendly for cotton with a carryout of 4.3 million bales, down from 4.6
million on increased exports. The carryout would be down from 7.25 million in 2019-20. The season
average price was left unchanged at 68 cents. The USDA’s February forecast shows slightly lower
beginning stocks. Higher production and consumption are largely offsetting. Ending stocks are down
marginally. Higher production in China, Australia, and Pakistan more than offsets lower production in
India. Production in China is raised sharply on higher-than‐normal last season ginnings. Consumption is
15raised in China and India on stronger expected recovery in mill demand. Global trade reflects these
changes and is raised slightly on higher imports for China. The U.S. forecast shows higher exports and
lower stocks and the season‐average farm price is unchanged at 68 cents per pound.
Cotton futures were strong before the USDA report and even stronger after, making fresh contract highs
and a 2 ½ year high on a front-month basis. March cotton ended up 2.65 cents to 86.93, after trading a
range of 84.40 to 87.13. May cotton gained 2.53 cents to $88.13, and December cotton gained 1.55 cents
to 83.67. The market had already made fresh contract highs before the report, and extended gains after,
although the report itself only looked mildly bullish. For nearby futures, there is no clear resistance
preventing a test of the 90-cent level, and from a marketing perspective we are happy to stand aside and
watch for now.
The cotton bulls have the strong overall near-term technical advantage and gained more power today. A
10-month-old uptrend is in place on the daily bar chart. The next upside price objective for the cotton
bulls is to produce a close in March futures above solid technical resistance at 90.00 cents. The next
downside price objective for the cotton bears is to close prices below solid technical support at 82.50
cents. First resistance is seen at today’s contract high of 87.06 cents and then at 88.00 cents. First support
is seen at 85.00 cents and then at 84.00 cents.
The A‐index and U.S. spot price have stalled after 9 months of steady increase as nearby mill demand
softens in light of the higher prices. Both remain near the highest levels since April 2019.
The 2020/21 world cotton forecasts include higher production, consumption, and imports, led by changes
in China. World production is projected 1.3 million bales higher this month, with China’s forecast raised
by 1.5 million bales as the daily rates of both ginnings and inspections in Xinjiang continue to show
unusual late-season strength. Reports from China continue to suggest 2020/21 cotton area in Xinjiang was
little changed from last year, but government classing data now indicates yields could be about 10 percent
higher, while lower in Eastern China. India’s production estimate is reduced 500,000 bales on increasing
evidence of pest infestation, while Pakistan is 200,000 bales higher and Australia 100,000 bales higher.
World consumption is projected 1.5 million bales higher this month, with China’s forecast 1.0 million
16bales higher reflecting growing domestic textile demand and exports. Much smaller increases are also
included for India, Pakistan, Bangladesh, and Turkey, while the outlook this month is for lower
consumption in Indonesia and Thailand. World trade is projected 350,000 bales higher than last month,
with imports 500,000 bales higher for China, and smaller, partially offsetting changes elsewhere. World
ending stocks are almost 600,000 bales lower this month, at 95.7 million bales, 3.2 million bales lower
than in 2019/20.
India’s Minimum Support Price program (MSP) continues to purchase significant volumes of cotton amid
expectations for record sales in 2020/21. As of February 1st, the Cotton Corporation of India (CCI) had
purchased the equivalent of 6.9 million bales (480 lbs.) of lint cotton from the 2020/21 crop; this
represented about 40 percent of the cotton sold to date by farmers and 25 percent of the USDA production
forecast. MSP buying continues with no fixed end date.
In 2019/20, buying started in November and continued into July. MSP purchases totaled roughly 9.8
million bales, about one‐third of the total crop. MSP sales from the 2019 crop started in June and continue
to date, with an estimated 550,000 bales of 2019 crop cotton still in MSP stocks. Sales of 2020/21 crop
started in January with 1.1 million bales sold by the February 1st.
The last time a significant portion of the harvest was bought—2014/15— about 30 percent of the crop
was procured under the MSP. In the interim, MSP buying has been insignificant until 2019/20 and
2020/21.
In both 2014/15 and 2019/20, MSP operations removed large volumes of cotton from the market during
the peak harvest season (see chart below.) Like the U.S. Marketing Loan (ML) program, the effect of the
MSP program is that it delays cotton from entering the commercial market, thus supporting prices while
also providing cash to farmers. In the ML program, U.S. producers determine when the cotton is returned
to the market, while the Indian government determines that timing under the MSP.
17India operates MSP programs for over 20 commodities with MSP prices for all commodities set at 150
percent of the estimated cost of production. Each crop year, an MSP price is announced early in the
season. The MSP for cotton is designed to support farm prices by buying seed cotton from farmers at a
guaranteed price. When the MSP is active, farmers are reluctant to sell to commercial gins below the
MSP price which simply encourages gins to buy at or near the MSP price. The MSP for medium staple
cotton for the 2020 crop is 5,515, rupee/quintal. MSP buying is done by various state‐owned entities; for
cotton, it is primarily the Cotton Corporation of India (CCI).
Macroeconomic Indicators______________________________________________________________
With vaccines being distributed and the numbers of daily new coronavirus infections coming down,
interest rates are slowly creeping back upward and the fear premium in gold is coming down -- signs of a
slowly reviving economy, which is helping the U.S. Dollar Index find support (DTN ProphetX chart).
The index has been in a long downtrend and hasn't traded above the 100-day average since May 27,
pressured by the Federal Reserve's commitment to keep interest rates near zero in an effort to help an
economy stifled by COVID-19. Given the gradual improvements in the economy and the recent upward
turn in the weekly stochastic indicator, the dollar index's low of 89.21 on Jan. 6 is likely to stand as
intermediate or possibly even long-term support. Prices need to close above resistance at 92.00 to confirm
a long-awaited break in the downtrend.
Since August, the 10-year T note yield has been creeping gradually higher, showing signs of a gradually
improving economy, even while the Fed remains committed to keeping the federal funds rate target near
zero. This upward trend has potential to keep going higher and is one of the reasons the U.S. Dollar Index
is finding support.
18PLC Farm Program Payment Projections - 2020 CY________________________________________
Below are projections for the Price Loss Coverage (PLC) program national Marketing Year Average
(MYA) prices for the 2020/21 crop year. A PLC program payment is triggered when the MYA price for a
commodity falls below that commodity’s effective reference price. The payment rate is then multiplied by
the farm’s program yield and is made on 85% of base acres.
Covered Commodity 2020/21 MYA Price* Effective Reference Price 2020 CY PLC Payment Rate
Corn $4.30 $3.70 --
Grain Sorghum $4.80 $3.95 --
Long Grain Rice $12.20 $14.00 $1.80
Medium Grain Rice $12.50 $14.00 $1.50
Seed Cotton $0.3464 $0.3670 $0.0206
Soybeans $11.15 $8.40 --
Wheat $5.00 $5.50 $0.50
*national marketing year average (MYA) prices reflect the midpoint price level from the February 9, 2021 WASDE report.
ARC-CO Farm Program Price Parameters - 2020 CY_______________________________________
The table below presents the five-year Olympic average national marketing year average prices for
purposes of the Agriculture Risk Coverage (ARC-CO) program in addition to the projected national
MYA price used for in the calculation of actual county (parish) revenue. An ARC-CO program payment
is triggered when the actual parish revenue for a particular commodity falls below that commodity’s
historical revenue guarantee. ARC-CO farm program payments are capped at 10% of the benchmark
revenue. The payment rate is then made on 85% of base acres. No individual farm level production data is
used for the purposes of ARC-CO program payment calculation.
Covered Commodity 2020/21 MYA Price* 2020 ARC-CO Benchmark Price (5-yr Olympic Average)
Corn $4.00 $3.70
Grain Sorghum $4.40 $3.95
Long Grain Rice $11.80 $14.00
Medium Grain Rice $12.00 $14.00
Seed Cotton $0.3339 $0.3670
Soybeans $10.55 $9.25
Wheat $4.70 $5.50
*national marketing year average (MYA) prices reflect the midpoint price level from the February 9, 2021 WASDE report.
The 2018 Farm Bill now allows producers to make an annual election for Agriculture Risk Coverage (ARC) and
Price Loss Coverage (PLC). The deadline to change your election with Farm Service Agency is March 15, 2021
which will be the program elected for the crop harvested in 2021 (Marketing Year 2021/2022).
Sources: USDA Agriculture Market Service (AMS), USDA Foreign Agriculture Service (FAS), USDA Farm Service Agency (FSA), USDA National Agriculture
Statistics Service (NASS), USDA Economic Research Service (ERS), USDA FAS GAIN Report, USDA Office of Communications, USDA World Supply Demand
Estimates (WASDE), AgDay, Ag Fax Media, Ag Market Network, Agri-Pulse, Ag Web, Agricultural Market Information System (AMIS), Allendale, American Farm
Bureau Federation, Bloomberg News, CME Group, Cotton Grower, Cotton Incorporated, Cotton Outlook, Creed Rice Report, Delta Farm Press, DTN Progressive
Farmer, Farm Futures, Fiber 2 Fashion, International Grains Council, Iowa State University, LSU AgCenter, National Cotton Council, Peterson Institute of
International Economics, Pro Farmer, Reuters, Rice Market Letter, Stone X, Southeast Farm Press, Successful Farming, University of Arkansas, University of Illinois,
U.S. Grains Council, USA Rice Federation, U.S. Soybean Export Council, and the Wall Street Journal.
Contact Michael Deliberto at 225-567-7267 or by email mdeliberto@agcenter.lsu.edu
Department of Agricultural Economics and Agribusiness
Louisiana State University Agricultural Center, Baton Rouge, LA
19You can also read