Stabilization Wedges: A Concept & Game
←
→
Page content transcription
If your browser does not render page correctly, please read the page content below
Author: Roberta Hotinski
                                                                                              Last updated September 2011

Stabilization Wedges:
A Concept & Game
The Carbon Mitigation Initiative is a joint project of Princeton
University, BP, and Ford Motor Company to find solutions to the
greenhouse gas problem. To emphasize the need for early action,
Co-Directors Robert Socolow and Stephen Pacala created the concept
of stabilization wedges: 25-billion-ton “wedges” that need to be cut
out of predicted future carbon emissions in the next 50 years to avoid
a doubling of atmospheric carbon dioxide over pre-industrial levels.

The following pages contain:
 • An introduction to the carbon and climate problem and the stabilization wedge concept (pp. 1-3)
 • Descriptions of currently available mitigation tools that have the capacity to reduce future emissions by at least one
     wedge (pp. 4-8)
 • Materials and instructions for carrying out the “Stabilization Wedges Game,” an activity that drives home the scale of
     the carbon mitigation challenge and the tradeoffs involved in planning climate policy (pp. 9-16)

For more information about CMI, contact

      Carbon Mitigation Initiative              You can download a free up-to-date copy of this guide and
      Princeton Environmental Institute         view additional resources at our wedge website:
      Princeton University
      Princeton, NJ 08544                       http://cmi.princeton.edu/wedges/
      USA
                                                We hope to revise these materials with your input! If you have ques-
      voice: (609) 258-3832                     tions or feedback, please contact Dr. Roberta Hotinski, Consultant to
      fax: (609) 258–6818                       CMI, at hotinski@princeton.edu
      http://cmi.princeton.edu

The Carbon and Climate Problem
Evidence continues to accumulate that carbon dioxide, or CO2, from fossil fuel burning is causing dangerous interference
in the climate. . Nine of the ten warmest years on record have occurred since 2001 and the ten warmest years have oc-
curred since 1998. Tropical glaciers with ice thousands and tens of thousands years old are disappearing, offering graphic
rebuttal to claims that the recent warming is part of a natural cycle. Models predict that, without action to curb the
growth of greenhouse gases in the atmosphere, we risk triggering catastrophe -- cessation of the dominant pattern of
ocean circulation, loss of the West Antarctic ice sheet, or a several-fold increase in category-five hurricanes.

CO2 and some other gases in the atmosphere change the climate by letting sunlight pass through the atmosphere and
warm the planet, but hindering the escape of heat to outer space (a phenomenon popularly known as “the greenhouse
effect”). By burning fossil fuels, which are composed mainly of hydrogen and carbon, we add CO2 to the atmosphere.
The Earth’s atmosphere currently contains about 800 billion tons Fossil Fuel
Burning
of carbon as CO2, and combustion of fossil fuels currently adds
about 8 billion tons of carbon every year. If we think of the 8 ATMOSPHERE
billion
atmosphere as a bathtub, these carbon emissions are like water tons go in 4 billion tons added
coming out of the tap to fill the tub (Figure 1). The ocean and every year
land biosphere act as two drains for this bathtub – carbon can be 800
taken out of the atmosphere by being dissolved in the surface billion tons carbon
ocean or being taken up by growing forests. However, these two
“drains” only take out about half the carbon we emit to the atmos-
phere every year. The remainder accumulates in the atmosphere Ocean Land Biosphere (net)
(currently at a rate of roughly 4 billion tons per year), so the level 2 + 2 = 4 billion tons go out
of carbon in the tub is rising.
Figure 1. The atmosphere as a bathtub, with current
The fossil fuel tap was “opened” with the Industrial Revolution. annual inputs and outputs of carbon. The level in the
In pre-industrial times, the atmosphere contained only about 600 tub is rising by about 4 billion tons per year.
billion tons of carbon, 200 billion tons less than today (Figure 2).
As an illustration of the importance of CO2 to the Earth’s climate,
ice core records show that past atmospheric carbon changes of a
ATMOSPHERE
similar magnitude have meant the difference between Ice Ages
and the familiar warmer conditions of the past 10,000 years. “Doubled” CO2 1200 (570)
Today 800 (380)
Observations indicate that the carbon already added to the at- Pre-Industrial 600 (285)
mosphere has raised the global average temperature by around
Glacial 400 (190)
Billions of tons of carbon
1º Fahrenheit since the 19th century, and almost every year the
billions of ( ppm )
tons carbon
fossil fuel tap is opened wider. An average of many forecasts
predicts that we’ll be adding 16 billion tons of carbon per year Figure 2. Past, present, and potential future levels of
to the “bathtub” in 50 years, twice today’s rate, unless action is carbon in the atmosphere in two units. 2.1 billions of
taken to control carbon emissions. If we follow this path, the tons of carbon = 1 part per million (ppm).
amount of carbon in the atmosphere will reach 1200 billion tons -
- double its pre-industrial value – well before the end of this century, and will continue to increase into the fu-
ture. As a result, the Earth’s temperature is expected to rise at a rate unprecedented in the last 10,000 years. How can
we get off this path?
An Introduction to Stabilization Wedges
The “stabilization wedges” concept is a simple tool for convey-
ing the emissions cuts that can be made to avoid dramatic cli-
mate change. Toward
Tripling
Billions of Tons CO2
16
We consider two futures - allowing emissions to double Carbon Emitted p”
per Year am
versus keeping emissions at current levels for the “
=
r
next 50 years (Figure 3). The emissions-doubling path pat
h
t
(black dotted line) falls in the middle of the field of most rr
en
Stabilization
estimates of future carbon emissions. The climb approxi- Cu
Triangle
mately extends the climb for the past 50 years, during Historical
8
which the world’s economy grew much faster than its car- emissions Flat path
bon emissions. Emissions could be higher or lower in 50
Avoid
Doubling
years, but this path is a reasonable reference scenario.
CO2
1.6
The emissions-doubling path is predicted to lead to
significant global warming by the end of this century.
This warming is expected be accompanied by decreased 0
crop yields, increased threats to human health, and more 1950 2000 2050
frequent extreme weather events. The planet could also
face rising sea-level from melting of the West Antarctic Figure 3. Two possible emissions scenarios define the
Ice Sheet and Greenland glaciers and destabilization of “stabilization triangle.”
the ocean’s thermohaline circulation that helps redistrib-
ute the planet’s heat and warm Western Europe.
2In contrast, we can prevent a doubling of CO 2 if we can keep emissions flat for the next 50 years,
then work to reduce emissions in the second half of the century (Figure 3, orange line). This path is predicted
to keep atmospheric carbon under 1200 billion tons (which corresponds to about 570 parts per million (ppm)),
allowing us to skirt the worst predicted consequences of climate change.
Keeping emissions flat will require cutting projected carbon output by about 8 billion tons per year
by 2060, keeping a total of ~200 billion tons of carbon from entering the atmosphere (see yellow triangle in
Figure 3). This carbon savings is what we call the “stabilization triangle.”
The conventional wisdom has been that only revolutionary new technologies like nuclear fusion could enable
such large emissions cuts. There is no reason, however, why one tool should have to solve the whole problem.
CMI set out to quantify the impact that could be made by a portfolio of existing technologies deployed on
a massive scale.
To make the problem more tractable, we divided the
stabilization triangle into eight “wedges.” (Figure 4) A 16
wedge represents a carbon-cutting strategy that has the g
pa
th 8 wedges
in
potential to grow from zero today to avoiding 1 billion tons bl are needed to
ou build the
s -d
on
of carbon emissions per year by 2060, or one-eighth of the
stabilization
si
is triangle
Em
stabilization triangle. The wedges can represent ways of
Stabilization
either making energy with no or reduced carbon emissions Triangle
(like nuclear or wind-produced electricity), or storing 1 wedge
carbon dioxide to prevent it from building up as rapidly in 1 “wedge”
avoids
the atmosphere (either through underground storage or
1 billion tons of
8 carbon emissions
Flat path
per year by 2055
biostorage). 2000 2050
Keeping emissions flat will require the world’s Figure 4. The eight “wedges” of the stabilization triangle.
societies to “fill in” the eight wedges of the stabili-
zation triangle. In CMI’s analysis, at least 15 strategies are available now that, with scaling up, could
each take care of at least one wedge of emissions reduction. No one strategy can take care of the whole trian-
gle -- new strategies will be needed to address both fuel and electricity needs, and some wedge strategies
compete with others to replace emissions from the same source -- but there is already a more than adequate
portfolio of tools available to control carbon emissions for the next 50 years.
Wedge Strategies Currently Available
The following pages contain descriptions of 15 strategies already available that could be scaled up over the next 50 years
to reduce global carbon emissions by 1 billion tons per year, or one wedge. They are grouped into four major color-
coded categories:
Efficiency & Conservation Nuclear Energy
Increased transport efficiency Nuclear electricity
Reducing miles traveled
Increased building efficiency
Increased efficiency of electricity production Renewables and Biostorage
Wind-generated electricity
Fossil-Fuel-Based Strategies Solar electricity
Fuel switching (coal to gas) Wind-generated hydrogen fuel
Fossil-based electricity with carbon capture & storage (CCS) Biofuels
Coal synfuels with CCS Forest storage
Fossil-based hydrogen fuel with CCS Soil storage
Each strategy can be applied to one or more sectors, indicated by the following symbols:
= Electricity Production, =Heating and Direct Fuel Use, =Transportation, = Biostorage
3Increased Efficiency & Conservation
1. Transport Efficiency
A typical 30 miles per gallon (30 mpg) car driving 10,000 miles per year emits a ton of carbon into the air
annually. Today there are about about 600 million cars in the world, and it’s predicted that there will be
about 2 billion passenger vehicles on the road in 50 years. A wedge of emissions savings would be
achieved if the fuel efficiency of all the cars projected for 2060 were doubled from 30 mpg to 60
mpg. Efficiency improvements could come from using hybrid and diesel engine technologies, as well as
making vehicles out of strong but lighter materials.
Cutting carbon emissions from trucks and planes by making these engines more efficient can also help with
this wedge. Aviation is the fastest growing component of transportation.
2. Transport Conservation
A wedge would be achieved if the number of miles traveled by the world’s cars were cut in half.
Such a reduction in driving could be achieved if urban planning leads to more use of mass transit and if elec-
tronic communication becomes a good substitute for face-to-face meetings.
3. Building Efficiency
Today carbon emissions arise about equally from providing electricity, transportation, and heat for industry
and buildings. The largest potential savings in the buildings sector are in space heating and cooling, water
heating, lighting, and electric appliances.
It’s been projected that the buildings sector as a whole has the technological and economic potential to cut
emissions in half. Cutting emissions by 25% in all new and existing residential and commercial
buildings would achieve a wedge worth of emissions reduction. Carbon savings from space and wa-
ter heating will come from both end-use efficiency strategies, like wall and roof insulation, and renewable
energy strategies, like solar water heating and passive solar design.
4. Efficiency in Electricity Production
Today’s coal-burning power plants produce about one-fourth of the world’s carbon emissions, so increases in
efficiency at these plants offer an important opportunity to reduce emissions. Producing the world’s cur-
rent coal-based electricity with doubled efficiency would save a wedge worth of carbon emis-
sions.
More efficient conversion results at the plant level from better turbines, from using high-temperature fuel
cells, and from combining fuel cells and turbines. At the system level, more efficient conversion results from
more even distribution of electricity demand, from cogeneration (the co-production of electricity and useful
heat), and from polygeneration (the co-production of chemicals and electricity).
Due to large contributions by hydropower and nuclear energy, the electricity sector already gets about 35%
of its energy from non-carbon sources. Wedges can only come from the remaining 65%.
Suggested Link:
IPCC Working Group III Report "Mitigation of Climate Change", Chapters 4, 5 & 6
http://www.ipcc.ch/publications_and_data/publications_ipcc_fourth_assessment_report_
wg3_report_mitigation_of_climate_change.htm
4Carbon Capture
Carbon Capture &
& Storage
Storage (CCS)
(CCS)
If the CO2 emissions from fossil fuels can be captured and stored, rather than vented to the atmosphere, then the world
could continue to use coal, oil, and natural gas to meet energy demands without harmful climate consequences. The
most economical way to pursue this is to capture CO2 at large electricity or fuels plants, then store it underground. This
strategy, called carbon capture and storage, or CCS, is already being tested in pilot projects around the world.
5. CCS Electricity
Today’s coal-burning power plants produce about one fourth of the world’s carbon emissions and are large
point-sources of CO2 to the atmosphere. A wedge would be achieved by applying CCS to 800 large (1
billion watt) baseload coal power plants or 1600 large baseload natural gas power plants in 50
years. As with all CCS strategies, to provide low-carbon energy the captured CO2 would need to
be stored for centuries.
There are currently 3 pilot storage projects in the world, which each store about 1 million tons of carbon un-
derground per year. Storing a wedge worth of emissions will require 3500 times the capacity of one of these
projects.
6. CCS Hydrogen
Hydrogen is a desirable fuel for a low-carbon society because when it’s burned the only emission product is
water vapor. Because fossil fuels are composed mainly of carbon and hydrogen they are potential sources of
hydrogen, but to have a climate benefit the excess carbon must be captured and stored.
Pure hydrogen is now produced mainly in two industries: ammonia fertilizer production and petroleum refin-
ing. Today these hydrogen production plants generate about 100 million tons of capturable carbon. Now
this CO2 is vented, but only small changes would be needed to implement carbon capture. The scale of hy-
drogen production today is only ten times smaller than the scale of a wedge of carbon capture.
Distributing CCS hydrogen, however, requires building infrastructure to connect large hydrogen-producing
plants with smaller-scale users.
7. CCS Synfuels
In 50 years a significant fraction of the fuels used in vehicles and buildings may not come from conventional
oil, but from coal. When coal is heated and combined with steam and air or oxygen, carbon monoxide and
hydrogen are released and can be processed to make a liquid fuel called a “synfuel.”
Coal-based synfuels result in nearly twice the carbon emissions of petroleum-derived fuels, since large
amounts of excess carbon are released during the conversion of coal into liquid fuel. The world’s largest syn-
fuels facility, located in South Africa, is the largest point source of atmospheric CO2 emissions in the world. A
wedge is an activity that, over 50 years, can capture the CO2 emissions from 180 such coal-to-
synfuels facilities.
Suggested link:
IPCC Special Report on Carbon dioxide Capture and Storage, SPM
http://www.ipcc.ch/pdf/specialreports/srccs/srccs_summaryforpolicymakers.pdf
5Fuel Switching
Fuel Switching
8. Fuel-Switching for Electricity
Because of the lower carbon content of natural gas and higher efficiencies of natural gas plants, producing
electricity with natural gas results in only about half the emissions of coal. A wedge would require 1400
large (1 billion watt) natural gas plants displacing similar coal-electric plants.
This wedge would require generating approximately four times the Year 2000 global production of electricity
from natural gas. In 2060, 1 billion tons of carbon per year would be emitted from natural gas power plants
instead of 2 billion tons per year from coal-based power plants.
Materials flows equivalent to one billion tons of carbon per year are huge: a wedge of flowing natural gas is
equivalent to 50 large liquefied natural gas (LNG) tankers docking and discharging every day. Current LNG
shipments world-wide are about one-tenth as large.
Suggested link:
U.S. Environmental Protection Agency: Electricity from Natural Gas
http://www.epa.gov/RDEE/energy-and-you/affect/natural-gas.html
Nuclear Energy
9. Nuclear Electricity
Nuclear fission currently provides about 17% of the world’s electricity, and produces no CO2. Adding new
nuclear electric plants to triple the world’s current nuclear capacity would cut emissions by one
wedge if coal plants were displaced.
In the 1960s, when nuclear power’s promise as a substitute for coal was most highly regarded, a global in-
stalled nuclear capacity of about 2000 billion watts was projected for the year 2000. The world now has
about one-sixth of that envisioned capacity. If the remainder were to be built over the next 50 years to dis-
place coal-based electricity, roughly two wedges could be achieved.
In contrast, phasing out the worlds’ current capacity of nuclear power would require adding an additional
half wedge of emissions cuts to keep emissions at today’s levels.
Nuclear fission power generates plutonium, a fuel for nuclear weapons. These new reactors would add sev-
eral thousand tons of plutonium to the world’s current stock of reactor plutonium (roughly 1000 tons).
IPCC Working Group III Report "Mitigation of Climate Change", Chapter 4 - Energy Supply
http://www.ipcc.ch/pdf/assessment-report/ar4/wg3/ar4-wg3-chapter4.pdf
6Renewable Energy & Biostorage
10. Wind Electricity
Wind currently produces less than 1% of total global electricity, but wind electricity is growing at a rate of
about 30% per year. To gain a wedge of emissions savings from wind displacing coal-based
electricity, current wind capacity would need to be scaled up by a factor of 10.
This increase in capacity would require deployment of about 1 million large windmills. Based on current
turbine spacing on wind farms, a wedge of wind power would require a combined area roughly the size of
Germany. However, land from which wind is harvested can be used for many other purposes, notably for
crops or pasture.
11. Solar Electricity
Photovoltaic (PV) cells convert sunlight to electricity, providing a source of CO2-free and renewable en-
ergy. The land demand for solar is less than with other renewables, but installing a wedge worth of
PV would still require arrays with an area of two million hectares, or 20,000 km2. The arrays
could be located on either dedicated land or on multiple-use surfaces such as the roofs and walls of build-
ings. The combined area of the arrays would cover an area the size of the U.S. state of New Jersey, or
about 12 times the size of the London metropolitan area.
Since PV currently provides less than a tenth of one percent of global electricity, achieving a wedge of
emissions reduction would require increasing the deployment of PV by a factor of 100 in 50 years, or in-
stalling PV at about 2.5 times the 2009 rate for 50 years.
A current drawback for PV electricity is its price, which is declining but is still 2-5 times higher than fossil-
fuel-based electricity. Also, PV can not be collected at night and, like wind, is an intermittent energy
source.
12. Wind Hydrogen
Hydrogen is a desirable fuel for a low-carbon society because when it’s burned the only emission product
is water vapor. To produce hydrogen with wind energy, electricity generated by wind turbines is used in
electrolysis, a process that liberates hydrogen from water. Wind hydrogen displacing vehicle fuel is
only about half as efficient at reducing carbon emissions as wind electricity displacing coal
electricity, and 2 million (rather than 1 million) windmills would be needed for one wedge of
emissions reduction. That increase would require scaling up current wind capacity by about 20 times,
requiring a land area roughly the size of France.
Unlike hydrogen produced from fossil fuels with CCS, wind hydrogen could be produced at small scales
where it is needed. Wind hydrogen thus would require less investment in infrastructure for fuel distribu-
tion to homes and vehicles.
7Renewables & Biostorage (cont’d)
13. Biofuels
Because plants take up carbon dioxide from the atmosphere, combustion of biofuels made from plants like
corn and sugar cane simply returns “borrowed” carbon to the atmosphere. Thus burning biofuels for
transportation and heating will not raise the atmosphere’s net CO2 concentration.
The land constraints for biofuels, however, are more severe than for wind and solar electricity. Using cur-
rent practices, just one wedge worth of carbon-neutral biofuels would require 1/6th of the world’s cropland
and an area roughly the size of India. Bioengineering to increase the efficiency of plant photosynthesis and
use of crop residues could reduce that land demand, but large-scale production of plant-based biofuels will
always be a land-intensive proposition.
Ethanol programs in the U.S. and Brazil currently produce about 20 billion gallons of biofuel per year from
corn and sugarcane. One wedge of biofuels savings would require increasing today’s global
ethanol production by about 12 times, and making it sustainable.
14. Forest Storage
Land plants and soils contain large amounts of carbon. Today, there is a net removal of carbon from the
atmosphere by these “natural sinks," in spite of deliberate deforestation by people that adds between 1
and 2 billion tons of carbon to the atmosphere. Evidently, the carbon in forests is increasing elsewhere on
the planet.
Land plant biomass can be increased by both reducing deforestation and planting new forests. Halting
global deforestation in 50 years would provide one wedge of emissions savings. To achieve a
wedge through forest planting alone, new forests would have to be established over an area the size of the
contiguous United States.
15. Soil Storage
Conversion of natural vegetation to cropland reduces soil carbon content by one-half to one-third. How-
ever, soil carbon loss can be reversed by agricultural practices that build up the carbon in soils, such as
reducing the period of bare fallow, planting cover crops, and reducing aeration of the soil (such as by no
till, ridge till, or chisel plow planting). A wedge of emissions savings could be achieved by applying
carbon management strategies to all of the world’s existing agricultural soils.
Suggested links:
U.S. DOE, Energy Efficiency & Renewable Energy
http://www.eere.energy.gov/
IPCC Working Group III Report "Mitigation of Climate Change", Chapters 8 & 9
http://www.ipcc.ch/publications_and_data/publications_ipcc_fourth_assessment_report_
wg3_report_mitigation_of_climate_change.htm
8LESSON PLAN
The Stabilization Wedges Game – Lesson Plan
Goals
The core purpose of this game is to convey the scale of effort needed to address the carbon and climate situation and the
necessity of developing a portfolio of options. By the end of the exercise, students should understand the magnitude of
human-sourced carbon emissions and feel comfortable comparing the effectiveness, benefits, and drawbacks of a variety
of carbon-cutting strategies. The students should appreciate that there is no easy or “right” solution to the carbon
and climate problem.
Objectives
Students will learn about the technologies currently available that can substantially cut carbon emissions, develop critical
reasoning skills as they create their own portfolio of strategies to cut emissions, and verbally communicate the rationale
for their selections. Working in teams, students will develop the skills to negotiate a solution that is both physically plau-
sible and politically acceptable, and defend their solution to a larger group.
National Science Content Standards
• Systems, Order and Organization • Science in Personal and Social Perspectives
• Science as Inquiry Natural and Human Induced Hazards
Environmental Quality
Materials (see Student Game Materials at end of packet)
• 1 copy of Instructions and Wedge Table per student (print single-sided to allow use of gameboard pieces!)
• 1 Wedge Worksheet and 1 Gameboard with multi-colored wedge pieces per group, plus scissors for cutting out
game pieces and glue sticks or tape to secure pieces to gameboard
• Optional - overhead transparencies, posters, or other materials for group presentations
Time Required
We suggest using 2-3 standard (40-50 minute) class periods to prepare for and play the Stabilization Wedges game. In
the first period, the Stabilization Triangle and the concept of wedges are discussed and the technologies introduced. Stu-
dents can further research the technologies as homework. In the second period, students play the game and present
their results. Depending on the number of groups in the class, an additional period may be needed for the presentation of
results. Assessment and application questions are included and may be assigned as homework after the game has been
played, or discussed as a group as part of an additional class period/assignment.
Lesson Procedure/Methodology
I. Introduction (40 minutes)
a. Motivation. Review the urgency of the carbon and climate problem and potential ways it may impact the stu-
dents’ futures.
b. Present the Concepts. Introduce the ideas of the Stabilization Triangle and its eight “wedges”.
c. Introduce the Technologies. Briefly describe the 15 wedge strategies identified by CMI, then have students
familiarize themselves with the strategies as homework. Participants are free to critique any of the wedge strate-
gies that CMI has identified, and teams should feel free to use strategies not on our list.
d. Form Teams. Teams of 3 to 6 players are best, and it is particularly helpful to have each student be an ap-
pointed “expert” in a few of the technologies to promote good discussions. You may want to identify a recorder
and reporter in each group.
e. Explain the Rules. See instructions in Student Game Materials at back of packet
9LESSON PLAN
II. Playing the Game (40 minutes)
a. Filling in the Stabilization Triangle. Teammates should work together to build a team stabilization triangle
using 8 color-coded wedges labeled with specific strategies. Many strategies can be used more than once.
b. Wedge Worksheet. Each team should fill in one stabilization wedge worksheet to make sure players ha-
ven’t violated the constraints of the game, to tally costs, and to predict judges’ ratings of their solution. NOTE:
Costs are for guidance only – they are not meant to be used to produce a numerical score that wins or loses the
game!
c. Reviewing the Triangle. Each team should review the strengths and weaknesses of its strategies in prepara-
tion for reporting and defending its solutions to the class.
III. Reports (depending on the number of groups this may require an additional class period)
a. Representatives from each team will defend their solutions to the class in a 5-minute report. The presentation
can be a simple verbal discussion by the group or a reporter designated by the group. If additional time is avail-
able, the presentations could include visual aids, such as a poster, PowerPoint presentation, etc.
b. Students should address not only the technical viability of their wedges, but also the economic, social, environ-
mental and political implications of implementing their chosen strategies on a massive scale.
IV. Judging
In CMI workshops, the teams’ triangles have been judged by experts from various global stakeholder groups, such as
an environmental advocacy organization, the auto industry, a developing country, or the U.S. Judging ensures that
economic and political impacts are considered and emphasizes the need for consensus among a broad coalition of
stakeholders. For a classroom, judges can be recruited from local government, colleges, businesses, and non-profit
organizations, or a teacher/facilitator can probe each team about the viability of its strategies.
V. Closure/Assessment of Student Learning
In addition to addressing the game and lessons learned, discussion questions are provided below that give opportu-
nity to develop and assess the students’ understanding of the wedges concept and its applications.
1) Given physical challenges and risks, how many wedges do you think each wedge strategy can each realistically pro-
vide?
2) In choosing wedge strategies, it’s important to avoid double counting – removing the same emissions with two differ-
ent strategies. For example, there are 6 strategies for cutting emissions from electricity, but we project only 5 wedges
worth of carbon produced from the electric sector 50 years from now. Can you think of reasons, other than the
adoption of alternative or nuclear energy, that emissions from electricity would be lower or higher than we predict?
Examples: increased use of carbon-intensive coal versus natural gas (higher), slower population growth (lower), sub-
stitution of electricity for fuel, as via plug-in electric cars (higher).
3) Industrialized countries and developing countries now each contribute about half the world’s emissions, although the
poorer countries have about 85% of the world’s population. (The U.S. alone emits one fourth of the world's CO2.) If
we agree to freeze global emissions at current levels, that means if emissions in one region of the world go up
as a result of economic/industrial development, then emissions must be cut elsewhere. Should the richer
countries reduce their emissions 50 years from now so that extra carbon emissions can be available to developing
countries? If so, by how much?
4) Nuclear energy is already providing one-half wedge of emissions savings – what do you think the future of these
plants should be?
5) Automobile emissions are a popular target for greenhouse gas cuts. What percent of greenhouse gases do you think
come from the world’s passenger vehicles? (answer: about 18%)
Resources & Feedback
More stabilization wedge resources, including background articles and slides, are available at
http://cmi.princeton.edu/wedges
10Student Game Instructions & Materials
The goal of this game is to construct a stabilization triangle using eight wedge strategies, with only a few con-
straints to guide you. From the 15 potential strategies, choose 8 wedges that your team considers the best global solu-
tions. Keep costs and impacts in mind.
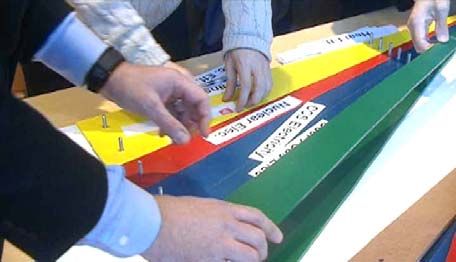
1) Find the Wedge Gameboard in the back of this packet and cut apart the red, green, yellow, and blue wedge pieces
supplied (if not already done for you).
2) Read the information on each of the 15 strategies in the Wedge Table below. Costs ($, $$, $$$) are indicated on
a relative basis, and are intended only to provide guidance, not a numerical score. Feel free to argue against any in-
formation presented and include alternative wedge strategies if you can support them.
3) Each team should choose one wedge strategy at a time to fill the 8 spots on
the wedge gameboard (see illustration of gameboard with 4 wedges filled in at left
8
7
– this is only an example!).
6
5
4
4) The four colors of the wedge pieces indicate the major category (fossil
fuel-based (blue), efficiency and conservation (yellow), nuclear (red), and renew-
uels
Biof
ables and biostorage (green)). Choose a red, yellow, blue, or green wedge for
3
ity
ctric
ar Ele
Nucle
your strategy, then label the wedge to indicate the specific strategy (exam-
2
rogen
CCS Hyd
Transport Efficien
cy
ples shown in illustration at left).
1
5) Most strategies may be used more than once, Carbon Emissions by Sector
but not all cuts can come from one energy
sector.
Of the 16 billion tons of carbon emitted in the 2060
baseline scenario, we assume electricity production Heat Electricity
accounts for 6 wedges, transportation fuels accounts 55 5
6
for 5 wedges, and direct fuel use for heat and other
purposes accounts for 5 wedges (see pie chart Transport
right). 45
Because biostorage takes carbon from all sources
out of the atmosphere, biostorage wedges do not Need 8 wedges – not all wedges can come from one energy sector!
count toward an energy sector.
6) Cost and impacts must be considered. Each wedge should be viewed in terms of both technical and political vi-
ability.
7) For each of the 8 strategies chosen, each team should fill out one line in the Wedge Worksheet. After all 8
wedges have been chosen, tally total cuts from each energy sector (Electricity, Transport, and Heat) and costs. Use
the scoring table to predict how different interest groups would rate your wedge on a scale from 1 to 5.
8) Each team should give a 5-minute oral report on the reasoning behind its triangle. The report should justify your
choice of wedges to the judge(s) and to the other teams. Note: There is no “right” answer – the team that makes
the best case wins, not necessarily the team with the cheapest or least challenging solution
11Stabilization Wedges – 15 Ways to Cut Carbon
= Electricity Production, =Heating and Direct Fuel Use, =Transportation, = Biostorage
Strategy Sector Description 1 wedge could come from… Cost Challenges
Increase automobile fuel
1. Efficiency – efficiency … doubling the efficiency of all Car size & power
$
Transport (2 billion cars projected in world’s cars from 30 to 60 mpg
2050)
Increased public
2. Conservation Reduce miles traveled by pas- … cutting miles traveled by all
$ transport, urban
- Transport senger and/or freight vehicles passenger vehicles in half
design
… using best available technol- House size, con-
3. Efficiency - Increase insulation, furnace
ogy in all new and existing $ sumer demand for
Buildings and lighting efficiency
buildings appliances
4. Efficiency – Increase efficiency of power … raising plant efficiency from Increased plant
$
Electricity generation 40% to 60% costs
90% of CO2 from fossil fuel
power plants captured, then … injecting a volume of CO2 Possibility of CO2
5. CCS
stored underground every year equal to the volume $$ leakage
Electricity
(800 large coal plants or 1600 of oil extracted
natural gas plants)
Hydrogen fuel from fossil New infrastructure
6. CCS … producing hydrogen at 10
sources with CCS displaces $$$ needed, hydrogen
Hydrogen times the current rate
hydrocarbon fuels safety issues
Capture and store CO2 emitted Emissions still only
… using CCS at 180 large
7. CCS Synfuels during synfuels production $$ break even with
synfuels plants
from coal gasoline
8. Fuel Replacing coal-burning electric … using an amount of natural Natural gas
$
Switching – plants with natural gas plants gas equal to that used for all availability
Electricity (1400 1 GW coal plants) purposes today
… ~3 times the effort France
Displace coal-burning electric Weapons prolifera-
9. Nuclear put into expanding nuclear
plants with nuclear plants $$ tion, nuclear waste,
Electricity power in the 1980’s, sustained
(Add double current capacity) local opposition
for 50 years
Wind displaces coal-based Not In My Back Yard
10. Wind … using area equal to ~3% of
electricity $$ (NIMBY)
Electricity U.S. land area for wind farms
(10 x current capacity)
Solar PV displaces coal-based
11. Solar .. using the equivalent of a 100 PV cell materials
electricity $$$
Electricity x 200 km PV array
(100 x current capacity)
… powering half the world’s NIMBY, Hydrogen
12. Wind Produce hydrogen with wind
cars predicted for 2050 with $$$ infrastructure, safety
Hydrogen electricity
hydrogen
Biodiversity, compet-
Biomass fuels from plantations … scaling up world ethanol pro-
13. Biofuels $$ ing land use
replace petroleum fuels duction by a factor of 12
Biodiversity, compet-
14. Forest … halting deforestation in 50 $
Carbon stored in new forests ing land use
Storage years
Farming techniques increase … practicing carbon manage- Reversed if land is
15. Soil $
carbon retention or storage in ment on all the world’s agricul- deep-plowed later
Storage
soils tural soils
12
For more information, visit our website at http://cmi.princeton.edu/wedges.Wedge Worksheet
1. Record your strategies to reduce total fossil fuel emissions by 8 wedges by 2060.
(1 “wedge” = 1 billion tons carbon per year)
• You may use a strategy more than once
• Use only whole numbers of wedges
• You may use a maximum of
- 6 electricity wedges (E)
- 5 transportation wedges(T)
- 5 heat or direct fuel use wedges (H)
Strategy Sector Cost Challenges
(E,T,H or B) ($)
1
2
3
4
5
6
7
8
E = ___ (6 max)
TOTALS T = ___ (5 max)
H = ___ (5 max)
B = ___
2. Guess the score each stakeholder group would give your team’s triangle on a scale of 1 to 5 (5 = best).
Taxpayers/ Energy Environmental Manufacturers Industrialized Developing
Judge: Consumers Companies Groups country country
governments governments
Score:
138
Stabilization Wedge
Gameboard 7
1. Pick red, blue, yellow or green wedges to represent the major wedge
categories of the 8 strategies to be used (Fossil-Fuel, Nuclear, 6
Efficiency & Conservation, or Renewables & Biostorage).
8 billion
2. Label wedges to indicate specific strategies.
tons carbon
5 per year
4
3
2
1
50 years14Cut along lines
Renewables & Biostorage Wedges
8
7
6
5
4
3
2
1
15
Fossil Fuel-Based WedgesCut along lines
Efficiency & Conservation Wedges
8
7
6
5
4
3
2
1
16
Nuclear WedgesYou can also read