Increase in occurrence of large glacier related landslides in the high mountains of Asia - Nature
←
→
Page content transcription
If your browser does not render page correctly, please read the page content below
www.nature.com/scientificreports
OPEN Increase in occurrence of large
glacier‑related landslides
in the high mountains of Asia
Jia Liu1,2, Yuming Wu1* & Xing Gao1
Globally, a large number of glaciers are retreating due to global warming. Along with climate change,
glacial melting has been identified as one of the main triggers of landslide activity in high mountain
areas. Evaluations of the triggered mechanism alone do not provide comprehensive insight into the
overall impact of glacier accumulation and ablation on landslide-induced denudation. To investigate
recent trends, we built landslide and glacier datasets for the HMA using a Landsat time-series covering
the past 21 years (1998–2018). Landslides that may have been caused by major earthquakes were
identified and removed, leaving an inventory that is used to explore changes that may be related to
climate change. Our results show a shift in the frequency–area distribution that indicates an increasing
trend of large landslides in the HMA over the last decade. A decline in glacier area is associated with
the increase in landslide area.
Landslides, which can be triggered by events such as rainfall, earthquakes and freeze–thaw cycles, occur fre-
quently in mountainous a reas1–4. Due to climate change, hazards, such as glacier retreat, permafrost degradation
and lake shrinkage, occur frequently in high altitude regions5–7, often leading to slope instability, and an increase
in the occurrence of deep-seated landslides8.
Climate change has an indirect effect on landslides occurring at high altitudes by degrading permafrost9 and
melting glaciers10,11 which may increase the magnitude and frequency of landslides12. Sediments, which tend to
be accumulate on the receding edge of a glacier, may become unstable as the glacier r ecedes13. Glacial melting
can also change precipitation patterns14, especially extreme rainfall, which tends to exacerbate slopes instability.
Although observations of recent large landslides in some mountain regions lend support to these hypotheses
regarding climate change and slope stability, the evidence is typically ambiguous. This is partly due to the lack
of systematic records of historical landslides that can be compared with new landslide data, which is a problem
in alpine and glacial environments in many parts of the world15–17.
This paper therefore investigates the spatial and temporal patterns of landslides in the high mountains of
Asia (HMA) over a 20-year period (1999–2018) using a custom-derived glacier-related landslide dataset. Our
aim is to investigate whether the size and frequency of landslides in this region have changed as the region has
warmed. The study area includes the eastern Pamir, western Himalayas, Hindu Kush, Karakoram, and western
Kunlun mountains within region 33.8°–39.5°N and 70.5°–78.7°E, and covers an area of over 600,000 km2. An
inventory of landslide maps and glacier extent for the past 20 years was generated using Landsat imagery. Land-
slides potentially of a seismic origin were excluded from the inventory based on proximity in time and space to
recorded major earthquakes.
The HMA region is typical of many high altitude regions. Glaciers are widely distributed, and as an abundant
water resource, make an important contribution to the supply of water to millions of people in the surrounding
areas. The glaciated areas of the HMA are more sensitive to temperature than those in low-lying plains18. Climate
change predictions for these aera include more frequent extreme weather events, recession of the glaciers, and
changes in water levels in glacial lakes19. Geologic hazards occur frequently in the HMA20,21, and landslides have
the potential to affect important transportation corridors connecting neighboring Asian countries that have to
cross these mountains.
1
State Key Laboratory of Resources and Environmental Information System, Institute of Geographic Sciences and
Natural Resources Research, Chinese Academy of Sciences, 11A Datun Road, Chaoyang District, Beijing 100101,
China. 2University of Chinese Academy of Sciences, Beijing 100049, China. *email: wuym@lreis.ac.cn
Scientific Reports | (2021) 11:1635 | https://doi.org/10.1038/s41598-021-81212-9 1
Vol.:(0123456789)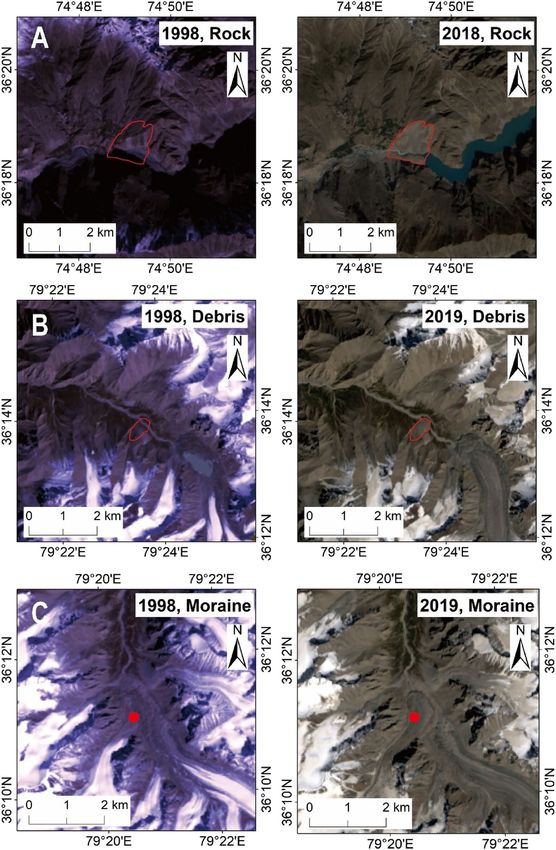
www.nature.com/scientificreports/
Date Latitude (°) Longitude (°) Epicenter Magnitude
2015-12-07 38.21 72.77 104 km W of Murghob, Tajikistan 7.2
2015-07-03 37.45 78.15 97 km SE of Yilkiqi, China 6.4
2005-10-08 34.53 73.58 Pakistan 7.6
2002-11-20 35.41 74.51 Northwestern Kashmir 6.3
Table 1. Earthquakes that potentially triggered landslides in the study area.
Data and methods
Landslide inventory. Our primary dataset is a glacier-related landslide inventory, which can be very useful
for risk a ssessment22. Some scholars have conducted field surveys in the HMA and generated previous land-
slide inventories23. However, these databases are mostly historical data without detailed and reliable timestamps.
Remote sensing offers the possibility of addressing this data gap, by building detailed time-series of landslide
inventories.
Landslides can be detected on satellite series by changes in land cover (vegetation distribution, rock outcrop-
ping exposure or soil degradation)15,24. Remote sensing satellite data with high resolution an extensive archive
of historical acquisitions, and a generally vertical field of view that provides an almost planimetric perspective,
are particularly valuable for generating time-series data. Sentinel and Landsat are sensors that have both used
by scholars to study landslides25,26. Although the spatial resolution of Landsat is slightly coarser than that of
Sentinel, Landsat provides a longer observation time. To avoid biasing our time series, with more landslides
being identified from the more recent high-resolution imagery, we use only Landsat imagery.
For our study, Landsat imagery was obtained from the U.S. Geological Survey (USGS) EarthExplorer website.
Images were obtained for each year for the period from 1998 to 2018. The Landsat data include images from
the Thematic Mapper (TM), Enhanced Thematic Mapper (ETM+) and Operational Line Imager. The spatial
resolution of these data is 30 m. The entire study area is covered by 17 Landsat path/row scenes. For each scene,
cloud-free images at the end of summer (September through October) were selected. Additional images were
selected during the winter season of each year so that each year’s imagery includes one imagery at beginning or
end of the year.
Landslides were manually identified by photo-interpretation of the scenes, and by comparing imagery between
dates. Landslide scars and deposits resulting from landslides can be identified on Landsat imagery from contrasts
in landform and land cover with the surrounding areas, and confirmed by lack of these distinctive features in the
summer image of the previous year. The multi-temporal database was used to constrain the date of the landslide,
which was labeled with the year the landslide is first visible. The digitization of the landslide polygons was per-
formed in ENVI software. SRTM3 digital elevation data is used to calculate the aspect and slope of a landslide.
In the process of mapping landslides, we tried to map all the affected area of each landslide. However, the
failed areas of some landslides were not clearly visible because of shadows or a lack of contrast between ground
disturbed by the landslide, and undisturbed snow/ice or bare rock. This leads to the possibility that the landslide
area may include the failure area and the runout area, or it may include only the runout area or the accumula-
tion area.
We classified the types of landslides according to the criteria of Varnes (1998)27. Due to the limitation of
Landsat image resolution, it is difficult to distinguish the type of movement. Therefore, we also used higher spatial
resolution imagery available in Google Earth to supplement our Landsat interpretation. The landslide material
types were rock, debris and moraine, as illustrated in Fig. 1.
Because we focus on the possible effects of glacier retreat on landslides, we removed from our inventory land-
slides that could potentially have been triggered by earthquakes and that were more than 50 km from glaciers.
Keefer28 has proposed a typical maximum distance for the occurrence of seismically-induced landslides from the
epicenter; a distance that varies as a function of the magnitude of the earthquake and represented earthquakes
(Fig. 2). We therefore used the USGS earthquake hazards website to identify all major earthquakes near or within
the study area during the 20-year interval studied, and then removed from our inventory any landslide that
could have occurred at the time of the earthquake and was located within the threshold of distance. We chose
the disturbed landslide because it is the most sensitive to earthquakes, which means that the earthquake has a
large impact distance on such landslides. We found four earthquakes (Table 1) and an associated four landslides
that met the magnitude and distance criteria shown in Fig. 2. These landslides were removed from the inventory.
Glacier mapping. The second major dataset that we generated for this study is a 20-year time series of maps
of glacial extent for the study area. As with the landslide inventory, we used Landsat remotely sensed data. The
Landsat sensors TM, ETM+ , OLI capture the distinctive spectral reflectance of snow and ice in the VNIR (vis-
ible and near-infrared) band and SWIR (shortwave infrared) band that is used to separate it from the surround-
ing terrain. Typical Landsat spectral measures include spectral band ratios such as TM3/TM5, TM4/TM5, and
the NDSI (normalized difference snow index). In this study, we used the Landsat NDSI index to obtain glacial
boundaries. The NDSI index is defined as:
(Green − SWIR)
NDSI = (1)
(Green + SWIR)
Scientific Reports | (2021) 11:1635 | https://doi.org/10.1038/s41598-021-81212-9 2
Vol:.(1234567890)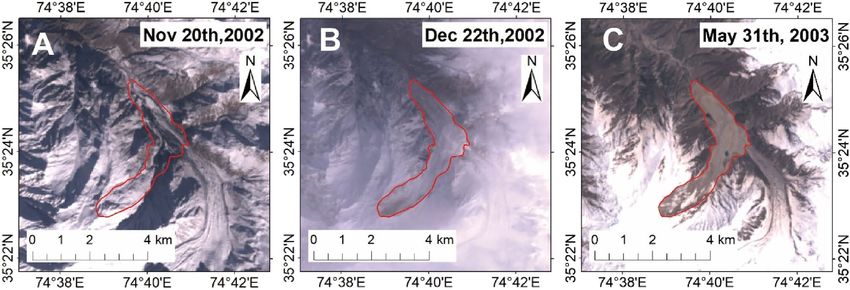
www.nature.com/scientificreports/
Figure 1. Comparison of three types of landslide source area. (A–C) are shows the landslides of rock, debris,
and Moraine material types (Figures created using Arcgis10.2 https://www.esri.com/en-us/arcgis/products/arcgi
s-desktop).
Scientific Reports | (2021) 11:1635 | https://doi.org/10.1038/s41598-021-81212-9 3
Vol.:(0123456789)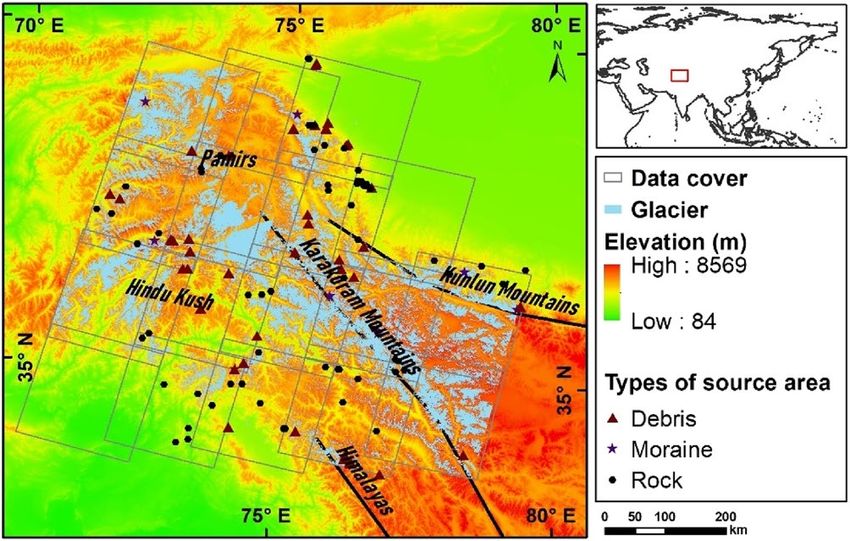
www.nature.com/scientificreports/
Figure 2. Variation in earthquake epicentral distance from disrupted landslides for earthquakes of varying
magnitudes. The extent of black arrow points to is the distance range of disrupted landslides caused by the
earthquake.
where Green and SWIR represent the values of the green and shortwave infrared bands for Landsat series images.
We set 0.4 as the extraction threshold, which is commonly used by scholars to extract ice from remote sensing
images29.
Spectral ratio methods are effective in delineating clean ice. However, seasonal snow, cloud and frozen lakes
may be misclassified as glaciers and require manual editing of the classification. we therefore first classified ice
using the NDSI. Then, we clipped our data based on the Randolph glacier inventory30, to reduce snowfall and
cloud mass errors. Finally, manual interpretation was used to remove some errors associated with glacial lakes
and around the edges of images.
Probability‑area distribution of landslides. A number of complex natural phenomena exhibit power-
law frequency–area relationships, including earthquakes, which are considered a classic example of such phe-
nomena. Landslides are thought to be another natural hazard that exhibits power-law frequency–area rela-
tionships under a wide variety of c ircumstances31. Some scholars question whether small landslides follow the
power distribution, because small landslides sometimes evolve into larger landslides. There is also a problem that
smaller landslides may be difficult to identify, or many individual small slides appear to be one large slide32. The
main focus of this paper is medium to large landslides, so these concerns are not directly relevant to our work.
The probability-size distribution of landslides in the study area is given by
1 δNL
p(AL ) = (2)
NLT δAL
where p(AL ) is a probability density function, δNL is the number of landslides with areas between AL (km2)
and AL + δAL , δAL (km2) is based on a log scale and NLT is the total number of landslides in an inventory. The
frequency density of landslides, f (AL ), is given by:
f (AL ) = NLT p(AL ) (3)
The frequency-size distribution of landslides in the study area was compared with those for various event
magnitudes proposed by Malamud et al. (2004)33 to assess the nature of a landslide event. The p value represents
the probability density of landslides with area AL (km2) as follows:
ρ+1
1 a a
p(AL : ρ, a, s) = exp − (4)
aŴ(ρ) AL − s AL − s
where ρ is a parameter controlling the power-law decay for medium and large landslides, a (km2) is a param-
eter controlling the location of the maximum probability distribution, s (km2) is a parameter controlling the
exponential rollover for small landslides, and Ŵ(ρ) is the gamma function of ρ . Malamud et al.33 also proposed
a magnitude scale for a landslide event, mL , as follows:
mL = log10 (NLT ) (5)
The combination of Eqs. (2)–(5) provides the frequency density of landslides linked to the magnitude scale
of a landslide event.
Scientific Reports | (2021) 11:1635 | https://doi.org/10.1038/s41598-021-81212-9 4
Vol:.(1234567890)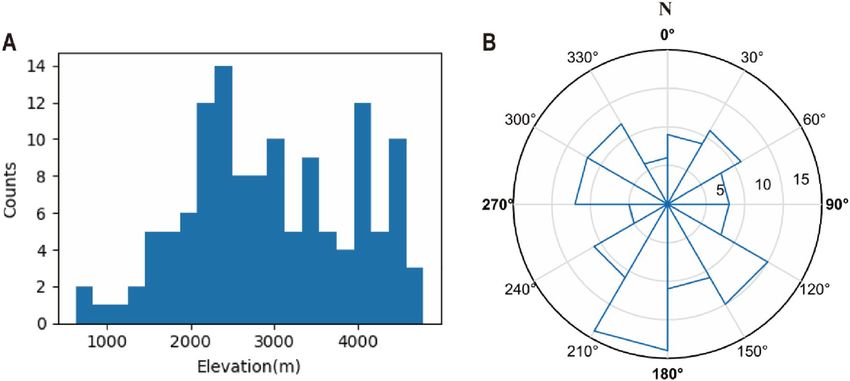
www.nature.com/scientificreports/
Figure 3. Comparison of landslides before and after being covered by snow. (A) is the scene before the
landslide failed, (B) is the scene after the landslide failed with snow cover, (C) is the scene after the landslide
failed without snow cover (Figures created using Arcgis10.2 https://www.esri.com/en-us/arcgis/products/arcgi
s-desktop).
For our study, the power-rate distribution was obtained using the R language.
Results and discussion
Factors influencing identification of landslides. Landslides can be identified in alpine and glacial
regions by (1) high contrast compared to surrounding snow and ice, (2) the influence of landslide on river,
and (3) lobate forms typical of rock-avalanche deposits15,34. Local variations in tone, texture or pattern, and the
presence of lineaments can also be used to infer slope instabilities35. However, there are some factors that affect
us to see the certain landslide in the identification process. The factors affecting landslide identification include
landslide characteristics, snow cover, and the quality of remote sensing image.
Landslides are a complex movement process. Landslides include failure area, transportation area and accu-
mulation area. Due to the influence of image quality (resolution, clouds, etc.) and the geological characteristics
of the alpine region (glacier development, lack of vegetation), it is difficult to distinguish some slides which didn’t
cause optical characteristic variation in the image. They include some small area debris flow and moraine failure,
and rock avalanches that have not formed significant accumulation. In our identification process, we found that
the influence of landslide on river is beneficial to our identification work.
The influence of external factors mainly comes from the influence of snow cover. According to our identifica-
tion process, although a landslide occurs in winter and is covered with snow (Fig. 3A,B), it can be seen after the
snow melts as the area is large or the accumulation is large (Fig. 3C). Coe et al.15 mentioned that the accumulation
of landslides greater than 0.5 k m2 would be obvious.
The quality problems of Landsat series satellites mainly come from cloud cover, seasonal snow cover and
so on. We try to ensure a late summer and cloudless image every year to identify landslides. But sometimes it
can’t meet two conditions. Hence, we selected multiple images from the same year to identify the landslide. In
particular, there is a problem with the black stripe error in the Lansat7 after it broke down in 2013. We think it
is inevitable that we will miss some of the landslides that occur within these bands or most of them. At the same
time, we can be sure that some large areas of the landslide, even if the impact of the strip, we can identify and
determine its occurrence.
Activity of landslides and climate change in the HMA. A total of 127 landslides were detected in the
Landsat images of the study area, covering the period from 1999 to 2018 (Fig. 4 and Supplementary Informa-
tion). The landslides are mainly concentrated in the Karakoram Mountains, eastern part of the Pamir Mountains,
western Himalayas and south of the Hindu Kush. Based on the source area the landslides were divided into three
categories. A total of 72 rock landslides were identified, 45 debris landslides, and 10 moraine landslides. Table 2
and Fig. 5 summarize the landslide characteristics. The average area of the 127 landslides was approximately
58 ha, with 6.35 landslides occurring per year. The average elevation of the landslides is 2,966 m, and the average
slope is 10.88° at the center point of the failure area. Most of the mapped landslides were at elevations more than
2,000 m above sea level (Fig. 5A). Landslide source areas had more slope directions (aspects) between 90° and
270° (i.e., southwest- to southeast-facing slopes, Fig. 5B).
The landslides of rock type are widely distributed in the HMA, and concentrated in the western Kunlun
Mountains, although they also occur frequently in the Hindu Kush and the western Himalayas. Debris land-
slides are mainly distributed in the West Kunlun Mountains and the Hindu Kush, with additional occurrences
in the Pamirs and western Himalayas. As expected, morainic landslides occur at higher elevations, including the
Karakorum Mountains, the western Himalayas, the Kunlun Mountains, and the Pamirs, at an average elevation
of 4,139 m. We also analyzed the distribution of large landslides, defined as landslides that affected areas greater
Scientific Reports | (2021) 11:1635 | https://doi.org/10.1038/s41598-021-81212-9 5
Vol.:(0123456789)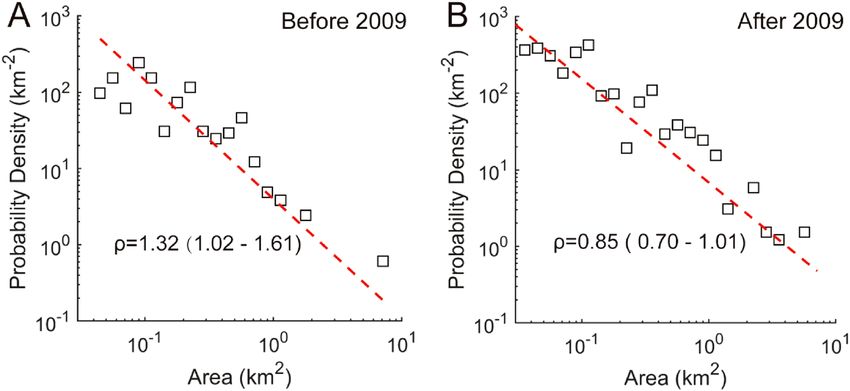
www.nature.com/scientificreports/
Figure 4. Study area. The gray rectangles represent the coverage of the Landsat images. Triangles, pentagons,
and circles represent three types of landslide source area. The blue filled areas are glacier-covered areas (Figures
created using Arcgis10.2 https://www.esri.com/en-us/arcgis/products/arcgis-desktop).
Year 1999–2018
Total number of landslides 127
Total landslide area (m2) 73,811,719
Landslide mean area (m2) 581,194
Minimum landslide area (m2) 15,548
Maximum landslide area (m2) 7,801,274
Mean slope value(°) 10.88
Mean elevation(m) 2966
Table 2. Landslide inventory summary characteristics.
Figure 5. Variation in (A) elevations and (B) aspects for landslide from a 30-m DEM. Aspects are shown on a
360° Rose diagram. Numbers on circles are counts within that range.
than 2 k m2. A total of three large landslides were found in the Pamirs, four in the western Himalayas, and two
in Karakorum.
A graph of annual landslide area is show in Fig. 6. The Thompson Tau m ethod36 is used to find the outliers
with the critical probability alpha value is 0.01. The result indicates that the landslide area points in 2003, 2010
and 2016 are outliers, as shown in Fig. 6. After removing the outliers, linear-fit line (R2 = 0.26) shows that the
annual landslide area in the HMA are increasing (Fig. 6).
Scientific Reports | (2021) 11:1635 | https://doi.org/10.1038/s41598-021-81212-9 6
Vol:.(1234567890)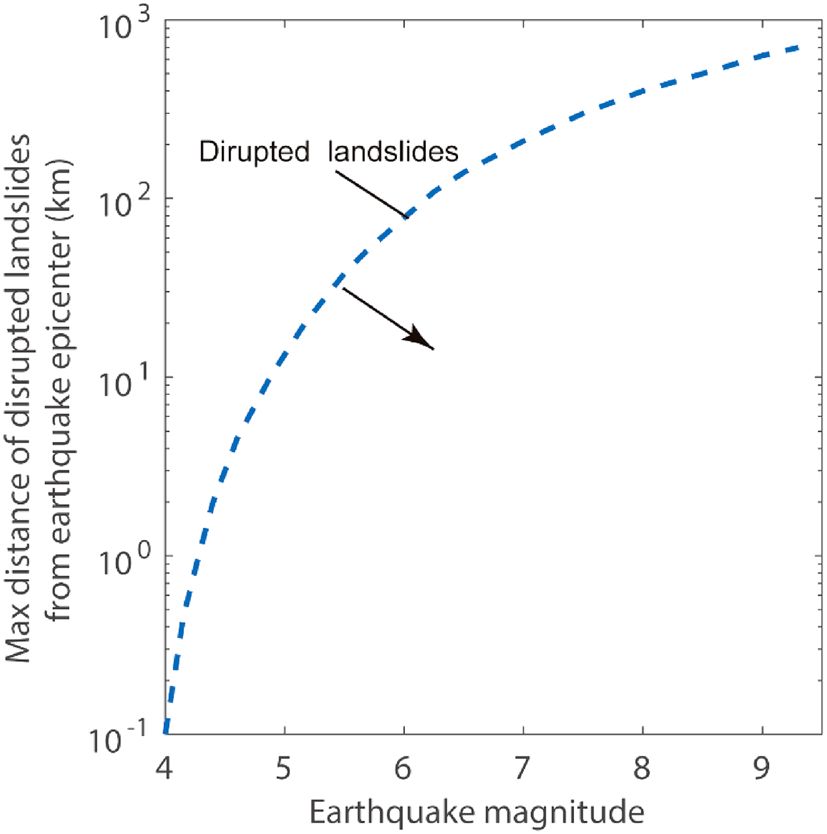
www.nature.com/scientificreports/
Figure 6. The orange scatterplot shows the temporal distribution of landslide area; blue shaded areas are
developing El Niño y ears38. Red dots are outliers based on Thompson’s Tau37. The black dotted line is a linear-fit
trendlines line of landslide area without outliers.
Year 1999–2008 2009–2018
Total number of landslides 42 85
Total landslide area (m2) 22,342,316 51,469,403
Landslide mean area (m2) 531,959 605,522
Minimum landslide area (m2) 43,931 15,548
Maximum landslide area (m2) 7,801,274 5,481,502
Mean slope value (°) 9.34 11.35
Mean elevation (m) 3115 2893
Table 3. Comparison of landslide inventory characteristics.
The area of landslides was greatest in 2016. The average annual temperature was unusually high during this
year, and the glacial area had notably declined in the previous 3 years (Fig. 8E). To provide additional insight
into the impact of climate change on landslides, we compared the annual landslide area data with annual El
Niño data for the study years37. We found that the landslide area outliers tend to coincide with El Niño years.
The one exception is 2006, an El Niño year with no associated peak in landslide area. However, 2006 was associ-
ated with generally lower average temperatures in Fig. 8E. Overall, however, the time-series of landslide area,
and particularly the outliers, appears to show periodicity, and the trend in landslide area is increasing. Scientists
have hypothesized that as El Niño becomes more frequent and stronger, alpine glaciers are also being a ffected38.
Warmer temperatures caused by El Niño can accelerate melting of glaciers, and the increase of rainfall also
increases the conditions that favor the occurrence of landslides.
Shifts in landslide frequency–area distribution. To investigate whether landslide characteristics have
changed over the past 20 years, we divided the landslide data set into two datasets: landslides that occurred
before 2009, and those that occurred in 2009 or later. Table 3 shows that both the number of landslides and
the average area of landslides increased in the second 10 year period. The difference in the average slope of the
landslides was not significant.
The power distribution of landslide data in the study area over the entire 20 years of the landslide inventory
has a decay factor ρ of approximately 1.14, which is in the normal range of previous studies. Although there is
some variability in the findings of previous research, most prior landslide data sets follow noncumulative power-
law frequency statistics, and the range of ρ values is approximately 1.5 ± 0.532. However, it is important to note
that previous studies have obtained different power distributions, fitting different tail attenuation coefficients.
Furthermore, the data sets used in these studies come from different environments and the associated earth-
quakes are assumed to have been triggered by different factors, including rainfall, earthquakes and snowmelt.
The power-rate distribution for the landslides separated into the two 10-year periods is shown in Fig. 7. Both
periods show a distinct power distribution. The decay factor in the second 10 year period (ρ = 0.85, 95%CI:
0.70–1.01) is smaller than that of the first 10 year period (ρ = 1.32, 95%CI: 1.02–1.61). This indicates that the
probability of large and medium-sized landslides in the second 10 year period is higher than the first period.
The confidence intervals of the two values of ρ do not overlap, and thus the difference is statistically significant.
Relationship between landslides and glaciation. For the entire study area, we used the Randolph
glacier outlines as a mask to minimize misclassification due to factors such as seasonal snow. However, seasonal
snow can also lead to errors in the calculations. In order to evaluate the error associated with the glacier deline-
ation, we compared automatic extraction of glacial area with a semi-automatic approach that was regarded by
scholars as a relatively accurate method39. The semi-automatic method uses the ratio threshold method to gen-
erate approximate results, when are then modified by hand, using visual interpretation by an expert interpreter.
Scientific Reports | (2021) 11:1635 | https://doi.org/10.1038/s41598-021-81212-9 7
Vol.:(0123456789)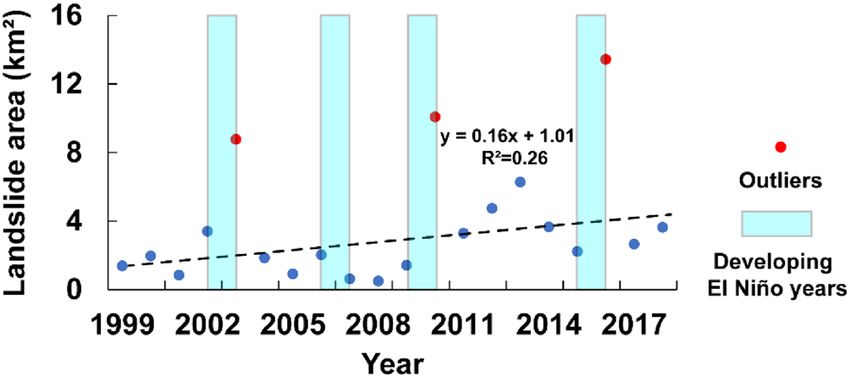
www.nature.com/scientificreports/
Figure 7. Comparison of frequency–area distribution for the 10 year period before 2009 and for 2009 and later.
(A) is the frequency–area distribution for the 10 year period before 2009 with the decay factor ρ (1.32, 95%CI:
1.02–1.61). (B) is the frequency–area distribution for 2009 and later with the decay factor ρ (0.85, 95%CI:
0.70–1.01).
(Upper left coordinates, Lower Area from semi-automatic Area from automatic approach Difference between semi-
Region right coordinates) approach (km2) (km2) automatic and automatic (%) Acquisition year
Pamirs ([72.30, 39.56], [73.19, 38.19]) 3636.2 3956.9 8 2009
Kunlun Moutians ([75.01, 38.40], [76.37, 36.48]) 2927.3 2879.5 −2 2014
Karakoram Moutians ([77.22, 35.43], [78.44, 33.80]) 3674.5 4012.8 9 2000
Table 4. Comparison of frequency–area distribution characteristics based on semi-automatic and automatic
glacial mapping.
We selected data from 3 regions for data verification (Table 4). The calculated difference is less than 10%, and
the average difference is about ± 6.3%. For our study, we think the error of the glacier area results is acceptable.
The glacier area in the HMA has shown a downward trend over the past 20 years. Before 2005, the glacier
area decreased and increased repeatedly, which may be related to the monsoon climate. After 2005, the area of
glaciers decreased significantly. The trend of glacial degradation over the past decade was significantly stronger
than that in the previous decade.
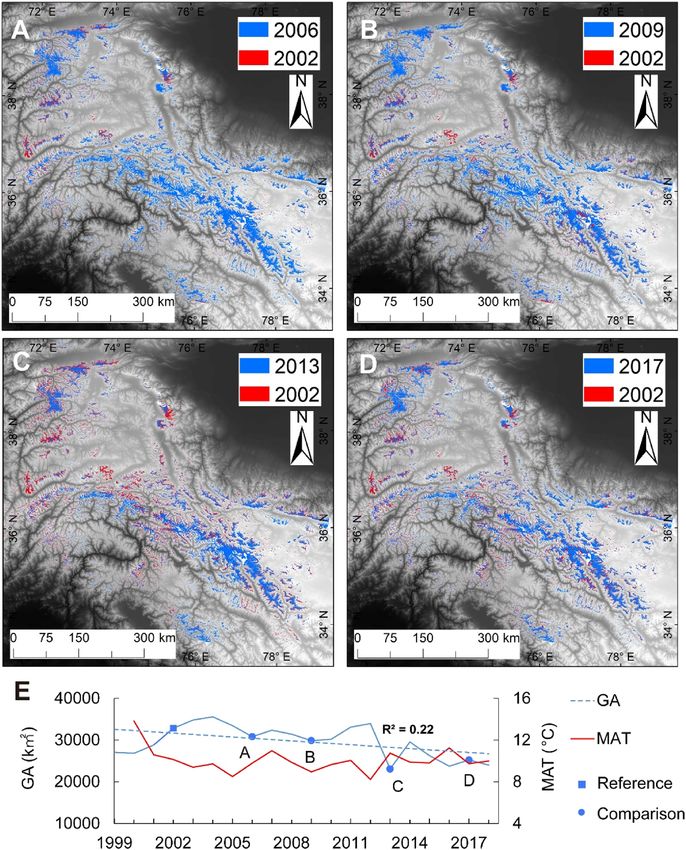
For a comparison of the glacial extent between years, we chose the remote sensing image from 2002 as the
basic reference because the imaging times for the mosaic image in 2002 were not very different. We selected the
glacier area in four subsequent years (2006, 2009, 2013 and 2017) to compare with the reference to analyze the
change in glaciers in the study area (Fig. 8A–D). We found that except for the Karakoram Mountains, which
exhibited only small areas of glacial retreat over the past 2 decades, the retreat in the other areas was more
extensive. An anomaly of the Karakoram Mountains was found due to the relatively high e levation40. In addition,
climate anomalies and the strong summer monsoon climate in the region have brought additional moisture to
the Karakoram Mountains, leading to increased s now41.
Figure 8E summarizes the total area of glacial extent of the 20-year period studied. The figure also shows the
mean annual temperature, averaged over the region. MAAT was calculated based on MODIS surface temperature
product MOD11A2, which has a spatial resolution of 1000 m and a temporal resolution of 8 days.
The HMA glacial area has had a downward trend over the past 20 years (Fig. 8E). Looking at the record in
more detail, the glacial area decreased prior to 2005, and then increased, possibly in response to variations in
the associated region’s monsoon climate. After 2012, the area of glaciers decreased notably. The glacial area
showed little no overall change in the first decade, and a notable decline in the second decade. The temperature
record does not show evidence of warming over the period 2000 to 2018. The year 2000 was unusually warm
compared to the subsequent 18 years. Even excluding 2000, there is no clear evidence of a warming trend over
the remaining years.
However, glacial area can be assumed to be an environmental proxy that integrates climate over time and
space. Glacial area could therefore be a useful predictor of slope stability. Glacier area does indeed show a nega-
tive association with landslide area (Fig. 9), indicating landslide area is increasing as glacial area declines. Glacial
retreat is an indicator of climate change, and our results support the hypothesis that warming of the region is
associated with an increase in landslide occurrence. However, the small number of samples and the scatter
indicate notable uncertainty, and the association therefore requires further research.
Scientific Reports | (2021) 11:1635 | https://doi.org/10.1038/s41598-021-81212-9 8
Vol:.(1234567890)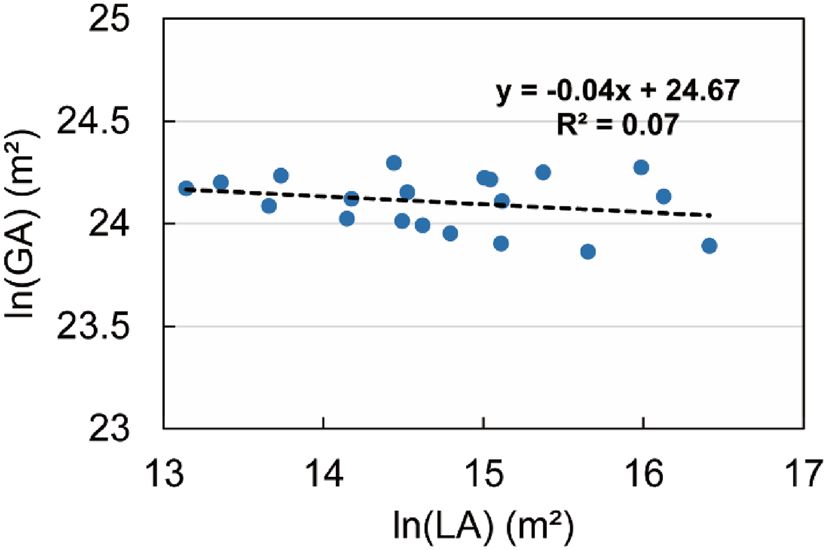
www.nature.com/scientificreports/
Figure 8. Comparison of glacial area in the study region for selected years. Panels (A–D) show glacial extent
in 2002 and four other years (2006, 2009, 2013 and 2017, respectively). In each case, red indicates glacial extent
lost during the time indicated, blue indicates glaciers present at both times. Panel E summarizes the overall
trends in glacial area (GA) and mean annual temperature (MAT) during 20 years studied (Figures created using
Arcgis10.2 https://www.esri.com/en-us/arcgis/products/arcgis-desktop).
Conclusion
In this work, we generated an inventory of 127 landslides in the HMA using Landsat data covering the 2 decades
between 1999 and 2018. Annual glacial area maps for the same 20 years were also generated. In addition to the
impact of image resolution, the rock surface and ice cover make landslide identification difficult in the HMA,
which may lead to the number of landslides being underestimated. Nevertheless, the landslide and glacial area
maps provide detailed spatial and temporal information. Based on our custom inventories, we studied the
interaction between landslides and glaciers in the study area. The following major conclusions can be drawn
from this work:
Scientific Reports | (2021) 11:1635 | https://doi.org/10.1038/s41598-021-81212-9 9
Vol.:(0123456789)www.nature.com/scientificreports/
Figure 9. Graph of landslide area and glacier area. GA represents glacier area, and LA represents landslide area,
and ln represents the natural log. The black dotted line is the linear trend line.
1. In the HMA, landslides are widespread. Over the past 2 decades, the area affected by landslide disasters has
increased. Both the number of landslides and the affected area was larger during the most recent 10 years
(2009–2018) compared to the previous 10 years (1999–2008). The area of landslides was anomalously high
in three out of four El Niño years.
2. Landslides in the HMA follow power-law (fractal) frequency statistics. The attenuation coefficient of the
10 years from 2009 onwards decreased compared to the previous 10 years, indicating that the probability of
occurrence of large landslides has increased.
3. Glacial area in the HMA has shown an overall downward trend over the past 20 years. Except for the Kara-
koram Mountains, most glaciers throughout the study area have been retreated. As the glacial area decreases,
the area of annual landslides has increased.
In summary, retreat of glaciers in the HMA of 20 years appears to be associated with more frequent land-
slides, and larger landslides. A weak negative correlation between annual landslides and glacial areas is evident.
Although local influences may have triggered landslides in the HMA, glacial retreat may be a useful proxy for
aspects of climate that control slope stability. If climate warming continues, the area of glaciers will further
decrease. As a result, the probability of large landslides in the HMA may continue to increase.
Received: 23 June 2020; Accepted: 5 January 2021
References
1. Balzano, B., Tarantino, A. & Ridley, A. Preliminary analysis on the impacts of the rhizosphere on occurrence of rainfall-induced
shallow landslides. Landslides 16, 1885–1901. https://doi.org/10.1007/s10346-019-01197-5 (2019).
2. Iverson, R. M. Landslide triggering by rain infiltration. Water Resour. Res. 36, 1897–1910. https://doi.org/10.1029/2000wr900090
(2000).
3. Serey, A. et al. Landslides induced by the 2010 Chile megathrust earthquake: A comprehensive inventory and correlations with
geological and seismic factors. Landslides 16, 1153–1165. https://doi.org/10.1007/s10346-019-01150-6 (2019).
4. Laimer, H. J. Anthropogenically induced landslides—A challenge for railway infrastructure in mountainous regions. Eng. Geol.
222, 92–101. https://doi.org/10.1016/j.enggeo.2017.03.015 (2017).
5. Haeberli, W. & Beniston, M. Climate change and its impacts on glaciers and permafrost in the Alps. Ambio 27, 258–265 (1998).
6. Coe, J. A. & Godt, J. Review of approaches for assessing the impact of climate change on landslide hazards (2012).
7. Geertsema, M., Clague, J. J. & Hasler, A. Influence of climate change on geohazards in Alaskan parks. Alaska Park Sci. 12, 81–85
(2013).
8. Kaab, A. et al. Remote sensing of glacier- and permafrost-related hazards in high mountains: an overview. Nat. Hazards Earth Syst.
Sci. 5, 527–554 (2005).
9. Noetzli, J. & Gruber, S. Transient thermal effects in Alpine permafrost. Cryosphere 3, 85–99. https://doi.org/10.5194/tc-3-85-2009
(2009).
10. Panek, T. Landslides and quaternary climate changes—The state of the art. Earth-Sci. Rev. 196, 22. https://doi.org/10.1016/j.earsc
irev.2019.05.015 (2019).
11. Fischer, L., Kaab, A., Huggel, C. & Noetzli, J. Geology, glacier retreat and permafrost degradation as controlling factors of
slope instabilities in a high-mountain rock wall: the Monte Rosa east face. Nat. Hazards Earth Syst. Sci. 6, 761–772. https://doi.
org/10.5194/nhess-6-761-2006 (2006).
12. Haeberli, W., Wegmann, M. & Vonder Muhll, D. Slope stability problems related to glacier shrinkage and permafrost degradation
in the Alps. Eclogae Geol. Helv. 90, 407–414 (1997).
13. Huggel, C., Clague, J. J. & Korup, O. Is climate change responsible for changing landslide activity in high mountains?. Earth Surf.
Process. Landf. 37, 77–91. https://doi.org/10.1002/esp.2223 (2012).
14. Ren, L. Y., Duan, K. Q. & Xin, R. Impact of future loss of glaciers on precipitation pattern: A case study from south-eastern Tibetan
Plateau. Atmos. Res. 242, 7. https://doi.org/10.1016/j.atmosres.2020.104984 (2020).
15. Coe, J. A., Bessette-Kirton, E. K. & Geertsema, M. Increasing rock-avalanche size and mobility in Glacier Bay National Park and
Preserve, Alaska detected from 1984 to 2016 Landsat imagery. Landslides 15, 393–407. https: //doi.org/10.1007/s10346 -017-0879-7
(2018).
16. Schneider, D., Huggel, C., Haeberli, W. & Kaitna, R. Unraveling driving factors for large rock–ice avalanche mobility. Earth Surf.
Process. Landf. 36, 1948–1966 (2011).
Scientific Reports | (2021) 11:1635 | https://doi.org/10.1038/s41598-021-81212-9 10
Vol:.(1234567890)www.nature.com/scientificreports/
17. Coe, J. A. Bellwether sites for evaluating changes in landslide frequency and magnitude in cryospheric mountainous terrain: a call
for systematic, long-term observations to decipher the impact of climate change. Landslides 17, 2483–2501. https: //doi.org/10.1007/
s10346-020-01462-y (2020).
18. Kraaijenbrink, P. D. A., Bierkens, M. F. P., Lutz, A. F. & Immerzeel, W. W. Impact of a global temperature rise of 1.5 degrees Celsius
on Asia’s glaciers. Nature 549, 257. https://doi.org/10.1038/nature23878 (2017).
19. Gul, C. et al. Using Landsat images to monitor changes in the snow-covered area of selected glaciers in northern Pakistan. J Mt.
Sci. 14, 2013–2027. https://doi.org/10.1007/s11629-016-4097-x (2017).
20. Hewitt, K. Catastrophic landslide deposits in the Karakoram Himalaya. Science 242, 64–67. https://doi.org/10.1126/scien
ce.242.4875.64 (1988).
21. Clague, J. J. & Evans, S. G. A review of catastrophic drainage of moraine-dammed lakes in British Columbia. Q. Sci. Rev. 19,
1763–1783. https://doi.org/10.1016/s0277-3791(00)00090-1 (2000).
22. Kyriou, A. & Nikolakopoulos, K. Landslide mapping using optical and radar data: a case study from Aminteo, Western Macedonia
Greece. Eur. J. Remote Sens https://doi.org/10.1080/22797254.2019.1681905 (2019).
23. Strom, A. & Abdrakhmatov, K. Rockslides and Rock Avalanches of Central Asia: Distribution, Morphology, and Internal Structure
(Elsevier, Amsterdam, 2018).
24. Moragues, S. et al. Slope instability analysis in South Patagonia applying multivariate and bivariate techniques on Landsat images
during 2001–2015 period. CATENA 174, 339–352. https://doi.org/10.1016/j.catena.2018.11.024 (2019).
25. Lacroix, P., Araujo, G., Hollingsworth, J. & Taipe, E. Self-entrainment motion of a slow-moving landslide inferred from Landsat-8
time series. J. Geophys. Res. Earth Surf. 124, 1201–1216. https://doi.org/10.1029/2018jf004920 (2019).
26. Chen, T. H. K., Prishchepov, A. V., Fensholt, R. & Sabel, C. E. Detecting and monitoring long-term landslides in urbanized areas
with nighttime light data and multi-seasonal Landsat imagery across Taiwan from 1998 to 2017. Remote Sens. Environ. 225,
317–327. https://doi.org/10.1016/j.rse.2019.03.013 (2019).
27. Varnes, D. J. Slope movement types and processes. Spec. Rep. 176, 11–33 (1978).
28. Keefer, D. K. Landslides caused by earthquakes. Geol. Soc. Am. Bull. 95, 406–421. https: //doi.org/10.1130/0016-7606(1984)95%3c406
:Lcbe%3e2.0.Co;2 (1984).
29. Zhang, J., Jia, L., Menenti, M. & Hu, G. J. R. S. Glacier facies mapping using a machine-learning algorithm: The Parlung Zangbo
Basin case study. Remote Sens. 11, 452 (2019).
30. Consortium, R. Randolph glacier inventory–a dataset of global glacier outlines: Version 6.0: technical report, global land ice
measurements from space, Colorado, USA. Digital Media. (2017).
31. Turcotte, D. L., Malamud, B. D., Guzzetti, F. & Reichenbach, P. Self-organization, the cascade model, and natural hazards. Proc.
Natl. Acad. Sci. U. S. A. 99, 2530–2537. https://doi.org/10.1073/pnas.012582199 (2002).
32. Guzzetti, F., Malamud, B. D., Turcotte, D. L. & Reichenbach, P. Power-law correlations of landslide areas in central Italy. Earth
Planet. Sci. Lett. 195, 169–183. https://doi.org/10.1016/s0012-821x(01)00589-1 (2002).
33. Malamud, B. D., Turcotte, D. L., Guzzetti, F. & Reichenbach, P. Landslide inventories and their statistical properties. Earth Surf.
Process. Landf. 29, 687–711 (2004).
34. Bessette-Kirton, E. & Coe, J. A. Inventory of rock avalanches in western Glacier Bay National Park and Preserve, Alaska, 1984–2016:
a baseline data set for evaluating the impact of climate change on avalanche magnitude, mobility, and frequency. (2016).
35. Soeters, R. & Van Westen, C. Slope instability recognition, analysis and zonation. Landslides Investig. Mitig. 247, 129–177 (1996).
36. Rienzner, M. Find Outliers with Thompson Tau (https://www.mathworks.com/matlabcentral/fileexchange/27553-find-outliers-
with-thompson-tau). MATLAB Central File Exchange Retrieved December 5, 2020 (2020).
37. Lei, Y. B. et al. Extreme lake level changes on the Tibetan Plateau associated with the 2015/2016 El Nino. Geophys. Res. Lett. 46,
5889–5898. https://doi.org/10.1029/2019gl081946 (2019).
38. Zhan, J. G., Shi, H. L., Wang, Y. & Yao, Y. X. Complex principal component analysis of mass balance changes on the Qinghai-Tibetan
Plateau. Cryosphere 11, 1487–1499. https://doi.org/10.5194/tc-11-1487-2017 (2017).
39. Bolch, T., Menounos, B. & Wheate, R. Landsat-based inventory of glaciers in western Canada, 1985–2005. Remote Sens. Environ.
114, 127–137. https://doi.org/10.1016/j.rse.2009.08.015 (2010).
40. Hewitt, K. The Karakoram anomaly? Glacier expansion and the ‘elevation effect Karakoram Himalaya’. Mt. Res. Dev. 25, 332–340
(2005).
41. Forsythe, N., Fowler, H. J., Li, X.-F., Blenkinsop, S. & Pritchard, D. Karakoram temperature and glacial melt driven by regional
atmospheric circulation variability. Nat. Clim. Change 7, 664–670 (2017).
Acknowledgements
This research was supported by the International Science & Technology Cooperation Program of China (No.
2018YFE010010001); by the National Natural Science Foundation of China (Nos. 41701458, 41941019); by the
Strategic Priority Research Program (Class A) of the Chinese Academy of Sciences (No. XDA23090503); by
the Second Tibetan Plateau Scientific Expedition and Research (STEP) program (No. 2019QZKK0904); by the
Sichuan Science and Technology Program (No. 2020YFS0354). We wish to thank Prof. Alexander Strom and
Prof. Timothy Warner for his comments in our study.
Author contributions
J.L. drafted the manuscript and was responsible for data preparation, experiment, and analysis. Y.W. was respon-
sible for the research design and analysis, designed and reviewed the manuscript. X.G. participated in data col-
lection. All authors contributed to the editing and reviewing of the manuscript. All authors have read and agreed
to the published version of the manuscript.
Competing interests
The authors declare no competing interests.
Additional information
Supplementary Information The online version contains supplementary material availlable at https://doi.
org/10.1038/s41598-021-81212-9.
Correspondence and requests for materials should be addressed to Y.W.
Reprints and permissions information is available at www.nature.com/reprints.
Scientific Reports | (2021) 11:1635 | https://doi.org/10.1038/s41598-021-81212-9 11
Vol.:(0123456789)www.nature.com/scientificreports/
Publisher’s note Springer Nature remains neutral with regard to jurisdictional claims in published maps and
institutional affiliations.
Open Access This article is licensed under a Creative Commons Attribution 4.0 International
License, which permits use, sharing, adaptation, distribution and reproduction in any medium or
format, as long as you give appropriate credit to the original author(s) and the source, provide a link to the
Creative Commons licence, and indicate if changes were made. The images or other third party material in this
article are included in the article’s Creative Commons licence, unless indicated otherwise in a credit line to the
material. If material is not included in the article’s Creative Commons licence and your intended use is not
permitted by statutory regulation or exceeds the permitted use, you will need to obtain permission directly from
the copyright holder. To view a copy of this licence, visit http://creativecommons.org/licenses/by/4.0/.
© The Author(s) 2021
Scientific Reports | (2021) 11:1635 | https://doi.org/10.1038/s41598-021-81212-9 12
Vol:.(1234567890)You can also read