On the Use of Satellite Imagery and GIS Tools to Detect and Characterize the Urbanization around Heritage Sites: The Case Studies of the Catacombs ...
←
→
Page content transcription
If your browser does not render page correctly, please read the page content below

sustainability

Article
On the Use of Satellite Imagery and GIS Tools to
Detect and Characterize the Urbanization around
Heritage Sites: The Case Studies of the Catacombs of
Mustafa Kamel in Alexandria, Egypt and the
Aragonese Castle in Baia, Italy
Abdelaziz Elfadaly 1,2 and Rosa Lasaponara 1, *
 1    Italian National Research Council, IMAA C.da Santa Loja, Tito Scalo, 85050 Potenza, Italy;
      abdelaziz.elfadaly@unibas.it
 2    Department of Population Studies and Archaeology, National Authority for Remote Sensing and
      Space Sciences, Cairo 1564, Egypt
 *    Correspondence: rosa.lasaponara@imaa.cnr.it; Tel.: +39-328-627-1131

 Received: 1 February 2019; Accepted: 27 March 2019; Published: 9 April 2019

 Abstract: The sustainable development of urban growth is a mandatory challenge to be addressed,
 as also highlighted in the Agenda 2030, and this requires suitable and sustainable planning strategies,
 as well as systematic and timely monitoring of urban expansion and its effects. In this context, satellite
 data (today also available free of charge) can provide both (i) historical time-series datasets, and (ii)
 timely updated information related to the current urban spatial structure and city edges, as well
 as parameters to assess urban features and their statistical characterization to better understand
 and manage the phenomenon. Nevertheless, it is important to highlight that the identification and
 mapping of urban areas is still today a complex challenge, due to the heterogeneities of materials,
 complexity of the features, etc. Our approach, herein adopted, addresses the challenges in using
 heterogeneous data from multiple data sources for change detection analysis to improve knowledge
 and monitoring of landscape over time with a specific focus on urban sprawl and land-use change
 around cultural properties and archaeological areas. Two significant test cases were selected: (i) one
 in Egypt, the Catacombs of Mustafa Kamel in Alexandria, and (ii) one in Italy, the Aragonese Castle in
 Baia–Naples. For both study areas, the changes in urban layers were identified over time from satellite
 data and investigated using spatial analytic tools to statistically characterize them. The results of this
 study showed that (i) the increase in urban areas is the main phenomenon around both heritage areas,
 (ii) this increase is sharper in developing countries (e.g., Egypt) than developed countries (e.g., Italy),
 (iii) the methodology herein adopted is suitable for both big and small urban changes as observed
 around the Catacombs of Mustafa Kamel and the Aragonese Castle.

 Keywords: urban sprawling; heritage management; free data; geographic information system (GIS);
 satellite images

1. Introduction
     Over the last few years, many archaeological sites suffered from many environmental risks
due to unplanned urbanization [1–6]. This study provides a short overview of space-based tools
today available for urban areas ranging from planning strategies to systematic monitoring activities.
In the last few decades, a rapid urbanization process occurred on the global scale, and it is still today
increasing. Actually, over half of the world’s population is living in urban areas and this is expected
to further increase to 70% by 2050. Therefore, the sustainable development of urban growth is a

Sustainability 2019, 11, 2110; doi:10.3390/su11072110                     www.mdpi.com/journal/sustainability
Sustainability 2019, 11, 2110                                                                       2 of 18

mandatory challenge to be addressed, and this requires suitable and sustainable planning strategies,
as well as systematic and timely monitoring of urban expansion and effects. To this aim, the availability
of reliable information on past and current conditions is a critical point for defining and planning
potential future scenarios.
      Since the early applications of Earth observation around 50 years ago, the mapping of cities and
towns has been a critical challenge to address. In the 1970s, the availability of Landsat Multispectral
Scanner System (MSS) pushed the early mapping of broad-scale changes at the urban–rural fringe.
From the processing point of view, the most commonly used approaches were mainly based on simple
band ratios, image thresholds, and image differencing [7–10]. Despite the early successful applications,
the limited spatial resolution compared to aerial photographs prevented and limited the use of satellite
data for urban areas. Actually, potential end-users such as decision-makers, urban planners, and land
managers continued for a long time to exploit aerial photographs and field surveys [11,12].
      Later, in the 1990s–2000s, the interest in global assessment of urbanization and its effects
pushed the use of medium to coarse resolution [13]. Moreover, additional scientific themes such
as climatology [14], hydrology [15], ecology [16], and public health [17] highlighted the importance of
using satellite in a global perspective to estimate the impacts of urban expansion on environmental
systems, and human health and well-being.
      Subsequently, around the 2000s, the availability of very-high-resolution satellite data, such as
IKONOS (1–4 m) and Quickbird (0.6–2.4 m), provided improved technical capabilities to characterize
urban features with increased spatial detail [18,19]. Nevertheless, the cost of new acquisitions of VHR
scenes, along with the sparse coverage of archived data, strongly limited once again the diffusion of
satellite images for urban monitoring.
      Actually, still today, medium-resolution (20–30 m) datasets such as Landsat and SPOT remain
the best compromise between the availability of historical datasets and spatial detail. In particular,
the Landsat Thematic Mapper (TM), Enhanced Thematic Mapper Plus (ETM+), and Operational Land
Imager (OLI) satellite systems were and are the most widely used tools. Their extensive and accessible
archives available for free in a wide range of environments were and are quite attractive for several
urban applications. The recent availability of data from Sentinel missions opened new prospective in
the field of satellite remote sensing for urban areas. Earth observation can today provide reliable tools
for urban mapping from global down to a local scale by capturing the physical characteristics of urban
places which generate spatial and spectral signatures. Nevertheless, it is important to highlight that the
identification and mapping of urban areas is still today a complex challenge, due to the heterogeneities
of features and materials, as well as the complexity and variations in size and shape of buildings and
urban blocks which create mixtures within pixels.
      Our approach, herein adopted, addresses the challenges in using heterogeneous information from
multiple data sources for change detection analysis to improve knowledge and monitoring of landscape
over time, with a specific focus on urban sprawl and land-use change around cultural properties and
archaeological areas. In the last few decades, the rapid urbanization/urban redevelopment initiatives
globally observed posed real challenges and opportunities for cultural heritage. Urban change can be
a serious threat to cultural properties and landscape, for example, (i) urban sprawl erases the history
of places, and (ii) the increase in urban areas induces an increase in atmospheric pollution and this,
in turn, leads to the degradation of historical buildings, etc.
      Cultural properties are particularly exposed to the negative effects of urban sprawl, considered
as one of the main threats to cultural heritage; see, for example, References [1,2] (https://
whc.unesco.org/en/factors/ and http://www.unesco.org/new/en/culture/themes/culture-and-
development/culture-for-sustainable-urban-development/). Moreover, “the 2030 Agenda’s 17
Sustainable Development Goals, SDG 11, on sustainable cities makes it clear that culture has an
essential role to play in realizing sustainable urban development, particularly through strengthened
efforts to protect and safeguard the world’s cultural and natural heritage” (http://www.unesco.org/
new/en/culture/themes/culture-and-development/culture-for-sustainable-urban-development/).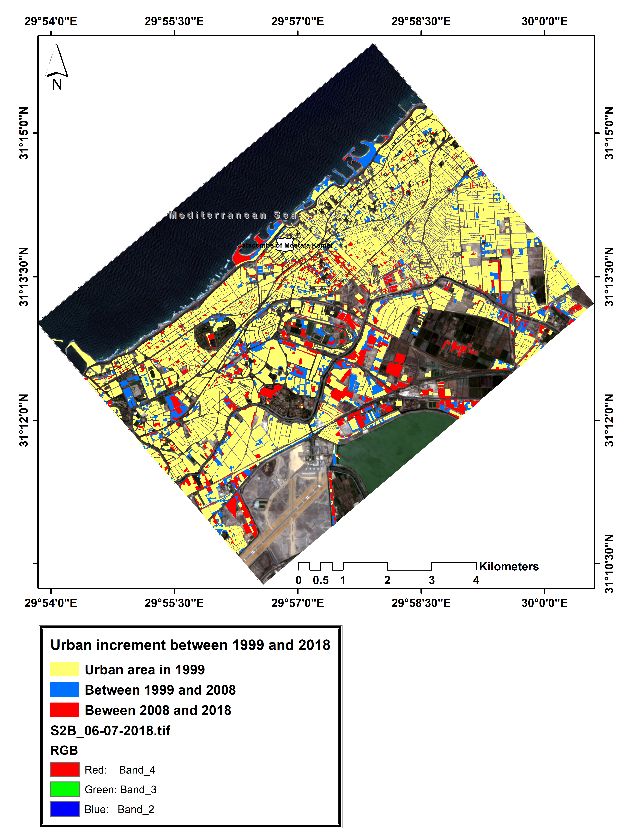
Sustainability 2019, 11, 2110                                                                       3 of 18

      To face this challenge, updated maps and related information are very important for urban
planners to design (urban and infrastructure) development plans sensitive to cultural heritage sites.
In particular, the use of satellite technologies today can suitably support the development planning
process, providing suitable free-of-charge tools useful for multitemporal analysis based on the past
and the current conditions, capturing changes at diverse temporal and spatial scales from global down
to a local level.
      Our effort is a contribution to the definition of the best practices and experiences regarding the
production of critical information necessary for the preservation of cultural heritage and the necessary
redevelopment of urban areas. Our approach is based on the joint use of (i) historical and updated
data available from satellite technologies at a global scale free of charge, and (ii) data processing to
extract useful information from the investigated dataset. In particular, the use of statistical analysis
allowed us (i) to perform multiscale investigations of changes in urban areas in terms of both size and
distribution, and (ii) to better capture and characterize the impact of changes delimiting urban sprawl
boundaries, generally regarded as a key indicator (useful for policy measure) to control chaotic and
sparse urban expansion. In other words, the use of diverse static indicators, described in Section 2,
are herein proposed as tools to detect, compare, and capture the impacts of urban sprawl over time
in a quantitative, objective, and reliable way for diverse case studies as in the test areas we selected
(see Section 2), representative of diverse ecosystems and geographic areas in Mediterranean towns
in Europe, as in the case of the Italian case study, and a desert setting in Africa, as in the case of the
Egyptian area.

2. Materials and Methods

2.1. Study Area
      The Roman historian Diodorus Siculus described Alexandria city (north of Egypt) as “the first
civilized city in all over the ancient world” [20]. The dates of Mostafa Kamel tombs return to the
late third and early second century before Christ (BC), the Greco-Roman era [21]. Mustafa Kamel
Necropolis lies to the northeast of Alexandra; this Necropolis lies about 150–200 m from the seashore,
and it is higher in topography than El-Shatbi and the new bibliotheca Alexandrina area. The structure
of the fist tomb includes rock-cut rooms and galleries. A broad stairway leads to a square court which
surrounded by Doric semi-columns, all cut into the walls, and leads to ten rooms distributed on the
four sides. On the other hand, the second tomb consists of a stairway leading to a central courtyard.
To the south stand, two Doric columns exist at the entrance of the room, which has luculi on both
sides. Another room, with two benches and luculi on both sides, is accessible. It was probably used for
prayer. At the end is a small room, in front of which a limestone offering table coated with colored
plaster in imitation of alabaster was found [22]. On the other hand, the site of Baia is considered one of
the most extensive submerged archaeological sites known in Italy. The site is characterized by urban
sites with residential houses, thermal baths, fisheries, and harbor buildings [23,24]. Baia Castle (Naples
in southern Italy) was built in 1495, under the Aragonese monarchy, upon important remnants of a
Roman villa. Presently, it hosts the Campi Flegrei Archaeological Museum [25] (Figure 1a). In this
paper, we exploited the integration of remote sensing, geographic information system (GIS), and
statistical analyses for the identification of changes and mapping of planned and unplanned urban
construction. To this aim, the datasets described in Table 1 were used for the analyses conducted in
study areas selected in Italy and Egypt.
      The change detection we performed was based on the use of a heterogeneous optical imagery
dataset, made up Landsat TM satellite images and the more recent Sentinel 2, freely available from
the United States Geological Survey (USGS) European Space Agency (ESA) web site, respectively.
The approach we adopted consisted of several steps, as shown in Figure 1b, based on the multitemporal
analysis of satellite data, suitably preprocessed as in Reference [1], with particular reference to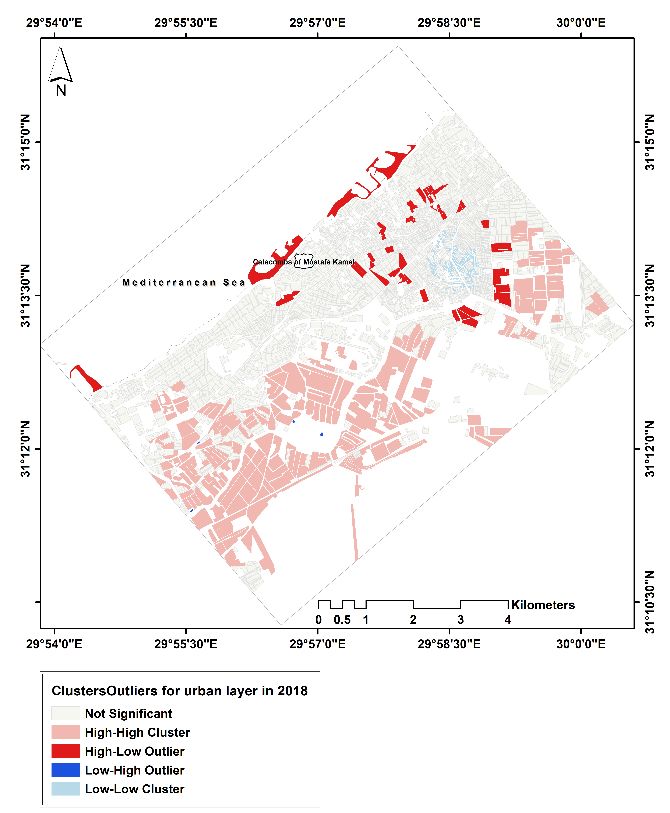
Sustainability 2019, 11, 2110                                                                                    4 of 18

(i) pre-processing, (ii) classification for the multidate analysis of urban expansion, and (iii) statistical
Sustainability
analyses of2019,
               the 11, x FOR PEER
                   multidate      REVIEW
                               maps  obtained from the satellite based categorization.               4 of 18

                                                          (a)
                                            Multi-temporal Landsat TM,
                                                  Sentinel 2 data

                                                    Pre-elaboration
                                          and computation of spectral indices

                                              Multi-date classification of TM
                                                      and Sentinel 2

                                                Maps of urban areas
                                                    and changes

                                             Global and local statistics

                                              Statistical Indicators

                                                          (b)

              1. (a)
      Figure 1.   (a)Locations
                       Locationsof the study
                                   of the    areasareas
                                           study   Google Earth Courtesy,
                                                        Google            indicatedindicated
                                                                Earth Courtesy,      by yellowby
                                                                                               arrows:  Aragonese
                                                                                                   yellow arrows:
      Castle in  Baia  (Italy) and   Catacombs   of Mustafa Kamel  in Alexandria    (Egypt);
      Aragonese Castle in Baia (Italy) and Catacombs of Mustafa Kamel in Alexandria (Egypt);  (b) flowchart of the
                                                                                                               (b)
      methodological
      flowchart   of the approach.
                         methodological approach.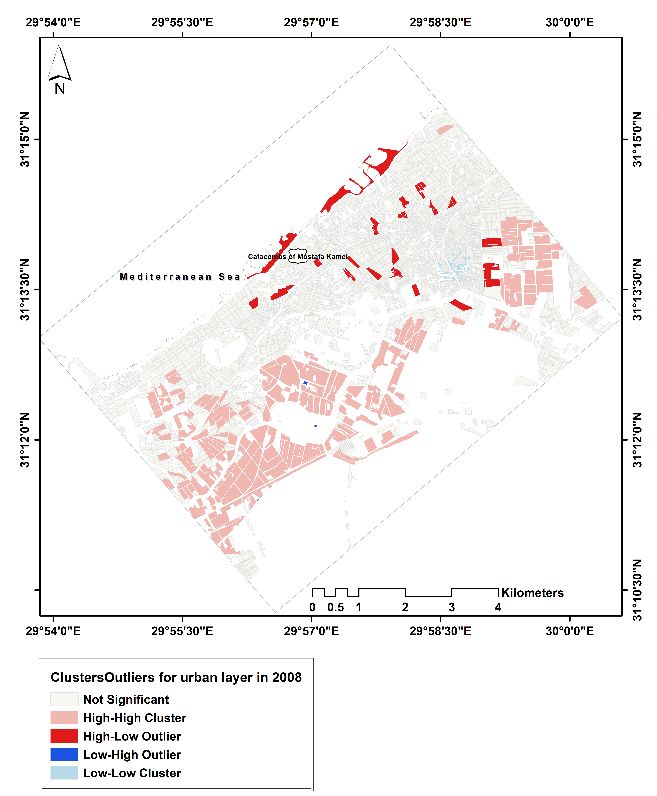
Sustainability 2019, 11, 2110                                                                            5 of 18

                                       Table 1. Main satellite images properties.

           Number          Satellite    Sensor        Resolution (M)       Acquisition Date    Source
                1          Landsat       TM4               30 m              July 1998, 1999   USGS
                2          Landsat       TM5               30 m                 July 2008      USGS
                3          Sentinel     2A, 2B             10 m                 July 2018      ESA

       In particular, we adopted (i) unsupervised classification for the identification of the prevailing
classes and their statistical distribution, (ii) supervised classification for the detection of urban areas,
(iii) comparison of the outputs from the diverse images acquired in diverse years for the extraction
and mapping of ongoing environmental changes with particular reference to urban sprawl, and
(iv) statistical analysis. After the categorization step, for the urban layer, statistical analyses were
applied in order (i) to perform multiscale investigations of changes in urban area in terms of both size
and distribution, and (ii) to better capture and characterize the impact of changes delimiting urban
sprawl boundaries, generally regarded as a key indicator (useful for policy measure) to control chaotic
and sparse urban expansion. To this aim, spatial analyst tools were used to identify (i) statistically
significant spatial clusters of high values (hot spots) and low values (cold spots), and (ii) the appropriate
scale of analysis. To assess the spatial dependence, the following tests were adopted: (i) local Getis-Ord
Gi* statistic, (ii) Local Moran’s I statistic, (iii) Ripley’s K function, and (iv) Global Moran’s I, which gives
five values: Moran’s I index, expected index, variance, z-score, and p-value. These values evaluate
whether the pattern expressed is clustered, dispersed, or random [26].

2.2. Optimized Hotspot Analysis
      The spatio-temporal hotspot detection was based on the use of Getis-Ord Gi* statistic to statistically
characterize and capture hot, non-significant, and cold spots. It is regarded as a useful tool for
supporting monitoring activities, early warning, and sustainable management [27] strategies. In more
detail, the optimized hotspot analysis identified statistically significant spatial clusters of high values
and low values using the Gi_Bin field to identify statistically significant hot and cold spots, for multiple
testing and spatial dependence using the false discovery rate (FDR) method. Features in the +/−3 bins
(features with a Gi_Bin value of either +3 or −3) were statistically significant at the 99% confidence
level; the clustering for features with 0 for the Gi_Bin field was not statistically significant, and the
features in the +/−2 bins reflected a 95% confidence level; features in the +/−1 bins reflected a 90%
confidence level [28].

2.3. Cluster and Outlier Analysis (Anselin Local Moran’s I)
      Anselin Local Moran’s I statistic [29] identifies statistically significant hot spots, cold spots,
and spatial outliers. This tool creates a new output feature class with Local Moran’s I index, z-score,
p-value, and cluster/outlier type (COType). Feature by feature, the z-scores and p-values are measures
of statistical significance which inform us whether or not to reject the null hypothesis. Furthermore,
this tool indicates whether the apparent similarity (a spatial clustering of either high or low values) or
dissimilarity (a spatial outlier) is more pronounced than one would expect in a random distribution.
In more detail, a high positive z-score for a feature indicates that the surrounding features have similar
values (either high values or low values). In the same way, The COType field in the output feature
class will be HH for a statistically significant cluster of high values and LL for a statistically significant
cluster of low values. A low negative z-score (for example, less than −3.96) for a feature indicates a
statistically significant spatial data outlier. On the other hand, the COType field in the output feature
class will indicate if the feature has a high value and is surrounded by features with low values (HL)
or if the feature has a low value and is surrounded by features with high values (LH) [30].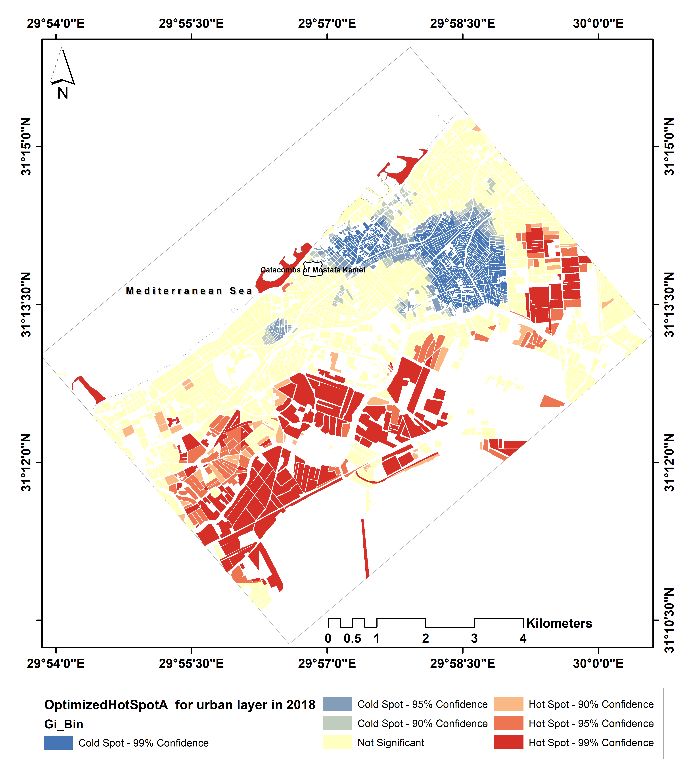
Sustainability 2019, 11, 2110                                                                                 6 of 18

2.4. Multi-Distance Spatial Cluster Analysis (Ripley’s K Function)
      Ripley’s K function definition is a tool which characterizes the spatial structure of a point or
polygon patterns by graph. It is widely used in urban and vegetation studies by testing its points or
polygon values against a null hypothesis. The test returns the p-value to reject the null hypothesis of
independence between point or polygon locations [31]. The K Function Graphic Usage tool requires
projected data to accurately measure distances. The tool output is a table with fields, whereby
ExpectedK and ObservedK contain the expected and observed K values, respectively. When the L(d)
transformation is applied, the ExpectedK values will always match the Distance value. On the other
hand, the K function will optionally create a graph layer summarizing the results.
      From the interpretation point of view, for a given distance (which denotes the scale of analysis),
if the observed K value is larger than the expected K value, the distribution is more clustered than
random, whereas, when the observed K value is smaller than the expected K value, the distribution is
more dispersed than random distribution at that distance (scale of analysis). Nevertheless, when the
observed K value is larger than the HiConfEnv value, the spatial clustering is statistically significant
for that distance (scale). Finally, when the observed K value is smaller than the LwConfEnv value,
spatial dispersion for that distance is statistically significant [32].

2.5. Spatial Autocorrelation (Global Moran’s I)
      Moran provided one of the first contributions to the discipline of spatial dynamics, and his index
is a statistical tool useful for (i) analyzing spatial behavior, and (ii) describing how density-independent
factors are correlated across wide regions [33]. In GIS software, the Spatial Autocorrelation tool gives
five values: Moran’s I index, expected index, variance, z-score, and p-value. This tool evaluates
whether the pattern expressed is clustered, dispersed, or random. For indicating whether or not to
reject the null hypothesis, this tool calculates a z-score and p-value. Optionally, when the z-score or
p-value indicates statistical significance, a positive Moran’s I index value indicates tendency toward
clustering. On the other hand, a negative Moran’s I index value indicates tendency toward dispersion.
Alternatively, the null hypothesis means that the feature values are randomly distributed across the
study area [34].

3. Results and Discussion

3.1. Accuracy Assessment Result
     The accuracy assessment of the classification step was performed using 200 points as reference;
among them, 50 points were related to urban area, 50 points were related to the Barren area, 50 points
were related to vegetation, and finally 50 points were related to the water bodies. For both study
areas, the classification accuracy was estimated considering these points as regions of interest (ROIs);
the kappa coefficient and overall accuracy were also computed (and shown in Table 2) using a
comparison with Google Earth satellite images.

      Table 2. Results of kappa coefficient and overall accuracy of the regions of interest (ROIs) for each of
      the investigated areas between 1998 and 2018.

                                      Alexandria Area                              Baia Area
          Year
                        Kappa Coefficient      Overall Accuracy    Kappa Coefficient       Overall Accuracy
       1998, 1999               96.2558%            0.9238              98.8012%                 0.9739
          2008                  96.4044%            0.9374              97.1354%                 0.9395
          2018                  92.8251%            0.8871              89.8701%                 0.7896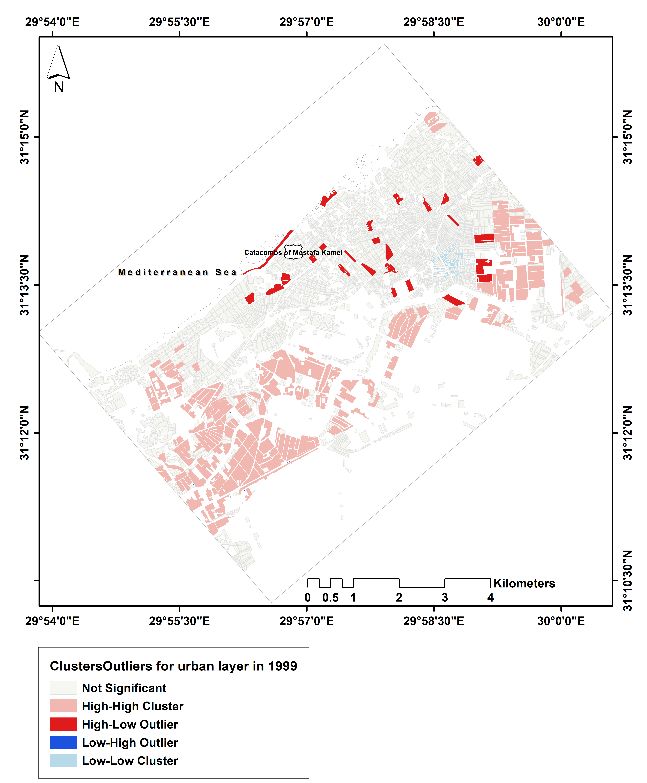
Sustainability 2019, 11, 2110                                                                                      7 of 18

      Results obtained for the Alexandria study area showed that the kappa coefficient and the overall
accuracy were (i) around 96.2558% and 0.9238, respectively, for 1999 data, (ii) around 96.4044% and
0.9374 for 2008 data, and (iii) around 0 92.8251 and 0.8871 in 2018.
      For the study area of Baia, the kappa coefficient and the overall accuracy were around (i) 98.8012%
and 0.9739, respectively, in 1998, (ii) around 97.1354% and 0.9395 in 2008, and (iii) around 89.8701 and
Sustainability 2019, 11, x FOR PEER REVIEW                                                                   7 of 18
0.7896 in 2018.
      For both study areas, the values of the kappa coefficient and overall accuracy decreased over time
      Table 2. Results of kappa coefficient and overall accuracy of the regions of interest (ROIs) for each of
due to   higher spatial resolution (and in turn higher heterogeneity) of the Sentinel 2 data compared
      the investigated areas between 1998 and 2018.
to TM.
                                   Alexandria Area                                 Baia Area
        Year
3.2. Change Detection Kappa Coefficient Overall Accuracy Kappa Coefficient Overall Accuracy
    1998,
      The 1999
            result from the  96.2558%
                                 analysis conducted0.9238
                                                     using Landsat TM4    98.8012%
                                                                            1998–1999, Landsat TM50.97392008, and
        2008                 96.4044%               0.9374                97.1354%                0.9395
Sentinel-2A-B 2018 imagery revealed that, for both study areas, the urban cover increased continuously
over the2018
           whole investigated92.8251%               0.8871
                                   period (1998 to 2018; see Table 3). In 89.8701%                0.7896the urban
                                                                          more detail, for Alexandria,
sprawl increased by around 1.96 km2 from 1999 to 2008, and it increased by around 2.39 km2 from
3.2. Change
2008  to 2018Detection
              (Figure 2). For Baia, the urban expansion increased by around 0.61 km2 from 1998 to 2008,
and itThe
        continued  increasing  by around  0.51 km2 from 2008 to 2018 (Figure 3).
           result from  the analysis  conducted using Landsat TM4 1998–1999, Landsat TM5 2008, and
Sentinel-2A-B 2018 imagery revealed that, for both               study areas, the urban cover increased
    Table 3. Total changes in urban area (expressed in km2 ) between 1998 and 2018 in Baia and Alexandria.
continuously over the whole investigated period (1998 to 2018; see Table 3). In more detail, for
Alexandria, the urban sprawl   1998,increased
                                     1999     byChange
                                                  around 1.96 km2 from       1999 toChange
                                                                                      2008, and it increased   by
    Class     Study Area              2)                   2    2008 (km2 )                   2    2018 (km2 )
                                 (km        Detection ± km                     Detection ± km
around 2.39 km from 2008 to 2018 (Figure 2). For Baia, the urban expansion increased by around 0.61
                 2

km2 from 1998Alexandria
                to 2008, and it16.44              1.96
                                  continued increasing   by around  18.40.51 km2 from2.39             20.79
                                                                                        2008 to 2018 (Figure   3).
               Change %                          45.06%                             54.94%
     As a
    Urban
          whole,   between    1998  and  2018 both investigated   areas   showed  an  increasing trend   of urban
areas; nevertheless,
                   Baia the changes
                                  3.58observed for0.61
                                                    Alexandria were 4.19actually enormous
                                                                                     0.51    and more  4.7random
               Change for
than those observed      % the Baia case study.54.46%                               45.54%

                                (a)                                                      (b)

              2. Changes in the urban
      Figure 2.                   urban layer
                                          layer between
                                                between 1998 and 2018:2018: (a) increase in urban area around
                                                                                                        around the
                                                                                                                the
      Catacombs of
      Catacombs    ofMustafa
                      MustafaKamel
                                 Kamel   (Alexandria,
                                      (Alexandria,     Egypt);
                                                    Egypt);       (b) increase
                                                              (b) increase      in urban
                                                                           in urban         area around
                                                                                      area around        Aragonese
                                                                                                   Aragonese  Castle
      CastleNaples,
      (Baia, (Baia, Naples,  Italy).
                     Italy). The     The yellow
                                 yellow   arrows arrows
                                                  indicateindicate  the location
                                                            the location          of the cultural
                                                                          of the cultural         properties.
                                                                                          properties.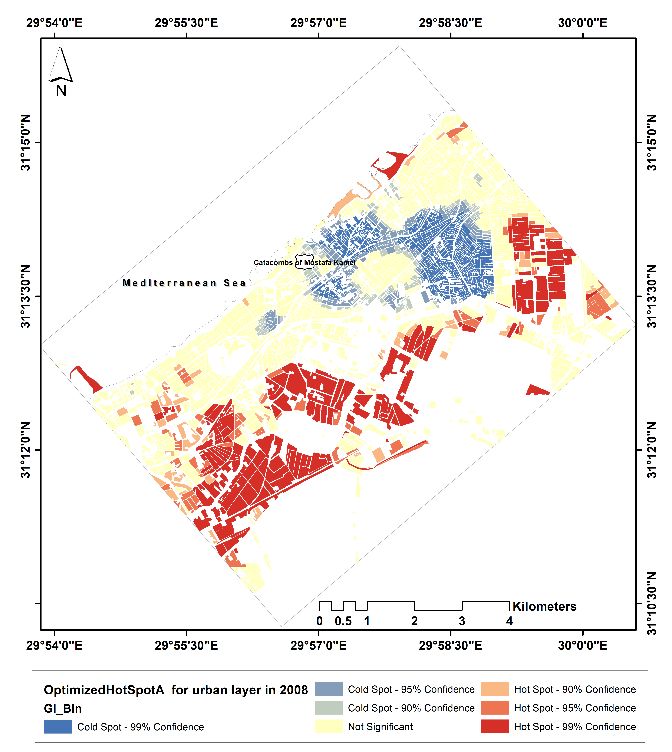
Sustainability 2019, 11, 2110                                                                                    8 of 18
 Sustainability 2019, 11, x FOR PEER REVIEW                                                                      8 of 18

                        The changes in the urban spaces around the both study
                  25.00             areas between 1998 and 2018

                                                           y = 0.2175x - 418.2
                                                               R² = 0.9968
                  20.00

                  15.00
                                                                                                  Alexandria
            KM2

                                                                                                  by (km2)
                                                                                                  Baia by
                  10.00                                                                           (km2)

                                                           y = 0.056x - 108.29
                                                               R² = 0.9973
                   5.00

                   0.00
                       1995      2000           2005          2010          2015          2020
                                                       YEAR

      Figure 3. Graph of the increase in urban area around the Catacombs of Mustafa Kamel (Alexandria,
       Figure 3. Graph of the increase in urban area around the Catacombs of Mustafa Kamel (Alexandria,
      Egypt) and Aragonese Castle (Baia, Naples, Italy).
       Egypt) and Aragonese Castle (Baia, Naples, Italy).

      As a whole, between 1998 and 2018 both investigated areas       showed an increasing trend of urban
       Table 3. Total changes in urban area (expressed in km2) between 1998 and 2018 in Baia and
areas; nevertheless, the changes observed for Alexandria were actually enormous and more random
       Alexandria.
than those observed for the Baia case study.
                                 1998, 1999        Change            2008         Change            2018
3.3. Class      Study Area
     Spatial Statistcs             (km2)        Detection ± km2 (km2) Detection ± km2              (km2)
                 Alexandria
      The optimized                 16.44
                       hotspot analysis tool was used1.96            18.4
                                                       to calculate the             2.39 distribution
                                                                        pattern of spatial         20.79
                                                                                                       in the
                 Change   %                         45.06%                        54.94%
urban areas of Alexandria and Baia. The Gi_Bin field identified the statistically significant hotspots,
    Urban
along  with the non-significant and cold spots, which indicate the type of clusters for the urban layers.
                     Baia
In the case of Alexandria,          3.58field showed 0.61
                            the Gi_Bin                that the urban4.19
                                                                      space around0.51               4.7 area
                                                                                     the archaeological
                 Change   %                         54.46%                        45.54%
was characterized by cold spots and non-significant types, whereas the hotspots were localized in the
edge of the study area and especially in the south side of the heritage property in 1999 (Figure 4a).
 3.3. The
      Spatial
          areaStatistcs
                of Aragonese Castle was surrounded by non-significant cluster types, whereas the cold
spots were  located in hotspot
       The optimized     a small area   on the
                                   analysis  toolnorth
                                                   was side
                                                         usedoftothe heritagethe
                                                                   calculate    property,
                                                                                   pattern and   the hotspot
                                                                                            of spatial         clustersin
                                                                                                         distribution
were  spread  in five  small  areas  on the north,   south,  and   west   sides in 1998  (Figure
 the urban areas of Alexandria and Baia. The Gi_Bin field identified the statistically significant 4b).
     Progressively,
 hotspots,  along with thethe
                           situation   observed and
                               non-significant     for both
                                                        cold study
                                                              spots, areas
                                                                       whichtotally   changed.
                                                                               indicate  the typeInofmore    detail,
                                                                                                        clusters  forfor
                                                                                                                      the
Alexandria,   the  non-significant    cluster  type  decreased     and   changed   to  hotspots
 urban layers. In the case of Alexandria, the Gi_Bin field showed that the urban space around the in 2008   (Figure  5a)
and  similar behavior
 archaeological   area waswascharacterized
                                also observed byforcoldthe urban
                                                         spots  andarea    around Aragonese
                                                                     non-significant              Castle (Figure
                                                                                        types, whereas               5b).
                                                                                                           the hotspots
Furthermore,
 were localized theinurban  areas
                      the edge   of around
                                    the studyboth
                                                areaculture  properties
                                                      and especially     in moved   from
                                                                            the south     a non-significant
                                                                                       side                     type to
                                                                                             of the heritage property
hotspots in 2018   (Figure
 in 1999 (Figure 4a).       6a,b) in  the case  of Alexandria,    this trend  was  more   clearly  focused   compared
to Baia.
       The area of Aragonese Castle was surrounded by non-significant cluster types, whereas the cold
 spots were located in a small area on the north side of the heritage property, and the hotspot clusters
 were spread in five small areas on the north, south, and west sides in 1998 (Figure 4b).
      Progressively, the situation observed for both study areas totally changed. In more detail, for
 Alexandria, the non-significant cluster type decreased and changed to hotspots in 2008 (Figure 5a)
 and similar behavior was also observed for the urban area around Aragonese Castle (Figure 5b).
 Furthermore, the urban areas around both culture properties moved from a non-significant type to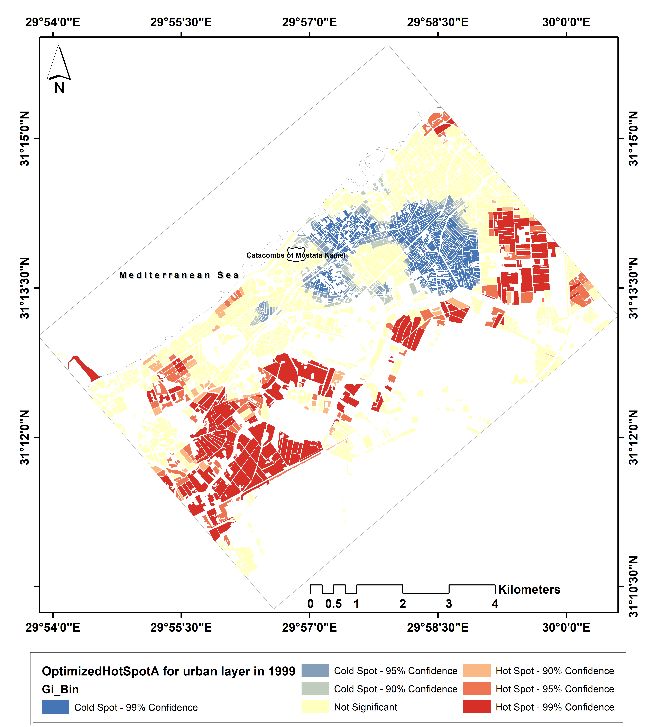
Sustainability
Sustainability 2019,
2019, 11,
11, xx FOR
FOR PEER
PEER REVIEW
REVIEW 99 of
of 18
18
hotspots in 2018 (Figures 6a,b)
hotspots in
Sustainability 2018
2019, 6a,b) in
in the
(Figures
11, 2110 the case
case of
of Alexandria,
Alexandria, this
this trend
trend was
was more
more clearly
clearly focused
focused
9 of 18
compared to Baia.
compared to Baia.
(a)
(a) (b)
(b)
Figure
Figure 4.4.
Figure Levels
4. Levels of
Levels of distribution
of distribution
distribution inin urban
in urban layers
urban layers using
layers using the
using the optimized
theoptimized hotspot
optimized hotspot tool:
hotspottool: (a)
tool: (a) differences
(a) differences
differences
between
betweencold
between cold spot,
coldspot,
spot, non-significant,
non-significant,
non-significant, andand
and hotspot
hotspot
hotspot levels
levels
levels around
around
around the
the archaeological
area ofarea
archaeological
the archaeological area of
of Mustafa
Mustafa Mustafa
Kamel
Kamel
Kamel Necropolises
Necropolises
Necropolises in
in Alexandria,
Egypt inEgypt
Alexandria,
in Alexandria, 1999; in
Egypt (b)1999;
in 1999; (b)
(b) the
the open the
andopen
open and closed
closedinspaces
andspaces
closed spaces in
in the
the urban the urban
urban
layer layer
layer
around
around
around
the Castlethe
the Castle
ofCastle of Aragonese
of Aragonese
Aragonese in Baia,
in Baia,
in Baia, Italy Italy in 1998.
Italy in 1998.
in 1998.
(a)
(a) (b)
(b)
Figure
Figure5.5.
Figure Urban
5.Urban distribution
Urbandistribution using
distribution using the
using the optimized
theoptimized hotspot
optimizedhotspot tool
hotspottool in
toolin 2008:
in2008: (a)
2008: (a) differences
(a)differences between
differencesbetween cold
betweencold
cold
spot,
spot, non-significant,
non-significant, and and hotspot
hotspot levelslevels
around around
the the archaeological
archaeological area of area
Mustafa
spot, non-significant, and hotspot levels around the archaeological area of Mustafa Kamel of
KamelMustafa Kamel
Necropolises
Necropolises
in Alexandria, in
Necropolises in Alexandria,
Egypt; Egypt;
(b) the open
Alexandria, and(b)
Egypt; the
closed
(b) open
open and
the spaces closed
in the
and urbanspaces
closed in
in the
the urban
layer around
spaces layer
the Castle
urban of around
layer the
Aragonese
around the
Castle
in Baia,of Aragonese
Italy. in Baia, Italy.
Castle of Aragonese in Baia, Italy.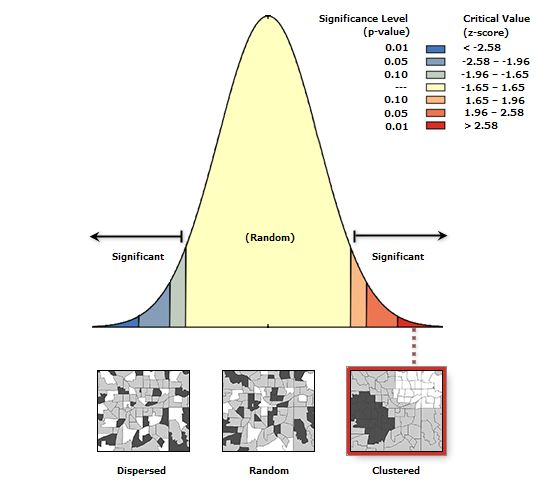
Sustainability 2019, 11, 2110 10 of 18
Sustainability 2019, 11, x FOR PEER REVIEW 10 of 18
(a) (b)
Figure 6. High levels in the
the hotspot
hotspot areas
areas in the
the urban
urban layers
layers using
using the
the optimized
optimized hotspot
hotspot tool
tool in
in 2018:
2018:
differences between
(a) differences betweencold
coldspot,
spot,non-significant,
non-significant,and
andhotspot
hotspotlevels
levels around
around thethe archaeological
archaeological area
area of
of Mustafa
Mustafa Kamel
Kamel Necropolises
Necropolises in Alexandria,
in Alexandria, Egypt;
Egypt; (b) open
(b) the the open and closed
and closed spacesspaces
in theinurban
the urban
layer
layer around
around the Castle
the Castle of Aragonese
of Aragonese in Italy.
in Baia, Baia, Italy.
The optimized hotspot analysis tool was coupled with the cluster and outlier analysis (Anselin
Local Moran’s
Moran’sI)I)toto assess thethe
assess pattern of spatial
pattern distribution
of spatial measuring
distribution the similarity
measuring of nearby
the similarity of features
nearby
around
featuresthe Catacombs
around of Mustafa
the Catacombs of Kamel
Mustafa inKamel
Alexandria and the Aragonese
in Alexandria Castle in Castle
and the Aragonese Baia. in Baia.
In 1999, the cluster/outlier
cluster/outlier typetype (COType)
(COType) results
results showed
showed that
that the study area of Alexandria
Alexandria
included non-significant
non-significant states
states around
aroundthe theheritage
heritagearea.area.The
Thehigh/high
high/high cluster area was
cluster area was presentedpresentedin
in
thethe
edgeedge
of of
thethe study
study area,
area, andand
thethe high/low
high/low outlier
outlier typetype
waswas spread
spread across
across manymany points
points aroundaround
the
the heritage
heritage area.
area. Finally,
Finally, thethe low/low
low/low cluster
cluster type type appeared
appeared ononthe
thesoutheast
southeastsidesideof ofthe
the heritage
heritage site
(Figure 7a). On the other hand, the non-significant type was the dominant status in 1998 in the Baia
area, while the high/high cluster type
high/high cluster type was
was focused
focused in in some
some ofof the
the areas around the heritage area in
Baia. In the same year, the high/low outlier type was presented
high/low outlier type was presented in little in little areas
areas around
around the heritage area
(Figure 7b). Gradually, the increase in the Anselin Local Moran’s I value was the dominant status in
both study
studyareas
areasin in
2008. TheThe
2008. non-significant type decreased
non-significant around around
type decreased the heritage
the area at thearea
heritage Catacombs
at the
of Mustafa Kamel. Furthermore, the high/high cluster area increased in Alexandria
Catacombs of Mustafa Kamel. Furthermore, the high/high cluster area increased in Alexandria on the on the edge of
the
edgestudy
of thearea,
study while
area,the high/low
while outlieroutlier
the high/low type increased acrossacross
type increased manymanypointspoints
near thenearheritage area.
the heritage
Finally,
area. Finally, the low/low cluster type remained as in the previous status (Figure 8a). ConcerningBaia
the low/low cluster type remained as in the previous status (Figure 8a). Concerning the the
area in the
Baia area insame year,year,
the same the the
level of increase
level of increase in in
high/high
high/highclusters
clusterscontinued
continuedin in the
the same direction,
direction,
while the high/low
high/lowoutlier
outlierandandnon-significant
non-significant status
status decreased
decreased in 2008
in 2008 (Figure
(Figure 8b).8b). Furthermore,
Furthermore, the
the increases in the high/high cluster and high/low outlier types were the dominant
increases in the high/high cluster and high/low outlier types were the dominant statuses in both study statuses in both
study
areas inareas
2018in(Figures
2018 (Figure
9a,b).9a,b).
Finally, the results obtained from both the optimized hotspot analysis (based on Getis) and
outlier analysis (based on Moran) clearly pointed out that changes in the urban lands between 1998
and 2018 were more random and unplanned in the case of Alexandria than in the Baia study area.Sustainability 2019, 11, 2110 11 of 18
Sustainability
Sustainability 2019,
2019, 11,
11, xx FOR
FOR PEER
PEER REVIEW
REVIEW 11
11 of
of 18
18
(a)
(a) (b)
(b)
Figure 7.
7. High
Figure 7. High and
and low
low clusters
clusters in the urban
in the urban layer
urban layer using
layer using the
using the cluster
the cluster outliers
cluster outliers tool:
tool: (a)
outliers tool: the gradient
the gradient
(a) the gradient
between the significant, high,
high, and low clusters in the urban land around the heritage area of Mustafa
significant, high,
between the significant, and low clusters in the urban land around the heritage area of Mustafa
Kamel
Kamel tombs in Alexandria, Egypt
tombs in Alexandria, Egypt inin 1999;
1999; (b)
(b) the
the significant,
significant, high,
high, and
and low
low levels
levels in
in the
the urban
urban areas
areas
around Aragonese Castle
Aragonese Castle
around Aragonese in
Castle in Baia,
in Baia, Italy
Baia, Italy in
Italy in 1998.
in 1998.
1998.
(a)
(a) (b)
(b)
Figure 8.
Figure 8. High
8. High
Highandand low
andlow
low clusters
clusters in
in the
in the
clusters urban
the urban
layerlayer
urban usingusing
layer the
the cluster
the cluster
using outliersoutliers
cluster tool
tool in
tool in 2008:
outliers (a)2008:
in (a)
(a) the
the gradient
2008: the
gradient
gradient between the significant, high, and low clusters in the urban land around the heritage area of
between between
the the significant,
significant, high, and high,
low and low
clusters clusters
in the in
urban the urban
land land
around around
the the
heritage heritage
area of area
Mustafaof
Mustafa
Kamel
Mustafa Kamel
tombs
Kamelintombs in
in Alexandria,
Alexandria,
tombs Egypt; (b)
Alexandria, Egypt; (b)
(b) the
the significant,
the significant,
Egypt; high, and
significant, high,
lowand
high, low
levels
and lowinlevels in
in the
the urban
levels urban
theareas
urban areas
around
areas
around
around Aragonese
Aragonese Castle inCastle
Aragonese Castle in
in Baia,
Baia, Italy.
Baia, Italy. Italy.Sustainability 2019, 11, 2110 12 of 18
Sustainability 2019, 11, x FOR PEER REVIEW 12 of 18
(a) (b)
Figure 9.
9. High
Highand
andlowlowclusters
clusters in the
in the urban
urban layerlayer
usingusing the cluster
the cluster outliers
outliers tool in
tool in 2018: (a)2018: (a) the
the gradient
gradient
between between the significant,
the significant, high, andhigh, and low in
low clusters clusters in the
the urban urban
land landthe
around around the heritage
heritage area of
area of Mustafa
Mustafa Kamel
Kamel tombs intombs in Alexandria,
Alexandria, Egypt; (b)Egypt; (b) the significant,
the significant, high, andhigh,
lowand lowinlevels
levels in thearea
the urban urban area
around
around Aragonese
Aragonese Castle inCastle
Baia, in Baia, Italy.
Italy.
Finally, the
Ripley’s results obtained
K function tool wasfrom
usedboth the optimized
to estimate the urban hotspot analysisaccording
distribution (based ontoGetis) and outlier
the relationship
analysis (based on Moran) clearly pointed out that changes in the urban lands between
between the clustered and dispersed factors. In more detail, this tool can calculate (i) the statistically 1998 and 2018
were more clustering
significant random and at unplanned in the case
smaller distances, andof(ii)
Alexandria than inatthe
the dispersion Baiadistances
larger study area. for the urban
Ripley’s K function tool was used to estimate the urban distribution
distributions over the years. The results from Ripley’s K function showed that the observed according to the relationship
spatial
betweenstarted
pattern the clustered and dispersed
and finished with the factors. In more
statistically detail, this
significant tool canatcalculate
dispersion (i) the statistically
larger distances in a short
significant
space. On theclustering
other hand,at smaller
there wasdistances, andsignificant
statistically (ii) the dispersion
clusteringatatlarger
smaller distances
distancesfor in the urban
the larger
distributions over the years. The results from Ripley’s K function showed
space in the Alexandria area in 1999 (Figure 10a). Furthermore, the observed spatial pattern had thethat the observed spatial
pattern
same started
status and finished
as previously withwith the statistically
a statistically significant
significant dispersion
dispersion at largerat larger distances
distances in aspace.
in a short short
space. On the other hand, there was statistically significant clustering at smaller
In contrast, for the highest value in the L(d) and distance, the observed spatial pattern exhibited distances in the larger
space in thesignificant
statistically Alexandria area in 1999
clustering (Figure
at smaller 10a). Furthermore,
distances in the Alexandria the observed
area in 2008spatial pattern
(Figure 11a).had
On
the other
the same status
hand, inas 2018,
previously with a statistically
the observed spatial patternsignificant
presenteddispersion
the status at larger distancessignificant
of statistically in a short
space.clustering
with In contrast, for the highest
at smaller value
distances andindispersion
the L(d) and distance,
at larger the observed
distances spatial pattern
in the Alexandria areaexhibited
(Figure
statistically significant clustering at smaller distances in the Alexandria area in 2008 (Figure 11a). On the
12a).
otherInhand, in 2018,
the case the observed
of Baia, the resultspatial patternKpresented
of Ripley’s function the statusthat
showed of statistically significant
the statistically with
significant
clustering at smaller distances and dispersion at larger distances in the Alexandria
at smaller distances presented the dominant status in 1998 (Figure 10b). In the same area (Figure 12a).
In thethe
direction, case of Baia,spatial
observed the result of Ripley’s
pattern K function
had statistically showed that
significant the statistically
clustering at smallersignificant
distances
clustering at smaller distances presented the dominant status in 1998
between the clustered pattern and dispersed pattern factors in the Baia area in 2008 (Figure (Figure 10b). In the same
11b).
direction, thethe
Furthermore, observed
observed spatial pattern
spatial pattern had
hadstatistically
statisticallysignificant
significantclustering
clusteringat at smaller
smaller distances
between
in the clustered
the general pattern
view between theand dispersed
clustered pattern
pattern factors inpattern
and dispersed the Baia area in
factors 2008 (Figure
(Figure 12b). 11b).
Furthermore, the observed spatial pattern had statistically significant clustering
As a whole, according to the total results of Ripley’s K function, the changes between at smaller distances
1998 andin
the general
2018 view between
in the built-up the clustered
areas were clearer andpattern
moreand dispersed
random pattern factors
for Alexandria than (Figure
Baia. 12b).Sustainability 2019, 11, 2110 13 of 18
Sustainability 2019, 11, x FOR PEER REVIEW 13 of 18
(a) (b)
Figure
Figure 10.10. Relationship
Relationship between
between thethe building
building areas
areas and and the open
the open spacesspaces according
according to theto the between
space space
between the red line “observed spatial pattern” and blue line “random spatial pattern”: (a)
the red line “observed spatial pattern” and blue line “random spatial pattern”: (a) K function value K function
value according
according to theinside
to the spaces spacesand
inside and between
between the built-up
the built-up areas around
areas around the Catacombs
the Catacombs of Mustafa
of Mustafa Kamel,
Alexandria, Egypt in 1999; (b) K function results according to the output of the built-up areas areas
Kamel, Alexandria, Egypt in 1999; (b) K function results according to the output of the built-up around
thearound the Aragonese
Aragonese Castle,
Castle, Baia, ItalyBaia, Italy in 1998.
in 1998.
(a) (b)
Figure
Figure 11.11. Relationship
Relationship between
between thethe building
building areas
areas and and the open
the open spacesspaces according
according to theto the between
space space
between the red line “observed spatial pattern” and blue line “random spatial pattern” in
the red line “observed spatial pattern” and blue line “random spatial pattern” in 2008: (a) K function 2008: (a) K
function value according to the spaces inside and between the built-up areas around
value according to the spaces inside and between the built-up areas around the Catacombs of Mustafathe Catacombs
of Mustafa
Kamel, Kamel,Egypt;
Alexandria, Alexandria,
(b) K Egypt;
function(b)results
K function resultstoaccording
according the output to of
thethe
output of the
built-up built-up
areas around
theareas around Castle,
Aragonese the Aragonese Castle, Baia, Italy.
Baia, Italy.
(a) (b)
Figure
Figure 12.12. Relationship
Relationship between
between thethe building
building areas
areas and and the open
the open spaces
spaces according
according to theto the between
space space
thebetween
red linethe red line “observed
“observed spatial and
spatial pattern” pattern”
blue and
lineblue line “random
“random spatial pattern”
spatial pattern” in 2018:in(a)
2018: (a) K
K function
function value according to the spaces inside and between the built-up areas around
value according to the spaces inside and between the built-up areas around the Catacombs of Mustafathe Catacombs
of Mustafa
Kamel Kamel Egypt);
(Alexandria, (Alexandria,
(b) KEgypt); (b)results
function K function resultstoaccording
according the outputto of
thethe
output of the
built-up built-up
areas around
areas around the Aragonese Castle at
the Aragonese Castle at Baia (Naples, Italy).Baia (Naples, Italy).Sustainability 2019, 11, 2110 14 of 18
As a whole, according to the total results of Ripley’s K function, the changes between 1998 and
2018 in the built-up areas were clearer and more random for Alexandria than Baia.
The results obtained from the pattern analyses performed using Global Moran’s I for Alexandria
and Baia are shown in Tables 4 and 5, respectively. The key elements for the interpretation of these
tables are shown in Figure 13.
Table 4. Urban distribution patterns obtained from spatial autocorrelation for the area around the
Catacombs of Mustafa Kamel between 1999 and 2018.
Year Moran’s Index z-Score Type of Spatial Distribution
Sustainability 2019, 11, x FOR PEER REVIEW 14 of 18
1999 0.236786 66.648117 Clustered
2008 0.131808 49.497299 Clustered
The results obtained
2018from the pattern analyses56.709045
0.114997 performed using Global Moran’s I for Alexandria
Clustered
and Baia are shown in Tables 4 and 5, respectively. The key elements for the interpretation of these
tables are shown in Figure 13.
Table 5. Urban distribution patterns obtained from spatial autocorrelation for the area around
In particular, Table
Aragonese 4 shows
Castle that,
between 1998for 1999,
and 2018.the z-score was around 66.64, and Moran’s index was
around 0.23, and the type of spatial distribution was clustered. These values decreased in 2008 to be
Year
49.49 for the z-score and Moran’s Index
0.13 for Moran’s index, whilez-Score
the spatial Type of Spatial
distribution hadDistribution
the same status as
a cluster type (Table 4). In contrast,0.057303
1998 the value of z-score
9.354977increased in 2018Clustered
to 56.7, and the value of
0.051683
2008 to 0.11, while
Moran’s I decreased again the spatial8.473026 Clustered
distribution type remained as the clustered type
2018 0.063031 10.685925 Clustered
(Figure 13).
Figure 13. Graph of Global Moran’s I using the spatial autocorrelation technique for the urban layer,
Figuredescribing
13. Graph oftheGlobal
changes between
Moran’s the the
I using significant and random status
spatial autocorrelation and the
technique gradient
for the urban between
layer, the
dispersed,
describing random,
the changes and clustered
between status. and random status and the gradient between the
the significant
dispersed, random, and clustered status.
In particular, Table 4 shows that, for 1999, the z-score was around 66.64, and Moran’s index was
around
The result0.23, and theMoran’s
of Global type of Ispatial distribution
for Baia showed that was clustered.
z-score was These values decreased
9.35, Moran’s index wasin0.057,
2008 to be
49.49 for the z-score
and the type of spatial distribution was clustered in 1998. These values decreased in 2008 to be 8.47status
and 0.13 for Moran’s index, while the spatial distribution had the same
as a cluster
for z-score type
and 0.051 for(Table 4). In
Moran’s contrast,
index, whilethe
thevalue
spatial z-score increased
of distribution in 2018
had the sameto 56.7,as
status and the value of
a cluster
type (Table 5). The value of z-score increased in 2018 to 10.68, and the value of Moran’s I increased type
Moran’s I decreased again to 0.11, while the spatial distribution type remained as the clustered
also to(Figure 13). the spatial distribution type remained as the clustered type (Figure 13).
0.063, while
The result of Global Moran’s I for Baia showed that z-score was 9.35, Moran’s index was 0.057,
and the
Table type of
4. Urban spatial distribution
distribution was clustered
patterns obtained in 1998.
from spatial These values
autocorrelation fordecreased in 2008the
the area around to be 8.47 for
Catacombs of Mustafa Kamel between 1999 and 2018.
Moran’s
Year z-Score Type of Spatial Distribution
Index
1999 0.236786 66.648117 Clustered
2008 0.131808 49.497299 ClusteredSustainability 2019, 11, 2110 15 of 18
z-score and 0.051 for Moran’s index, while the spatial distribution had the same status as a cluster type
(Table 5). The value of z-score increased in 2018 to 10.68, and the value of Moran’s I increased also to
0.063, while the spatial distribution type remained as the clustered type (Figure 13).
As a whole, outputs from our investigations pointed out that the use of both global and
local spatial analyses allowed us to perform multi-scale analyses of changes identified from the
multi-temporal satellite-based investigations. The use of the diverse statistical indicators/tools enabled
us (i) to better characterize the impact of changes over the investigated time window in terms of size
and distribution, and (ii) to capture clusterization and randomness of the observed urban distribution.
In particular, results from the optimized hotspot analysis tool, used for calculating the pattern
of spatial distribution, pointed out that the changes in the urban areas between 1998 and 2018 were
more random and unplanned in the case of Alexandria than in the Baia study area. The optimized
hotspot analysis tool was coupled with the cluster and outlier analysis (Anselin Local Moran’s I) to
capture clusterization and randomness of the observed urban distribution. As a whole, the optimized
hotspot analysis tool indicated whether high or low values were concentrated over the study area, and
cluster and outlier analysis indicated if they tended to be clustered. The results obtained from both the
optimized hotspot analysis (based on Getis) and outlier analysis (based on Moran) fit each other well
and coherently and clearly pointed out that changes in the urban lands between 1998 and 2018 were
more random and unplanned in the case of Alexandria than in the Baia study area. The investigations
were complemented by the application of Ripley’s function tool, herein used for estimating the urban
distribution according to the relationship between the clustered and dispersed factors. The results
obtained from Ripley’s function showed that the changes between 1998 and 2018 in the built-up lands
were clearer and more random for Alexandria than Baia, thus confirming the trend already observed
from the analysis carried out using both the optimized hotspot analysis (based on Getis) and outlier
analysis (based on Moran).
Finally, the global analysis, conducted using the spatial autocorrelation statistic, quantified the
impact of the change on the whole area; thus, from the variation over time, we obtained information
on the compactness/randomness of the urban layer as a general global indicator.
The approach herein proposed enabled us to automatically identify and characterize the impact of
changes (via the global analysis) and also to better delimit the urban sprawl boundaries (via the local
analysis) and their characteristics, generally regarded as a key indicator to control chaotic and sparse
urban expansion. In fact, the local analyses allowed us to assess, for example, if sprawl was due to
augmented urban size or decreased urban compactness, and this can allow a practical implementation
of policy and decision processes addressed to a sustainable urban development. Moreover, results from
our investigations highlighted that both local and global indices were suitable for both case studies
selected, as one was representative of diverse urban small towns, as in the case of the Italian case study,
and one was representative of big cities, as in the case of the Egyptian area. The use of both global and
local statistics enabled us to identify sprawl, applying the diverse indicators herein proposed as tools
to detect, compare, and capture the impacts of urban changes over time in an automatic way.
4. Conclusions
The main purpose of this research was to set up low-cost and reliable tools useful for monitoring urban
growth. The integration between remote sensing and GIS techniques and the joint use of analytical
statistical methods for quantitative assessment enabled the identification and characterization of
changes and the mapping of planned and unplanned urban construction in the two case studies
selected in Italy and Egypt. Our approach addresses the challenges in using heterogeneous data
from multiple data sources for change detection analysis to improve knowledge and monitoring of
landscape over time, with a specific focus on urban sprawl and land-use change around cultural
properties and archaeological areas. The change detection we performed was based on the use
of a heterogeneous optical imagery dataset, made up of satellite Landsat TM imagery and the
more recent Sentinel 2 data, freely available from the ESA web site. The approach we adoptedSustainability 2019, 11, 2110 16 of 18
consisted of (i) unsupervised classification for the identification of the prevailing classes and their
statistical distribution, (ii) supervised classification for the detection of urban areas, (iii) comparison
of the outputs from the diverse images acquired in diverse years for the extraction and mapping of
ongoing environmental changes, with particular reference to urban sprawl. The classification accuracy,
estimated for the regions of interest selected in Italy and Egypt, was higher than 98%. Outputs from
our investigations clearly highlighted that satellite data can provide very useful tools for (i) capturing
land-use changes, along with impact induced by human activities at a site level, and (ii) monitoring
environmental problems with a particular attention addressed to the urbanization and changes in land
use/land cover in close proximity with archaeological areas and cultural property/ landscape, thereby
providing reliable tools to identify changes from a global view down to a local scale.
As a whole, we can conclude that the recent availability of data from Sentinel missions opened a
new prospective in the field of satellite remote sensing for urban areas. In particular, outputs from our
investigations pointed out that significant improvements can be achieved from the increased spatial
detail of Sentinel 2 compared to Landsat, and from the joint use of Earth observation (EO)-based
geo-spatial products and geo-information. EO can provide (i) reliable analysis of current settlement
patterns and their impact, with detailed information on spatial and temporal urbanization processes,
and (ii) effective tools for supporting decision-makers and the future planning of urban expansion.
Author Contributions: The research article included two main contributions: GIS analysis and satellite data
interpretation. The GIS analysis was carried out by A.E. Satellite data interpretation was processed by R.L. Writing
of the manuscript was done through cooperation between A.E. and R.L. The last version of the article was revised
by R.L.
Funding: This research received no external funding.
Acknowledgments: This article is part of the project “Detect the environmental problems around the heritage
sites in Egypt and Italy due to the urban sprawling using the integration between GIS and Satellite data”; thus, the
authors would like to thank the National Authority for Remote Sensing and Space Sciences (NARSS) for providing
facilities for the authors. The authors would like to specially thank the Italian National Research Council (CNR) at
Tito Scalo, Potenza for supporting the research activities.
Conflicts of Interest: The authors declare no conflicts of interest. The authors would also like to declare that the
funding of the study was supported by the authors’ institutions.
References
1. Elfadaly, A.; Attia, W.; Qelichi, M.M.; Murgante, B.; Lasaponara, R. Management of Cultural Heritage Sites
Using Remote Sensing Indices and Spatial Analysis Techniques. Surv. Geophys. 2018, 39, 1347–1377.
2. Elfadaly, A.; Attia, W.; Lasaponara, R. Monitoring the Environmental Risks Around Medinet Habu
and Ramesseum Temple at West Luxor, Egypt, Using Remote Sensing and GIS Techniques. J. Archaeol.
Method Theory 2018, 25, 587–610. [CrossRef]
3. Elfadaly, A.; Wafa, O.; Abouarab, M.A.; Guida, A.; Spanu, P.G.; Lasaponara, R. Geo-Environmental Estimation
of Land Use Changes and Its Effects on Egyptian Temples at Luxor City. ISPRS Int. J. Geoinf. 2017, 6, 378.
[CrossRef]
4. Elfadaly, A.; Lasaponara, R.; Murgante, B.; Qelichi, M.M. Cultural Heritage Management Using Analysis of
Satellite Images and Advanced GIS Techniques at East Luxor, Egypt and Kangavar, Iran (A Comparison
Case Study). In Proceedings of the International Conference on Computational Science and Its Applications,
Trieste, Italy, 2–5 July 2017; Springer: Cham, Switzerland; pp. 152–168.
5. Lasaponara, R.; Murgante, B.; Elfadaly, A.; Qelichi, M.M.; Shahraki, S.Z.; Wafa, O.; Attia, W. Spatial open data
for monitoring risks and preserving archaeological areas and landscape: Case studies at Kom el Shoqafa,
Egypt and Shush, Iran. Sustainability 2017, 9, 572. [CrossRef]
6. Lasaponara, R.; Elfadaly, A.; Attia, W. Low cost space technologies for operational change detection
monitoring around the archaeological area of Esna-Egypt. In Proceedings of the International Conference on
Computational Science and Its Applications, Beijing, China, 4–7 July 2016; Springer: Cham, Switzerland;
pp. 611–621.
7. Friedman, S.Z.; Angelici, G.L. The detection of urban expansion from Landsat imagery. Remote Sens. Q. 1979,
1, 58–79.You can also read