Investigation of the Structural Dynamic Behavior of the Frontinus Gate - MDPI
←
→
Page content transcription
If your browser does not render page correctly, please read the page content below
applied
           sciences
Article
Investigation of the Structural Dynamic Behavior of
the Frontinus Gate
Özden Saygılı 1         and José V. Lemos 2, *
 1    Department of Civil Engineering, Yeditepe University, Istanbul 34755, Turkey; ozden.saygili@yeditepe.edu.tr
 2    Department of Dams, National Laboratory for Civil Engineering (LNEC), 1700-066 Lisboa, Portugal
 *    Correspondence: vlemos@lnec.pt

 Received: 28 July 2020; Accepted: 20 August 2020; Published: 22 August 2020

 Abstract: The Western Anatolia Region of Turkey is an important region of high seismic activity.
 The active dynamics of the region are shaped by a compression and expansion mechanism. This active
 mechanism is still ongoing and causes strong seismic activity in the region. The Frontinus Gate is a
 monument in the Roman city of Hierapolis of Phrygia located in southwestern Anatolia. The aim of
 this study is to investigate the seismic behavior of this stone masonry structure using discrete element
 modeling. For this purpose, nonlinear dynamic analyses were performed to simulate the structural
 response of the gate under seismic excitation. Deformation, damage, and failure patterns induced in
 the masonry gate for different levels of seismic action are evaluated and discussed. An earthquake
 with a return period of 475 years is expected to cause some damage, but no collapse, while for a
 return period of 2475 years, the models indicate collapse of the monument.

 Keywords: stone masonry; discrete element modeling; nonlinear dynamic analysis

1. Introduction
      The Hellenistic and Roman city of Hierapolis in Phrygia is one of the most important archaeological
sites known from the Roman world. Hierapolis of Phrygia is located in southwestern Anatolia about
200 km east of Izmir and the Aegean coast. The urban area stretches over a travertine shelf looking
onto the broad and fertile valley of the Çürüksu River, the ancient Lykos [1–4]. The city was probably
established by Eumenes II of Pergamum in 190 BC [1–3]. In Roman times, Hierapolis was an important
Asian city characterized by many buildings in travertine and marble; during the Early Byzantine
period the city became the metropolis of Phrygia, a very important site due to the presence of the tomb
of the Apostle St Philip [5]. The region has a high seismic activity due to a fault line running right
below the city for more than a kilometer, applying a NE-SW horizontal stretching to the area [6]. In the
first century BC, several earthquakes are known to have caused heavy damage. However, the city
was rebuilt during the reign of the Roman emperor Tiberius in AD 14–37. After a major earthquake
in the middle of the seventh century AD, the city was severely damaged, but it survived until a new
major earthquake in 1354. During the following centuries, Ottoman houses and small farms were
constructed in the ruins of the urban area [5]. Between 1653 and 1889, the region faced six devastating
earthquakes which caused serious damage [7–10].
      Under the auspices of the Flavian proconsul Sextus Iulius Frontinus, a monumental gate was built
at the northern edge of the city, in the first century AD, and the adjacent part of the main street was
extended and framed by a Doric colonnade [11]. The gate has three openings in squared travertine
blocks, with masonry arches, flanked by two round towers. Under the directorship of Paolo Verzone
from the Turin Polytechnic Institute, the Missione Archeologica Italiana (MAIER) was set up in 1957,
and restorations on the Frontinus Gate progressed [12]. Archaeological surveys have been carried
out in the urban area and in the territory surrounding the ancient city to collect information [13].

Appl. Sci. 2020, 10, 5821; doi:10.3390/app10175821                                  www.mdpi.com/journal/applsci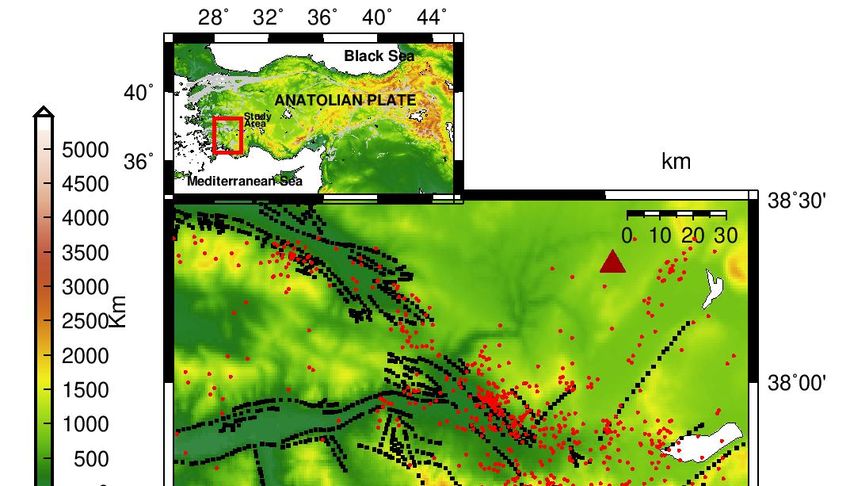
columns [20], to the more recent analyses of towers [21], obelisks [22], and stone minarets [23]. More
complex geometries are now being addressed, such as arch bridges [24], domes [25], various types of
buildings [26,27], or archaeological structures [28]. Comparisons of DEM results with the behavior
observed in shaking table tests of scaled models have provided a progressive validation of its
performance.
Appl. Sci. 2020, 10,Experiments
                     5821           with marble drum columns provided the earlier assessment of DEM                2 of 16
representations [29]. Extensive shaking table tests of single stone blocks rocking under harmonic and
seismic records have confirmed the good performance of the numerical method [30]. Comparisons
The Frontinus
with  tests of more  Gate,   which structures
                         complex    is the monumental     entrance
                                              have also been          to Hierapolis
                                                                undertaken,      namely(Figure
                                                                                          masonry1), suffered
                                                                                                     walls underdamage
                                                                                                                    out-
from   earthquakes       in the fourth  and seventh  centuries,   after which    some  reconstruction
of-plane loads [31,32], or the scaled model of a mosque [33]. DEM has been applied to many historical     interventions
were applied
structures,         [12,14].
               namely          One of thecolumns
                          the Parthenon    towers [20,29],
                                                    of the opening     is still walls
                                                            the Colosseum       in good
                                                                                      [26],condition
                                                                                             a Roman today.
                                                                                                        temple Almost
                                                                                                                 [27], an
half  of the  other    tower   collapsed  and was  damaged     from   destructive    earthquakes
obelisk [22], historical minarets [23], or the dome of Florence cathedral [25]. In the present      and   other  natural
                                                                                                             study,   the
disasters.    Since   1988,  the site has been included   in  the UNESCO       World   Heritage    List
effect of the wall curvature on the stability of the round towers is an issue to be examined. The DEM   with  emphasis
on the extraordinary
models     presented herein  natural  conditions,
                                 are intended not the
                                                   onlyGreco-Roman       thermal under
                                                         for safety assessment      installations,  and the
                                                                                            large seismic     Christian
                                                                                                            actions, but
monuments        [15];  thus  the Frontinus  Gate and   other  monuments       at the site  have
also as a means to quantify the damage to the structure that can be expected from lower intensity,great  importance     in
providing
more   likelythe    present generation a connection to its past.
                events.

                                               The Frontinus
                                     Figure 1. The Frontinus Gate
                                                             Gate in Hierapolis.

       The aim of this study is to investigate the dynamic characteristics of the Frontinus Gate and
simulate the seismic behavior of the structure under the seismic excitations that can be expected at the
site, in order to predict the potential damage levels. The tool employed is the discrete element method
(DEM), a numerical technique increasingly applied to the analysis of masonry, in particular of historical
heritage structures [16]. The analysis of masonry structures may be performed either by equivalent
continuum models or by discrete block models [17]. The former, based on the material homogenization
approach, are typically preferred for large complex structures, while the discrete (or discontinuum)
methods, where DEM is included, were initially applied to components or simple structures, but are
presently capable of addressing more complex systems [18]. DEM represents the structure as a system
of discrete blocks, thus closely reproducing the physical nature of masonry. It is capable of simulating
the nonlinear phenomena of slip and separation along the joints, which are typically observed in
masonry structures under seismic loads, allowing the analysis to proceed into the large displacement
range to follow the processes of damage and progressive collapse [19]. DEM models have been
frequently applied to tall, slender structures, from the early work on the Parthenon columns [20], to the
more recent analyses of towers [21], obelisks [22], and stone minarets [23]. More complex geometries
are now being addressed, such as arch bridges [24], domes [25], various types of buildings [26,27],
or archaeological structures [28]. Comparisons of DEM results with the behavior observed in shaking
table tests of scaled models have provided a progressive validation of its performance. Experiments
with marble drum columns provided the earlier assessment of DEM representations [29]. Extensive
shaking table tests of single stone blocks rocking under harmonic and seismic records have confirmed
the good performance of the numerical method [30]. Comparisons with tests of more complex
structures have also been undertaken, namely masonry walls under out-of-plane loads [31,32], or the
scaled model of a mosque [33]. DEM has been applied to many historical structures, namely the
Parthenon columns [20,29], the Colosseum walls [26], a Roman temple [27], an obelisk [22], historical
minarets [23], or the dome of Florence cathedral [25]. In the present study, the effect of the wall
curvature on the stability of the round towers is an issue to be examined. The DEM models presented
herein are intended not only for safety assessment under large seismic actions, but also as a means to
quantify the damage to the structure that can be expected from lower intensity, more likely events.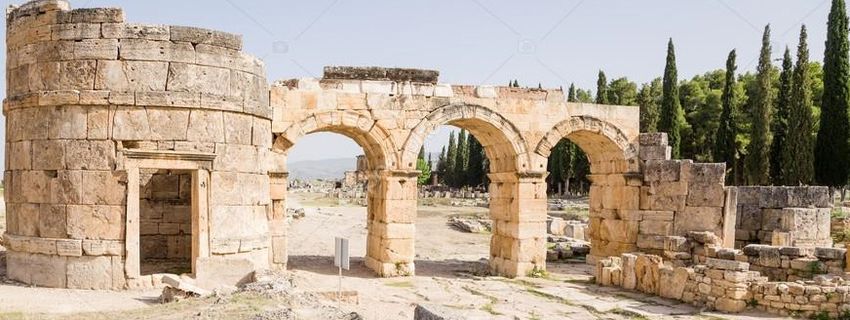
Appl. Sci. 2020, 10, x FOR PEER REVIEW 3 of 16
Appl. Sci. 2020, 10, 5821 3 of 16
2. Seismicity of the Region
2. Seismicity
The present of the Region
tectonic structure of Turkey has been formed by active interactions developed by
the continental
The present collision
tectonicofstructure
the Arabian plate with
of Turkey the Eurasian
has been formed by plate in the
active east, and subduction
interactions developed by of
the African plate beneath the Aegean [34,35]. These tectonic motions caused the
the continental collision of the Arabian plate with the Eurasian plate in the east, and subduction of development of two
significant
the Africanactive faults, the
plate beneath theNorth
Aegean Anatolian Fault (NAF)
[34,35]. These tectonicand the East
motions Anatolian
caused Fault (EAF),
the development of and
two
the westward
significant activeextrusion
faults, theofNorth
the Anatolian plate.(NAF)
Anatolian Fault Anotherand result
the EastofAnatolian
the motion Faultis(EAF),
the ongoing
and the
lithospheric scale extension
westward extrusion caused byplate.
of the Anatolian trenchAnother
roll-back in the
result of Hellenic
the motion subduction zone [36,37].
is the ongoing As a
lithospheric
consequence
scale extension of caused
the active tectonic
by trench motions,
roll-back strong
in the extensional
Hellenic deformation
subduction zone [36,37].developed in western
As a consequence
Anatolia.
of the active tectonic motions, strong extensional deformation developed in western Anatolia.
Before
Before instrumental
instrumental recording
recording (1900),
(1900), only
only earthquakes
earthquakes having
having magnitudes
magnitudes greater
greater than
than 4.5
4.5 were
were
reported.
reported. One of the reported destructive earthquakes occurred in Hierapolis and Phrygia in 494BC.
One of the reported destructive earthquakes occurred in Hierapolis and Phrygia in 494 BC.
Then, anotherdevastating
Then, another devastatingearthquake
earthquake occurred
occurred in Laodicea
in Laodicea andand Hierapolis
Hierapolis in 60 inBC.60Both
BC.events
Both events
caused
caused heavy damage
heavy damage in the Throughout
in the regions. regions. Throughout history,
history, similar similar destructive
destructive earthquakesearthquakes
have occurred have in
occurred
this regioninand
thissurrounding
region and areas.
surrounding
Importantareas. Important
historical historical
earthquakes withearthquakes
magnitudeswith magnitudes
between Mw 6.2
between
and Mw Mw 6.2 and affected
6.6 heavily Mw 6.6 Laodicea
heavily affected Laodicea and
and Hierapolis. In 26Hierapolis. In 26 BCwith
BC an earthquake an earthquake
a magnitude withof
aMwmagnitude of Mw 6.2 completely destroyed the ancient city. In 17 BC
6.2 completely destroyed the ancient city. In 17 BC an earthquake with a magnitude of Mw 6.6 an earthquake with a
magnitude of Mw 6.6 resulted in damages in 12 ancient cities,
resulted in damages in 12 ancient cities, causing surface ruptures and landslides. causing surface ruptures and
landslides.
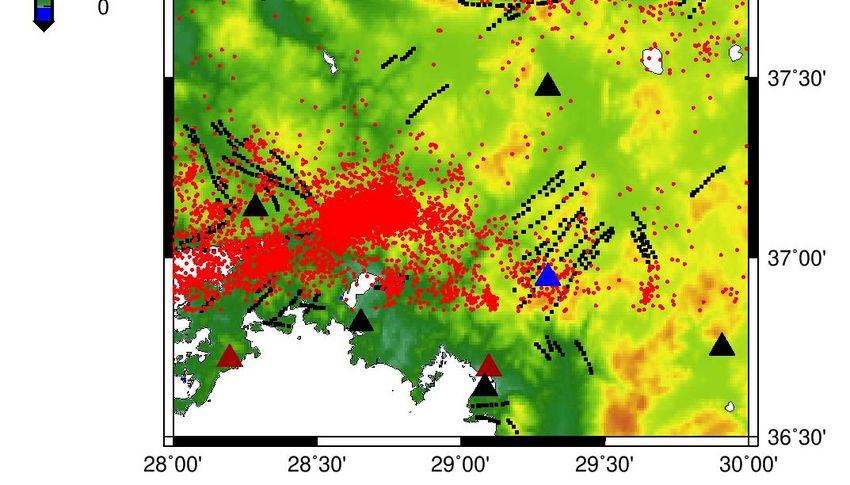
Focusing on Denizli’s geologic and tectonic structure (Figure 2), the N-S extension system in
Focusing
Western Turkey onandDenizli’s geologic
the Africa and tectonicunder
plate subducting structure (Figure 2),
the Anatolian the strongly
plate N-S extension
affect thesystem
Denizliin
Western Turkey and the Africa plate subducting under the Anatolian plate strongly
region and surrounding areas. The most active grabens in the province are the NW-SE extending Gediz affect the Denizli
region
grabenandand surrounding
the E-W extending areas. Menderes
The most graben
active grabens
(Figure 2).in the
The province
Denizli basinare the NW-SEclose
is situated extending
to the
Gediz graben
confluence of and
thesethetwoE-W extending Menderes graben (Figure 2). The Denizli basin is situated close
grabens.
to the confluence of these two grabens.
Figure
Figure 2.
2.AAsimplified
simplifiedtectonic,
tectonic,seismic
seismicactivity,
activity,and
andseismic
seismicstation
stationmap
mapof
ofDenizli
Denizliand
andsurroundings.
surroundings.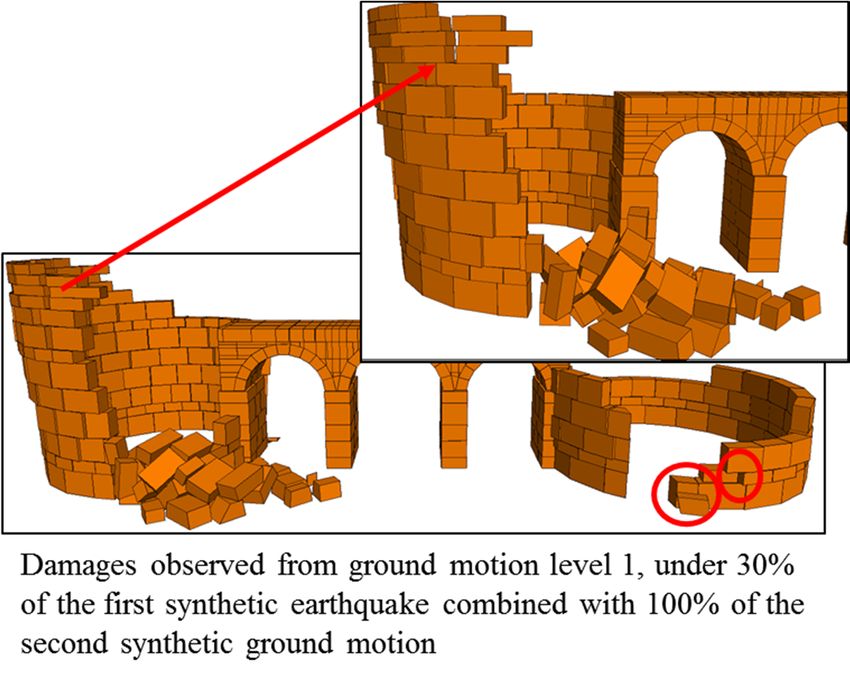
Appl. Sci. 2020, 10, 5821
Appl. x FOR PEER REVIEW 4 of 16
Appl. Sci. 2020, 10, x FOR PEER REVIEW 4 of 16
As seen in Figure 3, the magnitude range of most of the earthquakes in this region is from 2 to
4. This Asindicates
As seenin
seen inFigure
Figure 3,3,the
that active the magnitude
magnitude
crustal rangeof
range
movements ofmost
and most ofofthe
numerous theearthquakes
earthquakes
outflow inin
thermal this
this region
region
waters is from 2 to
is responsible
are from 2 to 4.
4.
This This indicates
indicates thatthat active
active crustal
crustal movements
movements and and numerous
numerous outflow
outflow thermal
thermal waters
waters
for high micro-seismic activity. Denizli is one of the most seismic regions in Turkey. Figure 4 shows are are responsible
responsible for
for number
high
the high micro-seismic
micro-seismic
of earthquakesactivity.
activity. with Denizli
Denizli is one
is one
depth of most
of the
distribution thefor
most seismic
seismic
Denizli. regions
regions in Turkey.
in Turkey.
As mentioned, Figure
Figure
Denizli was 4 shows
4 shows the
destroyed
the
number numberof of earthquakes
earthquakes with with depth
depth distribution
distribution for for Denizli.
Denizli. As As mentioned,
mentioned, Denizli
Denizli
by an earthquake with a magnitude of 4.7 on 19 August 1976. Although it was a moderate earthquake, was was destroyed
destroyed by
by
an an earthquake
earthquake withwith
a a magnitude
magnitude of of
4.74.7
on on
1919 August
August 1976.
1976. Although
Although
it resulted in the collapse of 40 houses and heavy damage to 1284 houses [38]. itit was
was aa moderate
moderate earthquake,
earthquake,
ititresulted
resultedin inthe
thecollapse
collapseof of40
40houses
housesandandheavy
heavydamage
damageto to1284
1284houses
houses[38].
[38].
Figure 3. Distribution of earthquakes with their magnitudes from 2000 to 20 December 2018.
Figure 3. Distribution of earthquakes with their magnitudes from 2000 to 20 December 2018.
Figure 3. Distribution of earthquakes with their magnitudes from 2000 to 20 December 2018.
Figure
Figure 4. Number of
4. Number of earthquakes
earthquakes with
with depth
depth distribution
distribution for
for Denizli
Denizli from
from 2000
2000 to
to 20
20 December
December 2018.
2018.
Figure 4. Number of earthquakes with depth distribution for Denizli from 2000 to 20 December 2018.
3. Numerical Model
3. Numerical Model
3. Numerical
The FrontinusModel Gate has three openings in squared travertine blocks, with masonry arches, flanked
The Frontinus Gate has three openings in squared travertine blocks, with masonry arches,
by two round towers.
ThebyFrontinus Some
Gate of three
has the blocks aboveinthe
openings arches travertine
squared collapsed and/or
blocks,were withdamaged.
masonry One of
arches,
flanked two round towers. Some of the blocks above the arches collapsed and/or were damaged.
the round
flanked towers
by two of
round the opening
towers. Someis still in good
of theisblocks condition today, standing at a maximum height of
One of the round towers of the opening still inabove
goodthe arches collapsed
condition and/or were
today, standing damaged.
at a maximum
8.17 m. The
One ofofthe external and internal diameter of this tower are 10.20 m and 9.09 m, respectively. Almost
height 8.17round
m. The towers
externalof and
the opening is still inofgood
internal diameter condition
this tower today,
are 10.20 standing
m and 9.09 m,at respectively.
a maximum
half of the
height of other
8.17 tower has collapsed. This damaged tower is 3.18 m at its highest point, with 8.25 m
Almost half ofm.
theThe external
other towerandhasinternal
collapsed.diameter of this tower
This damaged tower are
is10.20
3.18 m m at
andits9.09 m, respectively.
highest point, with
and 7.11
Almost m external
half7.11
of the and internal
other tower diameters, respectively. Two of the three masonry segmental arched
8.25 m and m external and has collapsed.
internal This respectively.
diameters, damaged tower Two is of
3.18themthree
at itsmasonry
highest point, with
segmental
doorways
8.25 m andhave
7.11 almost
m the same
external and dimensions.
internal The intrados
diameters, are circular
respectively. Two but
of theless than
three a semicircle
masonry with
segmental
arched doorways have almost the same dimensions. The intrados are circular but less than a
arched doorways have almost the same dimensions. The intrados are circular but less than a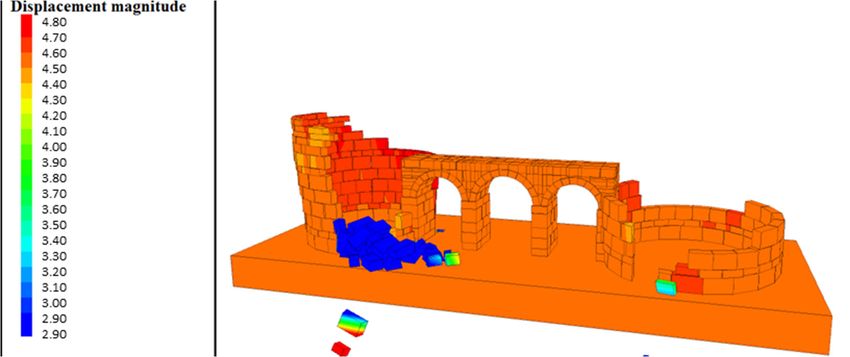
Appl. Sci. 2020, 10, 5821                                                                            5 of 16

4.58 m above ground level [1,2,4,5]. In the literature, there are several archeological, experimental
and numerical studies investigating the material characteristics of the stone masonry structures in
Hierapolis [8,9,39–42]. Most of these studies emphasize the material properties of travertine stone block
masonry and ashlar (regular) masonry based on destructive and nondestructive testing procedures.
The Frontinus Gate has traces of damage to the stones at round towers and arches from earthquakes or
from other natural disasters.
     The average mechanical properties of the Frontinus Gate were determined using information
inferred from previous studies mentioned above and considered obvious damage. In this study,
elasticity and shear modulus were assumed as 2800 MPa and 860 MPa, respectively. The numerical
model was created with the discrete element method code 3DEC [43], widely used in masonry
models [20–33]. 3DEC represents the discontinuous medium as an assemblage of discrete blocks,
with the discontinuities treated as interfaces between the blocks. 3DEC allows large displacements and
rotations of blocks, thus being able to simulate structural collapse. In this study, rigid blocks have been
employed, as often done in the analysis of structures made of strong stone units, for which deformation
and failure modes are governed by sliding or separation along discontinuities [19].
     The solution is based on the integration of the equations of motion of the blocks, using an explicit
time-stepping algorithm. The 3 translational equations of motion of a rigid block center of mass may
be expressed as:
                                              ..         .
                                           m ui + α m ui = fi                                            (1)

where ui denotes the displacement vector of the block center; m, the block mass; and α,
the mass-proportional viscous damping parameter, which reproduces the energy losses in the system
beyond frictional dissipation. The force vector fi is the sum of the applied forces, including self-weight,
and the contact forces, which are a function of the relative block displacements, and therefore includes
the elastic forces. The 3 rotational degrees of freedom are governed by Euler’s equations, expressed in
the principal axes of inertia of the block as:
                                   .
                                I1 ω1 + α I1 ω1 + (I3 − I2 ) ω3 ω2 = m1
                                    .
                                 I2 ω2 + α I2 ω2 + (I1 − I3 ) ω1 ω3 = m2                                (2)
                                    .
                                 I3 ω3 + α I3 ω3 + (I2 − I1 ) ω2 ω1 = m3

where ωi denotes the rotational velocity vector; Ii , the principal mass moments of inertia. The moment
mi is the sum of moments produced by the contact forces and the applied forces.
     The 3DEC model is shown in Figure 5a. The geometry was based on drawings of the structure.
Some simplifications were adopted, for example the smaller blocks around the tower openings were
not considered. In order to reproduce the correct structural deformability, the joint stiffnesses are based
on the dimensions of the blocks adjacent to the joint. The normal joint stiffness is given by kn = E/d,
where E is the Young’s modulus and d the average of the dimensions normal to the joint of the 2 blocks
in contact; the shear stiffness is given by ks = G/d, where G is the shear modulus. These formulas
were applied to assign the stiffness to each group of joints (e.g., bed joints and vertical joints of each
layer of the towers, joints of the pillars, and arched gates). A Coulomb friction law was adopted as
the joint constitutive model, assuming a friction angle of 30◦ , zero cohesion, and zero tensile strength.
This friction angle is a conservative estimate, in the lower range of the available data. The material
properties are summarized in Table 1.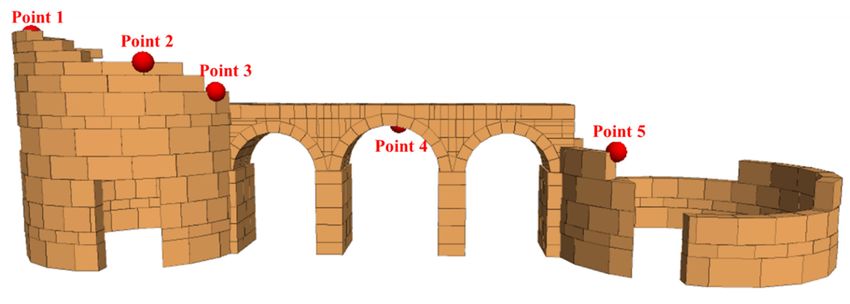
In 3DEC, static solutions under gravity loading are first obtained by a relaxation solution
algorithm. Then, the dynamic analysis is performed by prescribing the seismic input motion at the
base block. The time step required for stability of the explicit algorithm was in the order of 10-5 s,
which allows an accurate representation of the block motion and contact updates. Histories of
Appl.velocity, displacement,
Sci. 2020, 10, 5821 and normal and shear stresses were recorded at the locations shown in Figure
6 of 16
5b, where larger movements are to be expected.
(a)
(b)
Figure
Figure 5. (a)
5. (a) Numerical
Numerical model
model of of FrontinusGate
Frontinus GateininHierapolis;
Hierapolis;(b)
(b) history
history locations.
locations.
4. Nonlinear Dynamic Analysis Table 1. Material properties.
Seismic behavior of the Frontinus Unit Gate
weightwas simulated 24 through
kN/m3non-linear dynamic analyses. The
objective is to discuss the dynamic Young’sglobal response of the2800
modulus masonry
MPa gate to an earthquake ground
motion which is consistent with Shear
themodulus
earthquake hazard 860 MPa in accordance with the Turkish
levels,
Joint friction angle 0
Building Seismic Code 2019. The first seismic input was given30 by a recorded earthquake, the velocity
Joint cohesion 0
records of the event that occurred in Dinar (Mw 6.0) on Oct 10, 1995 downloaded from ground PEER
Joint tensile strength 0
NGA strong motion database. In addition to the real ground motion, four synthetic acceleration time
series were generated. First, for the coordinates of the Frontinus Gate, target response spectrums were
In 3DEC, static
established solutions
for two groundunder gravity
motion loading
levels. Theare first
first obtained by
earthquake a relaxation
ground motion solution algorithm.
level has a 2%
Then, the dynamic
probability to beanalysis
exceeded is performed
in 50 years,by prescribing
with a return the seismic
period input
of 2475 motion
years (levelat1).theThe
base block.
second
earthquake ground motion level has a 10% probability to be exceeded in 50 years,
The time step required for stability of the explicit algorithm was in the order of 10 s, which allows an -5
with a return period
of 475representation
accurate years (level 2). of
Forthe
each target
block response
motion and spectrum, two acceleration
contact updates. Historiestime series were
of velocity, generated
displacement,
and based
normal on and
inter shear
plate regimes
stressesand linear
were site effect.
recorded at the locations shown in Figure 5b, where larger
movements Selected
are toand
be created
expected. earthquakes were best fit with the adopted target spectrums. Comparison
of the response spectrum of the Dinar earthquake (Mw 6.0) on Oct 10, 1995, with the target spectrum
for groundDynamic
4. Nonlinear motion level 2, is shown in Figure 6. Comparisons of the response spectrum of synthetic
Analysis
loadings with corresponding target spectrums are plotted in Figure 7.
Seismic behavior of the Frontinus Gate was simulated through non-linear dynamic analyses.
These real and synthetic ground motions were applied as base excitation to the numerical model.
The objective is to discuss the dynamic global response of the masonry gate to an earthquake ground
It is assumed that the structure is subjected to earthquakes in both horizontal directions. Due to the
motion
fact which is seismic
that the consistent withinthe
effects twoearthquake
orthogonalhazard levels,
directions arein accordance
unlikely withtheir
to reach the maximum
Turkish Building
value
Seismic
at theCode
same2019.
time,The
thefirst seismic orthogonal
30 percent input was given
loading byrule
a recorded earthquake,
is applied. Since thethe
twovelocity records
time series wereof
the event that occurred in Dinar (Mw 6.0) on Oct 10, 1995 downloaded from ground
generated for each ground motion level, 100% of the synthetic earthquake is combined with 30% of PEER NGA strong
motion
the database. In addition
other synthetic groundtomotion
the realinground motion, four
the orthogonal synthetic
direction. For acceleration
ground motion timelevel
series
1, were
two
generated. First, for the coordinates of the Frontinus Gate, target response spectrums were established
for two ground motion levels. The first earthquake ground motion level has a 2% probability to be
exceeded in 50 years, with a return period of 2475 years (level 1). The second earthquake ground
motion level has a 10% probability to be exceeded in 50 years, with a return period of 475 years (level 2).
For each target response spectrum, two acceleration time series were generated based on inter plate
regimes and linear site effect.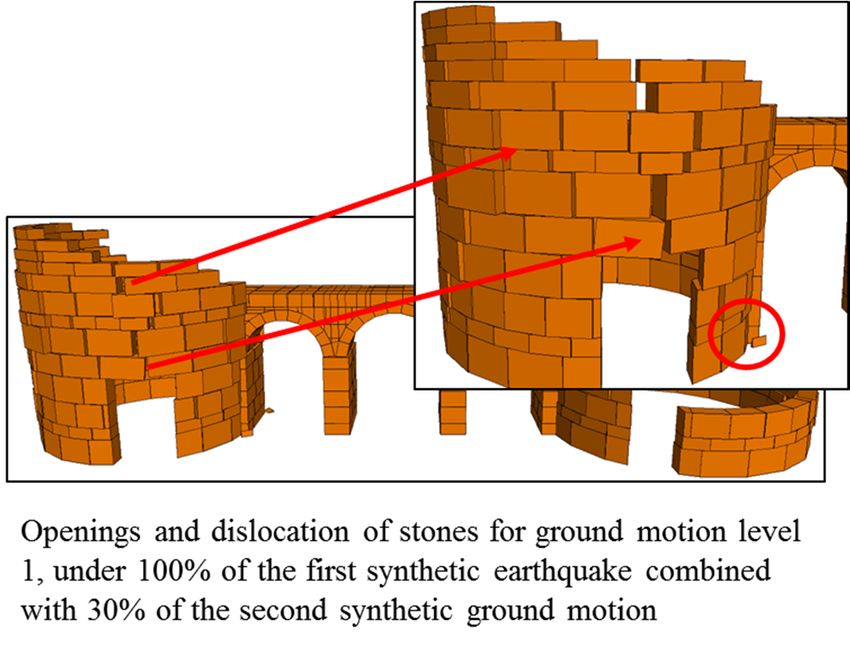
Appl. Sci. 2020, 10, x FOR PEER REVIEW 7 of 16
Appl. Sci. 2020, 10, 5821 7 of 16
Appl. Sci. 2020, 10, x FOR PEER REVIEW 7 of 16
dynamic analyses were performed, as for 100% of the first synthetic earthquake combined with 30%
of dynamic
theSelected
second synthetic
analyses
and ground
were
created motion,
performed,
earthquakes as and
for
were 30%
100%
best of
fitof thethe
the
with first
first synthetic
synthetic
adopted earthquake
earthquake
target combined
combined
spectrums. with
with
Comparison 30%
of
100%
the of the
of response
the secondsecond synthetic
synthetic
spectrum of groundground
the Dinar motion.
motion, The
and 30%
earthquake same
(Mwof6.0) procedure
theon first was
Octsynthetic applied for
10, 1995,earthquake the dynamic
combined
with the target with
spectrum
analysis
100%
for groundof
of the
the second
second
motion ground
synthetic
level motion
2, is shown inlevel.
ground motion.
Figure The same procedure
6. Comparisons was applied
of the response spectrumfor of
the dynamic
synthetic
analysiswith
loadings of the second ground
corresponding motion
target level. are plotted in Figure 7.
spectrums
Figure 6. Comparison of target response spectrum created for ground motion level 2 and response
Comparison
Figure 6. of
spectrum of target response spectrum created for ground motion level 2 and response
Figure 6. Dinar, Turkey
Comparison of1995 earthquake.
target response spectrum created for ground motion level 2 and response
spectrum of Dinar, Turkey 1995 earthquake.
spectrum of Dinar, Turkey 1995 earthquake.
(a)
(a)
(b)
Figure (b) ground motion level 1 with corresponding
Figure7.7.(a)
(a)Comparison
Comparisonofoftarget
targetresponse
responsespectrum
spectrumfor
for ground motion level 1 with corresponding
synthetic
Figure earthquake;
synthetic 7.earthquake;(b)
(b)Comparison
(a) Comparison Comparison ofoftarget
target
of target response response
response
spectrum spectrum
forspectrumfor
forground
levelmotion
ground
ground motion 1 with level
motion level22with
with
corresponding
corresponding
corresponding synthetic earthquake.
synthetic (b)
synthetic earthquake; earthquake.
Comparison of target response spectrum for ground motion level 2 with
corresponding synthetic earthquake.
Identifying the synthetic
These real and dynamic ground
characteristics
motions of theapplied
were masonry structures
as base under
excitation thenumerical
to the assumption of
model.
elastic behavior
It is assumed is
that an
the important
structure first
is step
subjected in the
to study, as
earthquakes it provides
in both a good
horizontal understanding
directions.
Identifying the dynamic characteristics of the masonry structures under the assumption of Due of
tothe
the
dynamic
fact
elastic response
that behavior
the seismicisunder
effects low
in two
an important intensity
first stepground
orthogonal shaking,
indirections
the study, are ituntil
as unlikely nonlinear
to reach
provides phenomena
their
a good maximum become
understanding value
of the
dominant. The first ten natural frequencies and eigenmodes of vibration
dynamic response under low intensity ground shaking, until nonlinear phenomena become were calculated for the rigid
dominant. The first ten natural frequencies and eigenmodes of vibration were calculated for the rigid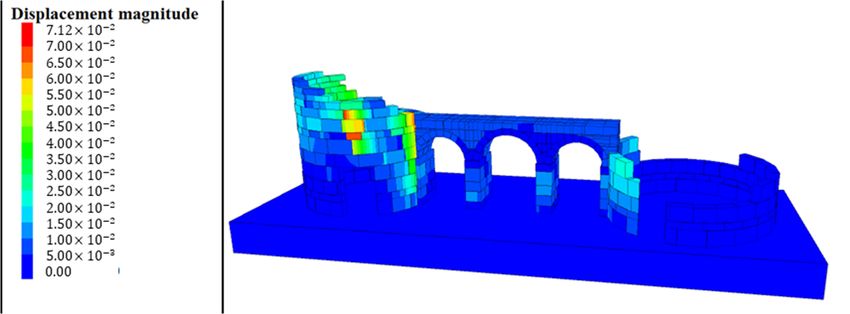
Appl. Sci. 2020, 10, 5821 8 of 16
at the same time, the 30 percent orthogonal loading rule is applied. Since the two time series were
generated for each ground motion level, 100% of the synthetic earthquake is combined with 30% of the
other synthetic ground motion in the orthogonal direction. For ground motion level 1, two dynamic
analyses were performed, as for 100% of the first synthetic earthquake combined with 30% of the
second synthetic ground
Appl. Sci. 2020, 10, x FORmotion, and 30% of the first synthetic earthquake combined with 100%8 ofof16the
PEER REVIEW
second synthetic ground motion. The same procedure was applied for the dynamic analysis of the
block
second Appl.
ground model.
Sci. 10,The
motion
2020, kinematic
level.
x FOR variables of the system of rigid blocks are the six degrees of freedom
PEER REVIEW 8 of of
16
each block as three translations and three rotations. The global stiffness
Identifying the dynamic characteristics of the masonry structures under the assumption of matrix for the rigid block
systemmodel.
block
elastic behavior is assembled,
is an based on
Theimportant
kinematic thestep
first system
variables ofinthe deformability
system
the study, of as governed
rigid by a
blocks are
it provides the
the joint stiffnesses.
six degrees
good The mass
of freedom
understanding ofofthe
matrix
each is obtained
block as threefrom block masses
translations and and
threerotational
rotations.inertia terms [36].
The global Vibration
stiffness matrixmode shapes
for the rigidasblock
well
dynamic response under low intensity ground shaking, until nonlinear phenomena become dominant.
as their iscorresponding
system assembled, based frequencies were determined.
on the system deformability Frequencies
governed for fivejoint
by the dynamic eigenmodes
stiffnesses. The massare
The first ten natural frequencies and eigenmodes of vibration were calculated for the rigid block model.
given inisTable
matrix obtained 2. The
fromshapes
blockofmasses
modesand 1, 3,rotational
and 5 areinertia
plotted in Figures
terms 8 to 10. mode shapes as well
[36]. Vibration
The kinematic variables of the
as their corresponding system were
frequencies of rigid blocks are
determined. the six degrees
Frequencies for five of freedom
dynamic of each block
eigenmodes are
as threegiven
translations and three
in Table 2. The shapes Tablerotations. The
2. Frequencies
of modes global
1, 3, and for stiffness
5 dynamic
5 are matrix
plotted eigenmodes. for the
in Figures 8 to 10. rigid block system is
assembled, based on the system deformability governed by the joint stiffnesses. The mass matrix is
Mode Frequency (Hz)
obtained from block masses and Table 2. Frequencies
rotational inertia
1
for 5 dynamic
terms eigenmodes.mode shapes as well as their
[36]. Vibration
11.60
corresponding frequencies were determined. Mode2 Frequencies 12.00for
Frequency five dynamic eigenmodes are given in
(Hz)
Table 2. The shapes of modes 1, 3, and 5 are 13plotted in 11.60 Figures
18.32 8–10.
24 19.98
12.00
Table 2. Frequencies
35 for 5 dynamic
22.64 eigenmodes.
18.32
4 19.98
Mode Frequency (Hz)
The first period is approximately 0.09 5 seconds,22.64
corresponding to a bending mode shape on the
horizontal plane. Mode 3 involves1 shear and torsional 11.60
movements, and mode 5 mostly the larger
tower.
TheIt first
can period
be seenis from
approximately2
the displacement
0.09 seconds, 12.00 contourstofor
magnitude
corresponding mode 3mode
a bending and mode 5 that
shape on the
displacements
horizontal increase
plane. Modealong
3 involves 3 shearofand
the height the round 18.32
tower.
torsional movements, and mode 5 mostly the larger
4
tower. It can be seen from the displacement 19.98 contours for mode 3 and mode 5 that
magnitude
5 22.64
displacements increase along the height of the round tower.
Figure8.8.First
Figure Eigenmode.
First Eigenmode.
Figure 8. First Eigenmode.
Figure9.9. Eigenmode
Figure .
Eigenmode 33.
Figure 9. Eigenmode 3.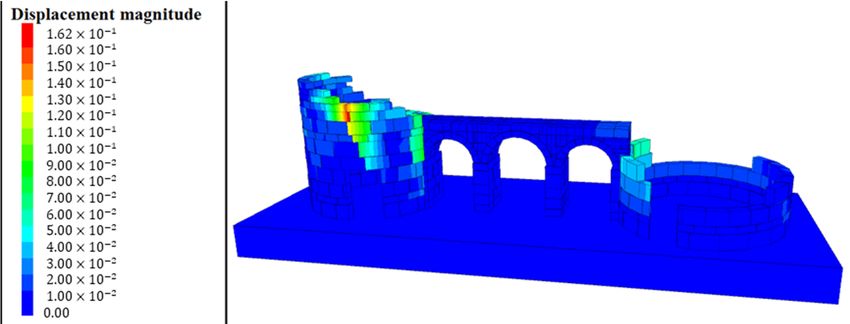
Appl. Sci. 2020, 10, 5821 9 of 16
Appl. Sci. 2020, 10, x FOR PEER REVIEW 9 of 16
Figure 10. Eigenmode 5.
Figure 10. Eigenmode 5.
The first period is approximately 0.09 seconds, corresponding to a bending mode shape on the
In the analysis of the response under seismic action, the nonlinear properties of the joints were
horizontal plane. Mode 3 involves shear and torsional movements, and mode 5 mostly the larger tower.
applied. First, static analysis was carried out under self-weight. Then, nonlinear dynamic analyses
It can bewereseenperformed
from theunder
displacement magnitude
seismic loading. contours
For the for mode
Dinar, Turkey 19953earthquake
and modewith 5 that displacements
a duration of 29
increases along the height of the round tower.
and increments of 0.005 s, the masonry gate model experienced the seismic excitations in horizontal
In and
the analysis of the response
vertical directions under seismic
simultaneously. action,response
The structural the nonlinear properties
of the numerical of the
model joints were
subjected to
applied.theFirst,
Dinar earthquake
static analysisin terms of contour
was carried outdiagram of the final displacement
under self-weight. magnitude
Then, nonlinear is presented
dynamic analyses
in Figure 11.
were performed As isseismic
under seen in loading.
this figure,For thethe
displacements increase
Dinar, Turkey 1995along the height
earthquake of the
with round tower
a duration of 29 s
and the maximum displacement of 7.1 cm is obtained, particularly in areas
and increments of 0.005 s, the masonry gate model experienced the seismic excitations in horizontal where the normal stresses
are low. The connection of the round tower with the arched gate is also a critical location.
and vertical directions simultaneously. The structural response of the numerical model subjected to
In the following runs, for each ground motion level the numerical model subjected to synthetic
the Dinar earthquake in terms of contour diagram of the final displacement magnitude is presented in
earthquakes
Appl. Sci. 2020, 10,seen
in two horizontal
x FORinPEER
directions with a duration of 11 s. A total of four dynamic analyses
Figure 11.
were Asperformed
is this REVIEW
under figure,
synthetictheloading
displacements increase
combination. alongtothe
According theheight
results of the round
obtained fromtower
ground
10 of 16
and
the maximum
motion displacement
level 1, under of 30% 7.1ofcmtheis first
obtained, particularly
synthetic earthquakeincombined
areas where the normal stresses are
sliding on horizontal bed joints, which are associated with shear behavior.with It is100% of the
seen that thesecond
observed
low. The connection
synthetic groundof the round
motion, thetower
highest with
roundthe tower
arched gate is also
collapsed, a critical
while location.
the three masonry gate arches
openings have a pattern which would cause typical diagonal cracking.
were able to sustain such a large action (PGA about 1g). Representative responses of this analysis in
terms of the contour diagram of final displacement magnitude are depicted in Figure 12. For the
second combination as 100% of the first synthetic earthquake combined with 30% of the second
synthetic ground motion, some small blocks fell and the highest round tower was very close to
collapse, a result consistent with the previous run. For ground motion level 2, a lower level of seismic
input, under the first case as 100% of the first synthetic earthquake combined with 30% of the second
synthetic ground motion, the maximum displacement was 0.16 m (Figure 13), whereas under the
second combination the tower experienced maximum displacement of 0.13 m. Again, the top of the
higher tower showed more displacements, but no collapse was observed for this lower seismic level.
In addition to the displacements, the normal and shear stresses observed from dynamic analyses were
evaluated. Considering the stresses, a much better seismic response was observed under the Dinar
earthquake than for the synthetic seismic excitations. Figure 14 shows some damage patterns as
openings and dislocation of stones under the Dinar, Turkey 1995 earthquake and the synthetic
earthquakes. The results predicted by the model for the Dinar earthquake are compatible with the
available data which indicate that no major damage was detected in the structure after this seismic
Figure
event. It canFigure 11.Displacement
11.
be concluded magnitude
that when
Displacement under
the numerical
magnitude Dinar,
Dinar,Turkey
undermodel isTurkey 1995
subjected earthquake.
1995toearthquake .
real or synthetic seismic
excitations, the main damage was observed in the higher elevations of the round towers, around the
In door
the following
openings, runs,
and also forextending
each ground
to themotion level the
arch intrados. numerical
These model
results show subjected
that to synthetic
the expected forms
earthquakes in two horizontal
of structural damage to directions with
this gate due to aseismic
duration of 11 s. A
excitations aretotal of four
sliding, dynamicand
dislocation analyses
falling were
of
performedstones mostly
under along the
synthetic towers
loading when the horizontal
combination. Accordinginertial
to theforces
resultsexceeded
obtained certain
from limits.
groundUnder
motion
both combination
level 1, under 30% of theof synthetic
first earthquake
synthetic for ground
earthquake motion
combined withlevel 1, the
100% of highest
the secondtensile stresses ground
synthetic were
observed along the round tower, which would have resulted in a flexural failure
motion, the highest round tower collapsed, while the three masonry gate arches were able to sustain mechanism. As
shown in representative figures (Figure 14), openings and dislocation of stones took place due to the
such a large action (PGA about 1g). Representative responses of this analysis in terms of the contour
diagram of final displacement magnitude are depicted in Figure 12. For the second combination as 100%
of the first synthetic earthquake combined with 30% of the second synthetic ground motion, some small
blocks fell and the highest round tower was very close to collapse, a result consistent with the previous
run. For ground motion level 2, a lower level of seismic input, under the first case as 100% of the
Figure 12. Displacement magnitude for ground motion level 1, under 30% of the first synthetic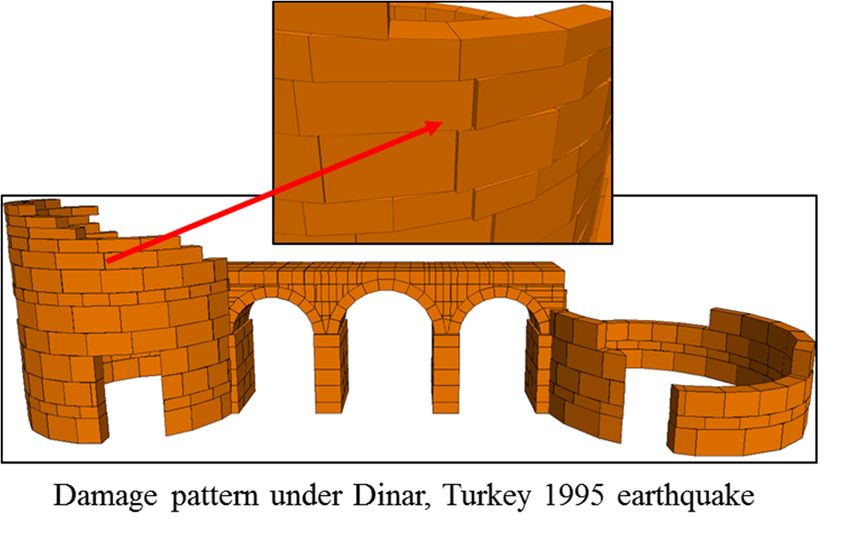
Appl. Sci. 2020, 10, 5821                                                                                             10 of 16

first synthetic earthquake combined with 30% of the second synthetic ground motion, the maximum
displacement
 Appl. Sci. 2020, 10,was
                      x FOR 0.16 m (Figure
                              PEER  REVIEW 13), whereas under the second combination the tower experienced           10 of 16
maximum         displacement       of  0.13
    Appl. Sci. 2020, 10, x FOR PEER REVIEW
                                             m. Again,  the top  of the  higher  tower  showed     more   displacements,
                                                                                                                 10 of 16
but   no collapse
 sliding              was observed
           on horizontal                 for which
                               bed joints,   this lower seismic level.
                                                    are associated  withInshear
                                                                           addition  to the It
                                                                                 behavior.  displacements,
                                                                                               is seen that thethe normal
                                                                                                                 observed
and   shear
 openings
    sliding on stresses
               have        observed
                       a pattern
                  horizontal           from
                                   which
                                 bed          dynamic
                                     joints,would      analyses
                                             which cause         were   evaluated.
                                                          typical diagonal
                                                    are associated  with shear      Considering
                                                                              cracking.             the  stresses, a much
                                                                                behavior. It is seen that the observed
better    seismic
    openings     have response
                         a patternwas    observed
                                     which           undertypical
                                             would cause    the Dinar    earthquake
                                                                  diagonal   cracking.than for the synthetic seismic
excitations. Figure 14 shows some damage patterns as openings and dislocation of stones under the
Dinar, Turkey 1995 earthquake and the synthetic earthquakes. The results predicted by the model for
the Dinar earthquake are compatible with the available data which indicate that no major damage
was detected in the structure after this seismic event. It can be concluded that when the numerical
model is subjected to real or synthetic seismic excitations, the main damage was observed in the higher
elevations of the round towers, around the door openings, and also extending to the arch intrados.
These results show that the expected forms of structural damage to this gate due to seismic excitations
are sliding, dislocation and falling of stones mostly along the towers when the horizontal inertial forces
exceeded certain limits. Under both combination of synthetic earthquake for ground motion level 1,
the highest tensile stresses were observed along the round tower, which would have resulted in a
flexural failure mechanism. As shown in representative figures (Figure 14), openings and dislocation of
stones took place due to the sliding on horizontal bed joints, which are associated with shear behavior.
It is seen that theFigure observed
                           Figure11.  openings
                                  11.Displacement
                                      Displacementhave a pattern
                                                    magnitude
                                                    magnitude     which
                                                               under
                                                               under      would
                                                                      Dinar,
                                                                      Dinar,      cause
                                                                              Turkey
                                                                             Turkey      typical
                                                                                      1995
                                                                                    1995   earthquake
                                                                                         earthquake  . .
                                                                                                   diagonal  cracking.

          Figure 12. Displacement magnitude for ground motion level 1, under 30% of the first synthetic
        Figure12.12.Displacement
      Figure         Displacement magnitude
                                  magnitude for
                                              for ground
                                                  ground motion level 1, under
                                                                         under 30%
                                                                               30% of
                                                                                    of the
                                                                                        the first
                                                                                             firstsynthetic
                                                                                                   synthetic
          earthquake combined with 100% of the second synthetic ground motion.
        earthquake combined with 100% of the second synthetic ground motion.
      earthquake    combined with 100% of the second  synthetic ground motion.

          Figure
      Figure  13. 13. Displacement
                  Displacement      magnitude
                                 magnitude  forfor ground
                                                ground     motion
                                                        motion     level
                                                                 level 2,2,under
                                                                            underthe
                                                                                   thefirst
                                                                                        firstcase
                                                                                              caseasas100%
                                                                                                        100%of
                                                                                                             ofthe
                                                                                                                thefirst
          first
      synthetic synthetic earthquake
                 earthquake          combined
                              combined         with
                                        with 30%    30%  of the second  synthetic ground      motion  .
        Figure 13.  Displacement   magnitude  for of the second
                                                   ground   motionsynthetic
                                                                    level 2, ground
                                                                             under themotion.
                                                                                          first case as 100% of the
        first synthetic earthquake combined with 30% of the second synthetic ground motion.
Appl. Sci. 2020, 10, 5821 11 of 16
Appl. Sci. 2020, 10, x FOR PEER REVIEW 11 of 16
Figure14.
Figure Damagepatterns
14.Damage patternsunder
underthe
theDinar,
Dinar,Turkey
Turkey1995
1995earthquake
earthquakeand
andsynthetic
syntheticearthquakes.
earthquakes.
Under real and synthetic earthquakes, time histories of displacements relative to the base of the
model were evaluated at five points, shown in Figure 15. It is obvious from these that under the Dinar
earthquake and the synthetic motions, the round towers and the gate show quite different movements,
with the arched gate displaying lower values. The maximum values of displacements relative to theAppl. Sci. 2020, 10, 5821 12 of 16
model base during dynamic analyses for real and synthetic earthquakes for the five points shown
in Figure 15 are given in Table 3. We can see that point 4, located at the masonry arch, experienced
relatively lower displacements under real and synthetic loadings. Although point 1 is at the highest
point, in some runs, the maximum displacement occurred at point 3 (near the gate-tower junction)
under the real earthquake and three of four synthetic loadings, showing that this area is subject to
intense motion.
Appl. Sci. 2020, 10, x FOR PEER REVIEW 12 of 16
Figure15.15.
Figure Time
Time histories
histories of displacements
of displacements relative
relative to thetobase
the under
base under the Turkey
the Dinar, Dinar, 1995
Turkey 1995
earthquake
earthquake
and and the
the synthetic synthetic earthquakes.
earthquakes.
Under real and synthetic earthquakes, time histories of displacements relative to the base of the
model were evaluated at five points, shown in Figure 15. It is obvious from these that under the Dinar
earthquake and the synthetic motions, the round towers and the gate show quite different
movements, with the arched gate displaying lower values. The maximum values of displacements
relative to the model base during dynamic analyses for real and synthetic earthquakes for the five
points shown in Figure 15 are given in Table 3. We can see that point 4, located at the masonry arch,
experienced relatively lower displacements under real and synthetic loadings. Although point 1 is atAppl. Sci. 2020, 10, 5821 13 of 16
Table 3. Maximum displacement relative to base.
Maximum Relative Displacement (m)
Point 1 0.0416
Point 2 0.0826
Dinar,
Point 3 0.1024
Turkey 1995 Earthquake
Point 4 0.0226
Point 5 0.0440
Point 1 0.3472
Ground motion level 1
Point 2 0.7614
Case 1:
Point 3 0.9380
100% of the first synthetic earthquake combined with
Point 4 0.2090
30% of the second synthetic earthquake
Point 5 0.2853
Point 1 0.6616
Ground motion level 1
Point 2 collapsed
Case 2:
Point 3 collapsed
30% of the first synthetic earthquake combined with
Point 4 0.1890
100% of the second synthetic earthquake
Point 5 0.6338
Point 1 0.0621
Ground motion level 2
Point 2 0.1444
Case 1:
Point 3 0.1298
100% of the first synthetic earthquake combined with
Point 4 0.0440
30% of the second synthetic earthquake
Point 5 0.0709
Point 1 0.0906
Ground motion level 2
Point 2 0.1841
Case 2:
Point 3 0.1981
30% of the first synthetic earthquake combined with
Point 4 0.0488
100% of the second synthetic earthquake
Point 5 0.0438
5. Discussion
The Frontinus Gate in Hierapolis in Denizli, Turkey has a very long history. This monumental
masonry gate is composed of three openings in squared travertine blocks, with masonry arches, flanked
by two round towers. It is difficult to investigate the structural health of existing masonry monuments
using seismic code requirements that are prepared for new masonry constructions. The work carried
out was aimed at getting a better insight on the seismic response of the Frontinus Gate. To accomplish
this objective, a discrete element model was created using the present geometry of the structure.
Dynamic nonlinear analyses were performed under real earthquakes and synthetic ground motions.
Interpretation of the numerical model results lead to the following conclusions:
1. Modal analysis, assuming elastic behavior, is a very useful first step to obtain insight into the
dynamic characteristics of the structure.
2. The nonlinear dynamic analyses indicate that the Frontinus Gate, in the current state, under an
earthquake with a magnitude of 6, would be expected to suffer moderate damage. Under the
synthetic earthquake with a return period of 475 years, the observed structural response and
damage patterns are serious although it does not mean the collapse of the monument.
3. In the case of occurrence of an earthquake with a return period of 2475 years, the models show
that the monument would not be able to withstand it, resulting in a large number of blocks
collapsing completely.
4. Considering the seismic sensitivity of the Frontinus Gate, the results obtained are consistent with
the present state of the structure, with the round towers having more seismic damage potential
than the masonry arches.Appl. Sci. 2020, 10, 5821 14 of 16
5. Although the Frontinus Gate is still standing at the site, showing an outstanding endurance,
under seismic excitation with a magnitude of 6 or greater, a high vulnerability of large portions of
the structure can be expected.
Author Contributions: Conceptualization, Ö.S.; methodology, Ö.S., J.V.L.; investigation, Ö.S.; writing—original
draft preparation, Ö.S.; writing—review and editing, J.V.L.; visualization, Ö.S. All authors have read and agreed
to the published version of the manuscript.
Funding: This research received no external funding.
Acknowledgments: We would like to gratefully acknowledge the Denizli Provincial Directorate of Culture and
Tourism for providing valuable information for the Frontinus Gate.
Conflicts of Interest: The authors declare no conflict of interest.
References
1. D’Andria, F. Francesco Hierapolis/Pamukkale Arkeoloji Rehberi; Ege Yayınları: İstanbul, Turkey, 2003.
2. D’Andria, F.; Scardozzi, G.; Sparò, A. Atlante di Hierapolis di Frigia. Hierapolis di Frigia II; Ege Yayınları:
İstanbul, Turkey, 2008.
3. D’Andria, F.; Gümgüm, G. Archaeology and architecture in the martyrion of hierapolis. In Metropolis
Ionia II-the Land of the Crossroads: Essays in Honour of Recep Meriç; Homer Kitabevi: Istanbul, Turkey, 2010;
pp. 95–104.
4. Giacomo, G.; Ditaranto, I.; Scardozzi, G. Cartography of the archaeological surveys taken from an Ikonos
stereo-pair: A case study of the territory of Hierapolis in Phrygia (Turkey). J. Archaeol. Sci. 2011, 38,
2051–2060. [CrossRef]
5. Leucci, G.; Di Giacomo, G.; Ditaranto, I.; Miccoli, I.; Scardozzi, G. Integrated ground-penetrating radar and
archeological surveys in the ancient city of Hierapolis of Phrygia (Turkey). Archaeol. Prospect. 2013, 20,
285–301. [CrossRef]
6. Hancock, P.L.; Altunel, E. Faulted archaeological relics at Hierapolis (Pamukkale), Turkey. J. Geodyn. 1997,
24, 21–36. [CrossRef]
7. Ambraseys, N.N.; Finkel, C.F. The Seismicity of Turkey and Adjacent Areas: A Historical Review 1500–1800;
Eren Yayincilik ve Kitapcilik Ltd.: Istanbul, Turkey, 1995; p. 240.
8. D’Andria, F.; Silvestrelli, F. (Eds.) Ricerche Archeologiche Turche Nella Valle Del Lykos; Congedo Editore: Rome,
Italy, 2000; pp. 315–331.
9. Demirtaş, R.; Erkmen, C.; Yaman, M.; Eravcı, B.; Aktan, T.; Tepeuğur, E.; Özdemir, F. Denizli ve Civarında
Deprem Üreten Diri Faylar ve Pamukkale Fayının Paleosismisitesi, Rapor; DAD: Ankara, Turkey, 2003.
10. Kaplan, H.; Yilmaz, S.; Akyol, E.; Sen, G.; Dayanir, N. Preliminary Seismic Risk Assessment Based on
Statistical Data. In Proceedings of the Asia Conference on Earthquake Engineering Theme: Seismic Hazards
and Damage Mitigation in the Asian Region, Taipei, Taiwan, 15–19 September 2019.
11. D’Andria, F. Hierapolis of Phrygia: Its evolution in Hellenistic and Roman times. In Urbanism in Western
Asia Minor: New studies on Aphrodisias, Ephesos, Hierapolis, Pergamon, Perge and Xanthos; Journal of Roman
Archaeology: Rome, Italy, 2001; pp. 97–115, ISBN 10-1887829458.
12. Mighetto, P. La Storia Come Scavo della Realtà Architettonica. Paolo Verzone (1902–1986): Un Percorso di Ricerca;
Politecnico di Torino: Turin, Italy, 1999.
13. Scardozzi, G. Remote sensing and archaeological survey in the Hierapolis of Phrygia territory, Turkey Remote
Sensing for Environmental Monitoring, GIS Applications and Geology. In Proceedings of the Conference
6749 Remote Sensing and Archaeology, SPIE Europe Remote Sensing, Florence, Italy, 17–20 September 2007;
pp. 1–12.
14. Valluzzi, M.R.; Marson, C.; Taffarel, S.; Salvalaggio, M.; Deiana, R.; Boaga, J. Structural investigation and
modelling of seismic behavior on ruins in the monumental area of hierapolis of Phrygia. In Structural Analysis
of Historical Constructions: An Interdisciplinary Approach; RILEM Bookseries; Springer: Cham, Germany, 2019;
Volume 18, pp. 1849–1857.
15. International Council on Monuments and Sites. Advisory Body Evaluation; World Heritage List Nomination
485; International Council on Monuments and Sites: Hierapolis-Pamukkale, Turkey, 1988.Appl. Sci. 2020, 10, 5821 15 of 16
16. Roca, P.; Cervera, M.; Gariup, G.; Pela, L. Structural Analysis of Masonry Historical Constructions. Classical
and Advanced Approaches. Arch. Comput. Methods Eng. 2010, 17, 299–325. [CrossRef]
17. Lourenço, P.B. Computations of historical masonry constructions. Prog. Struct. Eng. Mater. 2002, 4, 301–319.
[CrossRef]
18. D’Altri, A.M.; Sarhosis, V.; Milani, G.; Rots, J.; Cattari, S.; Lagomarsino, S.; Sacco, E.; Tralli, A.; Castellazzi, G.;
De Miranda, S. Modeling Strategies for the Computational Analysis of Unreinforced Masonry Structures:
Review and Classification. Arch. Comput. Methods Eng. 2019. [CrossRef]
19. Lemos, J.V. Discrete Element Modeling of the Seismic Behavior of Masonry Construction. Buildings 2019, 9,
43. [CrossRef]
20. Psycharis, I.N.; Lemos, J.V.; Papastamatiou, D.Y.; Zambas, C.; Papantonopoulos, C. Numerical study of
the seismic behaviour of a part of the Parthenon Pronaos. Earthq. Eng. Struct. Dyn. 2003, 32, 2063–2084.
[CrossRef]
21. Sarhosis, V.; Milani, G.; Formisano, A.; Fabbrocino, F. Evaluation of different approaches for the estimation of
the seismic vulnerability of masonry towers. Bull. Earthq. Eng. 2017, 16, 1511–1545. [CrossRef]
22. Saygılı, Ö. Estimation of structural dynamic characteristics of the Egyptian obelisk of Theodosius.
Earthq. Struct. 2019, 16, 311–320.
23. Çaktı, E.; Saygılı, Ö.; Lemos, J.V.; Oliveira, C.S. Nonlinear dynamic response of stone masonry minarets
under harmonic excitation. Bull. Earthq. Eng. 2020, 18, 4813–4838. [CrossRef]
24. Forgács, T.; Sarhosis, V.; Bagi, K. Minimum thickness of semi-circular skewed masonry arches. Eng. Struct.
2017, 140, 317–336. [CrossRef]
25. Paris, V.; Pizzigoni, A.; Adriaenssens, S. Statics of self-balancing masonry domes constructed with a
crossherringbone spiraling pattern. Eng. Struct. 2020, 215, 110440. [CrossRef]
26. Mordanova, A.; De Felice, G. Seismic assessment of archaeological heritage using discrete element method.
Int. J. Arch. Heritage 2018, 14, 345–357. [CrossRef]
27. Erdogmus, E.; Pulatsu, B.; Gaggioli, A.; Hoff, M. Reverse engineering a fully collapsed ancient roman temple
through geoarchaeology and DEM. Int. J. Arch. Heritage 2020. [CrossRef]
28. Schweppe, G.; Hinzen, K.-G.; Marco, S.; Reamer, S.K.; Fischer, M. The ruin of the Roman temple of Kedesh,
Israel; Example of a precariously balanced archaeological structure used as a seismoscope. Ann. Geophys.
2017, 60. [CrossRef]
29. Papantonopoulos, C.; Psycharis, I.N.; Papastamatiou, D.Y.; Lemos, J.V.; Mouzakis, H. Numerical prediction
of the earthquake response of classical columns using the distinct element method. Earthq. Eng. Struct. Dyn.
2002, 31, 1699–1717. [CrossRef]
30. Peña, F.; Prieto, F.; Lourenço, P.B.; Costa, A.C.; Lemos, J.V. On the dynamics of rocking motion of single
rigid-block structures. Earthq. Eng. Struct. Dyn. 2007, 36, 2383–2399. [CrossRef]
31. Lemos, J.V.; Costa, A.C. Simulation of shake table tests on out-of-plane masonry buildings. Part (V): Discrete
element approach. Int. J. Arch. Heritage 2016, 11, 117–124. [CrossRef]
32. Bui, T.T.; Limam, A.; Sarhosis, V.; Hjiaj, M. Discrete element modelling of the in-plane and out-of-plane
behavior of dry-joint masonry wall constructions. Eng. Struct. 2017, 136, 277–294. [CrossRef]
33. Çaktı, E.; Saygılı, Ö.; Lemos, J.V.; Oliveira, C.S. Discrete element modeling of a scaled masonry structure and
its validation. Eng. Struct. 2016, 126, 224–236. [CrossRef]
34. McKenzie, D. Active tectonics of the Mediterranean Region. Geophys. J. R. Astron. Soc. 1972, 30, 109–185.
[CrossRef]
35. Göncüoğlu, M.C. Introduction to the Geology of Turkey: Geodynamic Evolution of the Pre-alpine and Alpine
Terranes. MTA 2010, 5, 1–69.
36. Taymaz, T.; Yücel, Y.; Yildirim, D. The Geodynamics of the Aegean and Anatolia. Geol. Soc. Lond. Spec. Publ.
2007, 291, 1–16. [CrossRef]
37. Confal, J.; Tuna, E.; Frederik, T.; Seda, Y.C.; Yeşim, Ç.; Erdinc, S.; Taymaz, T. Investigation of mantle kinematics
beneath the hellenic-subduction zone with teleseismic direct shear waves. Phys. Earth Planet Inter. 2016, 261,
141–151. [CrossRef]
38. Ates, R.C.; Bayülke, N. The 19 August 1976 Denizli, Turkey, earthquake: Evaluation of the strong motion
accelerograph record. Bull. Seismol. Soc. Am. 1982, 72, 1635–1649.
39. Çobanoğlu, İ.; Çelik, S.B. Determination of strength parameters and quality assessment of Denizli travertines
(SW Turkey). Eng. Geol. 2012, 129, 38–47. [CrossRef]Appl. Sci. 2020, 10, 5821 16 of 16
40. Çelik, S.B.; Çobanoğlu, İ.; Atatanır, L. General material properties of Denizli (SW Turkey) travertines as a
building stone. Bull. Eng. Geol. Environ. 2014, 73, 825–838. [CrossRef]
41. Invernizzi, S.; Alferi, C. Combined laser surveying and finite element modeling for the structural assessment of
masonry structures at the Hierapolis outer bath complex. In Proceedings of the SAHC2014—9th International
Conference on Structural Analysis of Historical Constructions, Mexico City, Mexico, 14–17 October 2014.
42. Scardozzi, G. Phrygia Hierapolisi Yeni Atlasi VII. Kentin ve Nekropolislerin Arkeoloji Haritasi; Ege Yayınları:
İstanbul, Turkey, 2015.
43. Itasca Consulting Group. 3DEC-Three-Dimensional Distinct Element Code; Itasca International: Minneapolis,
MN, USA, 1988.
© 2020 by the authors. Licensee MDPI, Basel, Switzerland. This article is an open access
article distributed under the terms and conditions of the Creative Commons Attribution
(CC BY) license (http://creativecommons.org/licenses/by/4.0/).You can also read


