Hybrid Design Tools-Image Quality Assessment of a Digitally Augmented Blackboard Integrated System - arXiv
←
→
Page content transcription
If your browser does not render page correctly, please read the page content below
Article

Hybrid Design Tools—Image Quality Assessment of a
Digitally Augmented Blackboard Integrated System
Ovidiu Banias 1,* and Camil Octavian Milincu 2
 1 Automation and Applied Informatics Department, Faculty of Automation and Computer Science,
   Politehnica University of Timisoara, 300223 Timisoara, Romania; ovidiu.banias@aut.upt.ro
 2 Architecture Department, Faculty of Architecture and Urban Planning, Politehnica University of

   Timisoara, 300223 Timisoara, Romania; milincucamil@yahoo.com
 * Correspondence: ovidiu.banias@aut.upt.ro; Tel.: +40-732-673-387

 Received: 1 November 2018; Accepted: 19 January 2019; Published: 21 January 2019

 Abstract: In the last two decades, Interactive White Boards (IWBs) have been widely available as a
 pedagogic tool. The usability of these boards for teaching disciplines where complex drawings are
 needed, we consider debatable in multiple regards. In a previous study, we proposed an alternative
 to the IWBs as a blackboard augmented with a minimum of necessary digital elements. The current
 study continues our previous research on hybrid design tools, analyzing the limitations of the
 developed hybrid system regarding the perceived quality of the images being repeatedly captured,
 annotated, and reprojected onto the board. We validated the hybrid system by evaluating the
 quality of the projected and reprojected images over a blackboard, using both objective
 measurements and subjective human perception in extensive and realistic case studies. Based on
 the results achieved in the current research, we conclude that the proposed hybrid system provides
 good quality support for teaching disciplines that require complex drawings and board interaction.

 Keywords: design tools; hybrid systems; interactive whiteboard; digital; blackboard; teaching

1. Introduction
     Interactive White Board (IWB) systems are trendy nowadays, being perceived as the logical
evolutionary step after switching from blackboards to whiteboards. They have the possibility to
interact within certain limits with the presented content, allowing the creation of annotations, as well
as the capture and subsequent sharing of the material. Several studies [1–8] have been conducted on
the use of IWB focusing mainly on the usage in the primary education. Although the results are
promising in some areas, the disadvantages of the system must be highlighted, both in terms of
physical components and interactiveness.
     IWBs are complex systems that require high costs both in acquisition and in maintenance. IWBs
in comparison with analogue systems are slow and non-intuitive [9]. With current options, it is not
possible to make an interactive presentation containing complex drawings without considerable
effort, at a slow pace and constantly accessing some menus. For lectures, especially when there is no
alternative to an analog writing surface, it is necessary to prepare the material prior to the
presentation. The interactive component is thus restricted and limited. Although the systems use
simple software components, a process of adaptation and rehearsal is required from the teacher,
requiring an in-depth knowledge of the technology, especially if it is desired to allow students to
interact with the board during the presentations [10]. Based on our experience, the interactive
capacity of the IWB is sometimes overlooked, the whiteboard surface being used for projection
purposes only because, in order to prevent the premature wear of the surface, the usage of dry-erase
markers is often avoided. Therefore, a traditional blackboard is used as complementary tool [11].

Informatics 2019, 6, 6; doi:10.3390/informatics6010006                     www.mdpi.com/journal/informatics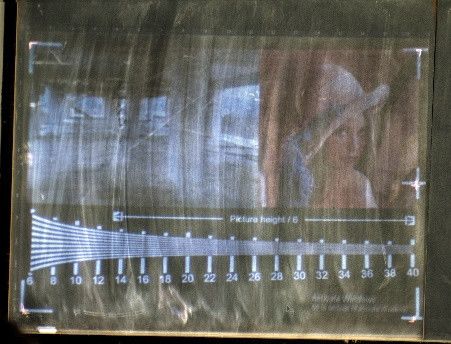
Informatics 2019, 6, 6                                                                             2 of 17

     Another disadvantage of IWBs would be the limitations regarding the drawing line quality in
terms of expressiveness [11]. Current capabilities of representation could be acceptable in some areas
of teaching but are insufficient in the technical disciplines as design and architecture, where the
expressiveness and ambiguity of sketches are desirable features.
     As an alternative to the current IWBs, in a previous study we proposed a hybrid system
consisting of a blackboard as an analogical medium augmented with a minimum of necessary digital
elements [12]. The system is relevant and convenient for technical disciplines where complex
drawings are needed. The major challenge the proposed hybrid system is facing, excluding the
software and hardware challenges is the offering of a projected image of a good quality, good enough
to be able to support the teaching process as a better alternative to current IWBs.
     The current study continues our previous research on hybrid design tools analyzing the
limitations of the developed hybrid system regarding the perceived quality of the images being
repeatedly captured, annotated, and reprojected onto the board. We validate the hybrid system by
evaluating the quality of the projected, annotated, and reprojected images over a blackboard.
     The paper is structured as follows. In the next section we present the advantages and
disadvantages of using whiteboards and blackboards in the context of teaching technical disciplines
that require complex drawings and board interaction during the presentation. We continue with
presenting the assessment methodologies we used to evaluate our previously developed hybrid
system. The hardware setup is also briefly described. We continue further with four case studies
developed in one of the classrooms of the Politehnica University of Timisoara, Faculty of Architecture
and Urban Planning, Architecture Department, using a blackboard as a projecting surface. In the last
section we discuss the results and we draw the conclusions.

2. Context and Related Work
      IWBs are currently fashionable tools [13]. However, there are discussions about how they are
being used, and more important, about the possibility to become a common element in the teaching
process. For making it happen, the system should have a significant analogical component [14]. As
an alternative to IWBs, in a previous study [12], a proof-of-concept system was developed to digitally
augment a presentation surface. The decision to use a minimum of digital elements in combination
with a blackboard surface was taken based on several considerations presented below.
      Whiteboards are used with dry-erase markers, mitigating the chalk dust issues. The erasing is
easier, various markers are available, but they are considered unreliable: they get dry, used and worn
easily. Also, the remaining quantity of ink in the marker is difficult to estimate, so teachers often need
to have around many markers. To express or emphasis an idea by drawing, lines are being drawn by
two techniques: modulation of the thickness and variation of the intensity [15]. Concerning the
expressiveness of the drawn lines, significant differences can be observed between the whiteboards
and the blackboards, the blackboards performing much better.
      A downside of the whiteboard is the glossy finishing of the working surface. The glossiness of
the surface combined with the direction of lighting causes lots of distracting reflections, a
phenomenon observed regardless of the position in the workroom. In the case of using a blackboard,
because of its rough surface needed for chalk writing, the disturbing reflections are avoided.
Although the marker generated lines have a higher contrast than the chalk, the marker line thickness
is significant thinner. In the case of dry-erase markers, the contrast decreases as the ink reserve is
depleted, creating the effect of a dry line which has a reduced density. To overcome this shortcoming
and compensate the lack of density through a larger thickness of the line, the user must press harder
on the marker and deform the tip. In the case of using chalk, the density of the line remains constant.
      Although the whiteboard offers a good projection support for static presentations containing
text and diagrams that do not require interaction, there are significant disadvantages regarding
interaction and expressiveness: practicability of line generation, line and hatch density, elements of
multisensory perception [16]. In the case of utilizing a blackboard, chalk is used to draw on
sandblasted glass. The advantage of using a blackboard is the easiness of controlling the thickness
and density of the line by using the same writing instrument and without using any other means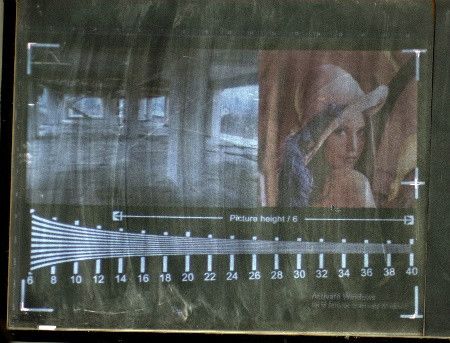
Informatics 2019, 6, 6                                                                            3 of 17

except the exerted pressure. Also, different line thicknesses or hatches with various intensities on vast
surfaces can be accomplished by using the edge of the chalk over a blackboard.
     Drawing precision is also better when using a chalk over a blackboard than using a marker over
a whiteboard. The same precision issue occurs when drawing on paper with a ballpoint pen [17].
Usually straight lines with different orientation are being drawn, and seldom it is necessary to draw
more than three intersecting lines. The quality of the drawing and of the writing decreases due to the
sliding of the marker tip on the whiteboard sleek surface. By comparing the same person’s drawings,
a better control can be noticed in the case of using the blackboard because chalk has a higher
coefficient of friction [11]. The differences are noticeable mostly in the starting point of the line and
where increased pressure is being applied.
     Regarding multisensory perception, the tactile and audible feedback [16] has the same
importance as gesture and can bring new elements into the presentation. In the case of using
whiteboards these perceptions are almost unnoticeable, but tactile and auditive elements become
significantly more important when using a blackboard. There is a strong correlation between the
pressure and the speed of drawing given by the chalk, just like an important auditive component [11].
Tests using whiteboard markers show that an expressive, accentuated drawing with great pressure
and speed can create a reversed phenomenon [11]. The capillary system of the marker is not able to
provide enough ink flow and the result is different to the one expected because the lines which are
needed to be thickened have a reduced density.
     In a previous study [18] we analyzed the process of teaching design discipline and some
shortcomings were noticed due to the students' prejudices and inefficient use of the resources at their
disposal. The students were given the task of designing a piece of furniture and had full freedom in
the choice of the modeling and representation techniques: manual drawing, digital drawing,
computer-aided design, 3D modeling, layout and photography, as well as any hybrid technology.
Contrary to the expectations, no original or advanced use of digital means by the students was
observed. Employing exclusively digital means of modeling and representation produced results that
lacked formal complexity compared to those designed and drafted in analogical environments.
     From the perspective of design process, a discipline that requires complex drawings and
interaction, hybrid techniques reduce the “ideation gap” in respect to employing exclusively digital
or analogical means. Hybrid techniques also increase the processing speed or what Thomas Dorta
names “design flow” [9]. The development of coherent ideas is supported by the opportunities of a
quick working method, any exclusive use of a method, whether it is digital or analog, having no
positive effects [19–21] during design process. Boards are suitable tools for design alternatives unlike
software systems which use predefined elements, being more capable to adapt to certain situations.
Using boards in presentations at the expense of digital items can shift the student's preferred way of
using exclusively digital design tools and predefined functions. In addition, the ambiguous nature of
hand-drawn sketches favors variation and diversity, personal discussions and interpretations.

3. Methodology and Hardware Setup
     In the previous researches we presented hybrid design tools and developed a hybrid system [12]
as a proof of concept to be able to validate our proposed solutions. In this paper, we continue further
the research by validating the proposed solution through evaluation of the quality of the projected
and reprojected images over a blackboard, using both objective measurements and subjective human
opinion. As reprojected images are subject to distortion and blurriness for objective measurements
we employed the Structural Similarity Index (SSIM) to be able to evaluate the difference between two
consecutive projected and reprojected images.
     The challenges the proposed hybrid system is facing are on one hand the offering of a projected
image of a good quality to be able to support the teaching process and on the other hand becoming
an alternative to the current IWBs. The repeated process of capture and projection in the context
presented above could diminish drastically the quality of the image with respect to skewing,
blurriness, and luminosity. We evaluated the quality of the projected/reprojected images objectively
by calculating the Structural Similarity Index (SSIM) for two or more consecutive projected images
Informatics 2019, 6, 6 4 of 17
and subjectively by asking opinion of both human experts as design teachers, and unexperienced
humans as design students that are supposed to benefit from the interactive teaching. We have chosen
as an image quality metric the Structural Similarity Index (SSIM) due to better results in comparing two
images [22,23] than Mean Square Error (MSE) and Peak Signal to Noise Ratio (PSNR) metrics.
3.1. Hybrid Projection System Overview
The proposed hybrid system presented in [12] is composed of five hardware components:
laptop, projector, camera, Arduino microcontroller, smart phone, and three software applications for
PC, smart phone, and microcontroller. The hybrid system depicted in Figure 1 is meant for
supporting the teaching process by repeating the following three steps:
• projecting course slides/images over a surface,
• capturing (electronically saving) the image of the surface containing previously projected
slide/image and human interaction as drawings in chalk over a blackboard,
• reprojection of the saved images on demand.
Figure 1. Proof of concept hybrid system setup.
Minimum System requirements:
• PC,
• Camera—high resolution web camera or photo camera,
• Projector—good color light output (brightness) minimum 2000 lumens,
• Smart phone (optional) —running Android operating system,
• Arduino Uno & Bluetooth module (optional).
3.2. Hardware Setup
In order to evaluate the hybrid system presented in the previous section we used the following
hardware components:
Laptop: Lenovo B590,
Projector: Benq MX511,
Camera & Lens: Canon EOS 60D & Canon Zoom Lens EF 100–400 mm, 1:4.5–5.6 L;
and had the following setup:
Distance from projector to the board: 280 cm,
Distance from camera lens to the board: 750 cm,
Captured image dimension: 130 × 95 cm,
Distance between image markers: 126 × 85 cm,
Ambient/board illuminance level: 205 lux,
Projector/board illuminance level: 820 lux,
Height of projected Lena’s image [24]: 96 cm.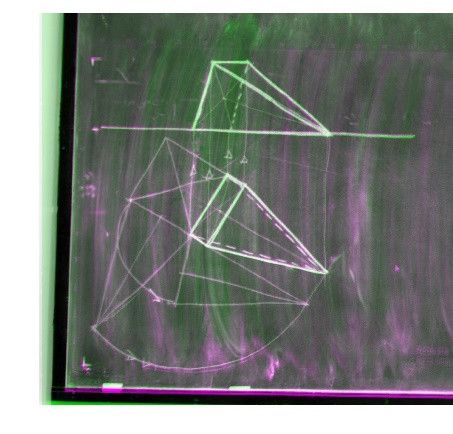
Informatics 2019, 6, 6 5 of 17
The quality of the captured and projected images is affected by projector, camera, and lens
quality. Quality in general could be assessed objectively and subjectively. In the context of current
research, we refer to image quality from the perspective of: sharpness, luminance, and contrast for
the hybrid system to be able to support the teaching process up to an acceptable visual human
opinion. Visual contrast is defined as a perceptual image attribute because the assessment of the
contrast of images is influenced by previous experiences and subjective factors [25,26]. The perceived
contrast cannot be determined correctly by analyzing only some points in the image, thus global
analysis is required. This is influenced by several factors, such as the subjective preset interest areas.
The projector used for the current research could be classified as low quality, producing only 2700
lumens white light output and only 700 lumens color light output, where color light output represents
the color brightness as a standard in measuring the projector’s ability to reproduce a color. The
quality of the projected images could be improved further as needed by using a better projector with
higher color light output values. Otherwise, the camera and lens used in current research offer a good
quality. We conjecture that the high quality of the projector is more important in the current research
context than the high quality of the camera and lens, because the luminosity is the most important
observed criterion that affects the human perception.
4. Case Studies
The case studies were developed in one of the classrooms of the Politehnica University of
Timisoara, Faculty of Architecture and Urban Planning, Architecture Department, having the
hardware setup described above and using a blackboard as projecting surface. Each of the case
studies were initiated by projecting a support image as a presentation slide for supporting further
interactions in white and colored chalk over the blackboard. Images of the blackboard surface were
captured and reprojected as needed in order to simulate the interactive teaching process where the
teacher is required to return to previous drawings for further clarifications.
For objective measurements we used ssim and imshowpair Matblab functions:
“ssimval = ssim(A,ref) computes the Structural Similarity Index (SSIM) value for image A
using ref as the reference image”,
“imshowpair(A,B,’falsecolor’) creates a composite RGB image showing A and B overlaid in
different color bands. Gray regions in the composite image show where the two images have
the same intensities. Magenta and green regions show where the intensities are different”.
For subjective measurements we questioned 29 students and 5 design teachers within the
Department of Architecture. Both students and teachers were presented projected and reprojected
images using the proposed hybrid system and they were asked to assess the perceived image quality
on a 1 to 5 scale, where 5 is the highest perceived quality and 1 is the lowest perceived quality. The
scope of the assessment was to observe how the perceived image quality drops with repeating the
capturing and reprojection process. We questioned both students and teachers in order to observe if
there is a significant bias due to the different relation with technology of the two groups. In the
following subsections, four case studies will be presented to assess the quality of the reprojected images.
4.1. Analyzing the Use of Different Types of Design References in Reprojected Images
In the current case study, we analyze how the networks of points, lines, or surfaces can be used
as references, and how the image quality is affected by successive capture and reprojection. In Figure 2,
we depict a series of projected–captured–altered–reprojected images. We evaluate objectively the
similarity of each of the images in relation to the first one by calculating the SSIM value, and in Figure 3
we present the results obtained by questioning teachers and students. In Figure 4 we present the
visual dissimilarities between images in different color bands.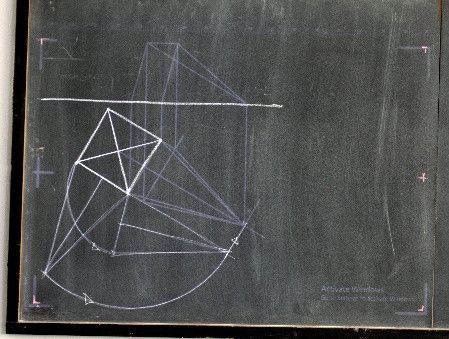
Informatics 2019, 6, 6                                                                                  6 of 17

                     (a)                              (b)                                  (c)

                    (d)                               (e)                                  (f)

                     (g)
      Figure 2. Sample JPEG images (cropped for visibility) of the projection–capture–reprojection process
      repeated six times over a mix of white chalk and computer prepared drawings. (a) First projected
      image used as reference; (b) Second reprojected image plus a chalk drawing in the upper left corner;
      (c) Third reprojected image plus chalk drawing on the right side (d) Only chalk drawing without
      overlapping projected image (e) Fourth reprojected image (f) Fifth reprojected image (g) Sixth
      reprojected image.

    The measured SSIM values for the Figure 2b to 2g having as reference the Figure 2a are presented
below on a scale from 0 to 1, 0 meaning no similarity and 1 meaning 100% similarity:
      •     Figure 2b compared with 2a has similarity of 0.6123,
      •     Figure 2c compared with 2a has similarity of 0.7541,
      •     Figure 2e compared with 2a has similarity of 0.6161,
      •     Figure 2f compared with 2a has similarity of 0.5942,
      •     Figure 2g compared with 2a has similarity of 0.5229.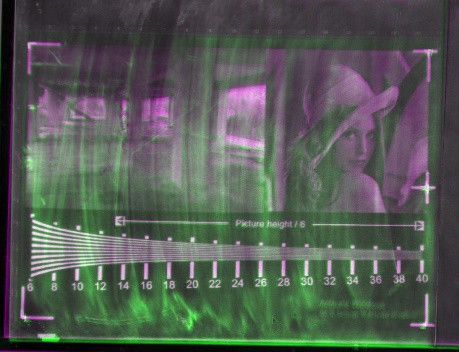
Informatics 2019, 6, 6                                                                                    7 of 17

      Figure 3. (a) Students’ perceived quality of the images presented in Figure 2. (b) Teachers’ perceived
      quality of the images presented in Figure 2.

                    (a)                                (b)                                   (c)

                    (d)                                (e)                                   (f)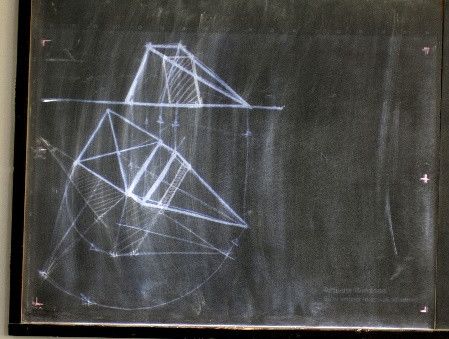
Informatics 2019, 6, 6                                                                                         8 of 17

                    (g)
      Figure 4. Composite RGB image composed of overlaid reference image and reprojected images. (a)
      Figure 2a overlaid with itself; (b) Figure 2b overlaid with 2a; (c) Figure 2c overlaid with 2a; (d) Figure
      2d overlaid with 2a; (e) Figure 2e overlaid with 2a; (f) Figure 2f overlaid with 2a; (g) Figure 2g overlaid
      with 2a.

     In the case of the above design references, we observe the drawing in chalk will always be more
visible. When drawing in chalk on a gray surface (blackboard) over the projected reference image,
the area covered by chalk will have another index of reflection and as a result the drawing has a great
contrast. However, it can be observed that the contrast diminishes in areas covered exclusively by
chalk drawing, without the presence of image reference projection.
     Figure 2a–c represents the result of overlaying the projected reference with the chalk drawings
and should not be considered reprojected images. Only Figure 2e–g are reprojections of the Figure
2c. Observing the SSIM values regarding the first reference Figure 2a we conclude that the drop in
SSIM calculated value is not significant, even both teachers and students consider the third projection
(Figure 2g) as almost unacceptable.

4.2. Analyzing the Use of Projected References in Complex Design
     In the current case study, we present a concrete example of using references as support to
creating complex hand drawings, as well as capturing and successively reprojecting references. In
Figure 5 we depict a series of projected–captured–altered–reprojected images. In Figure 6, we present
further the results of evaluating subjectively the quality of the reprojected images by questioning
both teachers and students.

                     (a)                                 (b)                                     (c)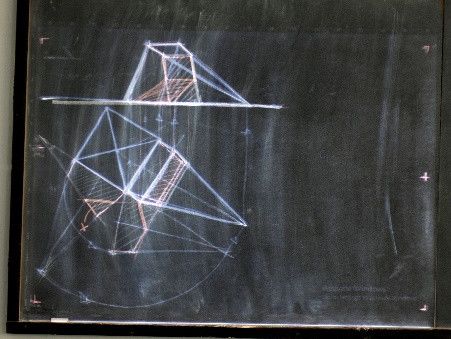
Informatics 2019, 6, 6                                                                                9 of 17

                    (d)                              (e)                                 (f)

                    (g)                              (h)                                 (i)

                     (j)                             (k)
      Figure 5. Sample JPEG images of the projection–capture–reprojection process repeated 11 times over
      a mix of white and colored chalk and computer prepared drawings.

                                                     (a)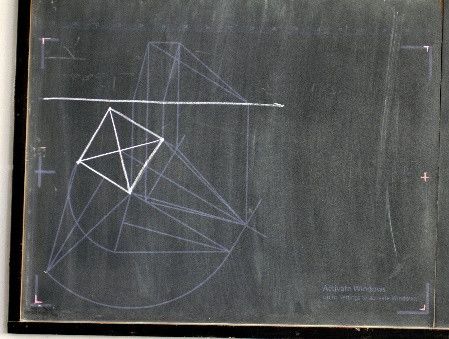
Informatics 2019, 6, 6                                                                             10 of 17

                                                    (b)
      Figure 6. Human perceived quality of the images presented in Figure 5. (a) Students opinion; (b)
      Teachers opinion.

     In this case study we simulated the interactive teaching process where the teacher is asked to
return to previous drawings for further clarifications. Analyzing the teachers’ and the students’
perceptions presented in Figure 6, we observe that the process is feasible even for eleven slides, the
image quality being enough to allow the drawing to be completed. The differences between the
manual drawing of the last step and the initial reference are noticeable, but not high enough to make
the drawing unintelligible.

4.3. Analyzing the Quality of Successive Reprojection
     In the current case study, we analyze how the image quality is affected by successive capture
and reprojection starting from an image composed of a projected computer design reference and a
chalk drawing without any chalk interaction. In Figure 7 we depict a series of projected–captured–
reprojected images, we evaluate objectively the similarity of each of the images in relation to the first
projected one by calculating the SSIM value, and in Figure 8 we present the results obtained by
questioning teachers and students. In Figure 9 we present the visual dissimilarities between images
in different color bands.

                    (a)                             (b)                                 (c)
Informatics 2019, 6, 6 11 of 17
(d) (e)
Figure 7. Sample JPEG images of the projection-capture-reprojection process repeated five times over
a mix of white chalk and computer prepared drawings. (a) Mix of projection and chalk drawing; (b)
Capture and reprojection of Figure 7a; (c) Capture and reprojection of Figure 7b; (d) Capture and
reprojection of Figure 7c; (e) Capture and reprojection of Figure 7d.
The measured SSIM values for Figure 7b–e having as reference Figure 7a are presented below
on a scale from 0 to 1, 0 meaning no similarity and 1 meaning 100% similarity:
• Figure 7b compared with 7a has similarity of 0.6555
• Figure 7c compared with 7a has similarity of 0.4593,
• Figure 7d compared with 7a has similarity of 0.4429,
• Figure 7e compared with 7a has similarity of 0.4242.
Similar with case study number one, we observe that the quality of the reprojected image
deteriorates fast, a high contrast between black and white tones being observed. The human opinion
indicates that from third to fourth reprojection the quality of the image is almost unacceptable. Yet,
there are few situations where an image is needed to be reprojected more than twice and the teacher
needs the go back and forth into presentation interacting with digital images. Observing the SSIM
values regarding the first reference Figure 7a we conclude that the drop in SSIM calculated value is
significant and supports the subjective human opinion.
(a)Informatics 2019, 6, 6 12 of 17
(b)
Figure 8. (a) Students’ perceived quality of the images presented in Figure 7. (b) Teachers’ perceived
quality of the images presented in Figure 7.
(a) (b) (c)
(d) (e)
Figure 9. Composite RGB image composed of overlaid reference image and reprojected images. (a)
Figure 7a overlaid over itself; (b) Figure 7b overlaid over 7a; (c) Figure 7c overlaid over 7a; (d) Figure
7d overlaid over 7a; (e) Figure 7e overlaid over 7a.
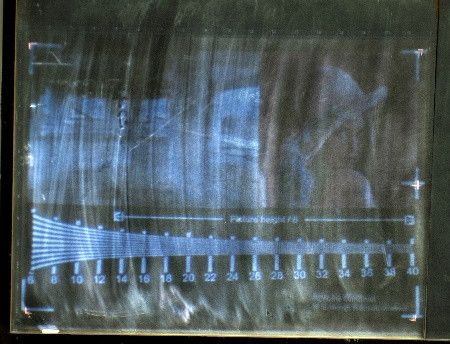
4.4. Analyzing the Loss of Quality in Different Types of Projections
In the current case study, we assess three image type degradation used as a reference: digital
drawing having high contrast of black and white, black and white picture, and colored picture. In
Figure 10 we depict a series of projected–captured–reprojected images. We evaluate objectively theInformatics 2019, 6, 6 13 of 17
similarity of each of the images in relation to the first one by calculating the SSIM value, and in Figure
11 we present the results obtained by questioning teachers and students. In Figure 12 the visual
dissimilarities between images in different color bands are presented.
(a) (b) (c)
(d)
Figure 10. Sample JPEG images of the projection–capture–reprojection process repeated four times
over a mix of computer prepared images. (a) First projected image used as reference; (b) Second
reprojected image; (c) Third reprojected image (d) Fourth reprojected image.
(a)Informatics 2019, 6, 6 14 of 17
(b)
Figure 11. Human perceived quality of the images presented in Figure 10. (a) Students’ opinion; (b)
Teachers’ opinion.
The measured SSIM values for Figure 10b–d having as reference Figure 10a are presented below
on a scale from 0 to 1, 0 meaning no similarity and 1 meaning 100% similarity:
• Figure 10b compared with 10a has similarity of 0.6061,
Figure 10c compared with 10a has similarity of 0.5922,
Figure 10d compared with 10a has similarity of 0.4243.
(a) (b) (c)
(d)
Figure 12. Composite RGB image composed of overlaid reference image and reprojected images (a)
Figure 10a overlaid over itself; (b) Figure 10b overlaid over 10a; (c) Figure 10c overlaid over 10a; (d)
Figure 10d overlaid over 10a.
We observe that degradation during successive reprojection is much faster for photos, with no
significant difference between black and white or color, the degradation being influenced by image
contrast. To maintain acceptable brightness, it is necessary to correct the contrast and brightness ofInformatics 2019, 6, 6 15 of 17
the images before redesigning, emphasizing the texture of the board used as a support for the design.
Yet, the drop of image quality is not so steep, and the system is still feasible albeit using a low-
performance digital projector.
5. Discussion and Conclusion
The current study continued our previous research on hybrid design tools analyzing the
limitations of the developed hybrid system regarding the perceived quality of the images being
repeatedly captured, annotated, and reprojected onto the board. We validated the hybrid system by
evaluating the quality of the projected and reprojected images over a blackboard, using both objective
measurements and subjective human perception. Hybrid techniques of work are natural and
spontaneous and make use of the most efficient available means. Even if this seems to be a logical
approach, it is often rejected as a valid method due to prejudices of some students who perceive these
works as an acceptance of limitations in mastering digital media, and due to prejudices of evaluators
who often prefer images either in analog or in digital media. We consider hybrid design tools the
efficient solution as a mixture of digital and analogic means.
The case studies were developed in order to analyze how the image quality is affected by
successive capture and reprojection using the proposed hybrid system [12]. To emulate real case
scenarios, the case studies were elaborated in one of the classrooms of the Architecture Department
within the university, performing the setup of the hybrid system as for a real design lecture. As
discussed in the previous sections, making a presentation using a digital augmented board can
provide on one side adaptable and interactive answers from teachers to students’ questions, and on
the other side favors the bringing of multisensory perception (tactile plus auditive feedback [27] and
gesture [16]) into the conversation.
We observed that the calculated SSIM values as objective assessments of the quality of
reprojected images for each of the case studies are in harmony with the subjective human opinion,
the increase in the reprojection number being directly proportional with the drop of SSIM value. Yet,
even we consider the SSIM a supporting quality indicator of the subjective human opinion, we
conjecture the human opinion is more relevant in the current context than the objective measurement.
Regarding the human subjective opinion on the quality of the reprojected images we observed that
the teachers group appreciated in general the same image with better score than the group of
students. We think that this situation is normal because the teachers know the result and scope of the
projection at a better level than the students whom at the time of assessment are also involved in an
understanding and learning process. Based on the results obtained from questioning the both groups
of teachers and students we conclude that the quality of the images and the references up to three
consecutive reprojections over the board could be considered acceptable. We observed that the
quality of the reprojected images was influenced both by the complexity of the drawing and by the
perceived contrast. The proposed digital augmented board solution was also very welcomed among
the teachers of geometry and design subjects because projected references, as depicted in previous
sections, are very valuable in complex drawings where hand drawing alone without a reference is
prone to failure. We consider the proposed augmented digital board shortens drastically the time
spent by students on drafting, facilitates easy molding into design software, and creates a framework
for creativity, interactivity, and quick response solutions often required within the jobsite.
Based on the results achieved in the current research, we believe that the proposed hybrid
system could provide qualitative support for disciplines where complex drawings and interaction is
required. Furthermore, we consider the proposed blackboard augmented system able to overcome
the shortcomings of IWBs in interactive lectures, presentations, and workshops.
Author Contributions: All the authors have equally contributed to this work. Conceptualization—C.O.M., O.B.;
Methodology—C.O.M., O.B.; Software—O.B.; Supervision—O.B.; Validation—C.O.M., O.B.
Conflicts of Interest: The authors declare no conflicts of interestInformatics 2019, 6, 6 16 of 17
References
1. Betcher, C.; Lee, M. The Interactive Whiteboard Revolution: Teaching with IWBs; Aust Council for Ed Research:
Melbourne, VIC, Australia, 2009.
2. Schmid, E.C. Potential pedagogical benefits and drawbacks of multimedia use in the English language
classroom equipped with interactive whiteboard technology. Comput. Educ. 2008, 51, 1553–1568.
3. Gillen, J.; Staarman, J.; Littleton, K.; Mercer, N.; Twiner, A. A ‘learning revolution’? Investigating pedagogic
practice around interactive whiteboards in British primary classrooms. Learn. Media Technol. 2008, 32, 243–256.
4. Shenton, A.; Linda, P. From ‘bored’to screen: The use of the interactive whiteboard for literacy in six
primary classrooms in England. Literacy 2007, 41, 129–136.
5. Tataroğlu, B.; Ayten, E. Examining students’ attitudes and views towards usage an interactive whiteboard
in mathematics lessons. Procedia-Soc. Behav. Sci. 2010, 2, 2533–2538.
6. Kennewell, S.; Gary, B. The features of interactive whiteboards and their influence on learning. Learn. Media
Technol. 2007, 32, 227–241.
7. Lewin, C.; Bridget, S.; Stephen, S. Embedding interactive whiteboards in teaching and learning: The process
of change in pedagogic practice. Educ. Inf. Technol. 2008, 13, 291–303.
8. Dede, C. Planning for neomillennial learning styles. Educ. Q. 2005, 28, 7–12.
9. Dorta, T.; Edgar, P.; Annemarie, L. The ideation gap: Hybrid tools, design flow and practice. Des. Stud.
2008, 29, 121–141.
10. Gregorcic, B.; Eugenia, E.; Gorazd, P. A new way of using the interactive whiteboard in a high school
physics classroom: A case study. Res. Sci. Educ. 2018, 48, 465–489.
11. Milincu, C.O.; Tudoran, O.A. Whiteboard upgrade? Discussing specific needs for architecture and design.
In Proceedings of the 5th International Multidisciplinary Scientific Conferences on Social Sciences & Arts
SGEM, Albena Co., Bulgaria, 26 August–1 September 2018; pp. 497–504.
12. Milincu, C.O.; Tudoran, O.A.; Banias, O.; Tarce, P. Hybrid Design Tools—Making of a Digitally Augmented
Blackboard. In Proceedings of the 5th International Multidisciplinary Scientific Conferences on Social
Sciences & Arts SGEM, Albena Co., Bulgaria, 26 August–1 September 2018.
13. Bax, S. Magic Wand or Museum Piece? The Future of the Interactive Whiteboard in Education; IGI Global:
Hershey, PA, USA, 2010.
14. Serriano, P. Form Follows Software, Annual Conference of the Association for Computer Aided Design,
Indianapolis. Available online: https://cumincad.architexturez.net/doc/oai-cumincadworks-id-acadia03-
025 (accessed on 1 November 2018).
15. Arnheim, R. Art and Visual Perception; Univ of California Press: Oakland, CA, USA, 1974.
16. Kumar, S.; Forster, H.M.; Bailey, P.; Griffiths, T.D. Mapping unpleasantness of sounds to their auditory
representation. J. Acoust. Soc. Am. 2008, 124, 3810–3817.
17. Kao, H.S.R. An analysis of user preference toward handwriting instruments. Percept. Mot. Ski. 1976, 43, 522.
18. Racolta, A.; Milincu, C.O. Augmented Creativity or Diminished Shape Complexity? The Use of the
Computer by Students in Furniture Design. In International Multidisciplinary Scientific Conference on Social
Sciences and Arts/SGEM Vienna, Conference Proceedings, Book 5; Vienna, Austria, 22–31 August 2017; pp. 397–415.
19. Panagiotis, P. Analog vs. Digital: Why bother? The role of Critical Points of Change (CPC) as a vital
mechanism for enhancing designability. In Proceedings of the First International Conference on Critical
Digital: What Matter(s)? Cambridge, MA, USA, 18–19 April 2008; pp. 117–127.
20. Oxman, R. Theory and design in the first digital age. Des. Stud. 2006, 27, 229–265.
21. Demirkan, H.; Demirbasx, O. Focus on the learning styles of freshman design students. Des. Stud. 2008, 29,
254–266.
22. Zhang, H.; Yuan, B.; Dong, B.; Jiang, Z. No-Reference Blurred Image Quality Assessment by Structural
Similarity Index. Appl. Sci. 2018, 8, 2003.
23. Wang, Z.; Bovik, A.C.; Sheikh, H.R.; Simoncelli, E.P. Image quality assessment: From error visibility to
structural similarity. IEEE Trans. Image Process. 2004, 13, 600–612.
24. Hutchinson, J. Culture, communication, and an information age Madonna. IEEE Prof. Commun. Soc. Newsl.
2001, 43, 1–7.
25. Pelli, D.G.; Bex, P. Measuring contrast sensitivity. Vis. Res. 2013, 90, 10–14.
26. Simone, G.; Pedersen, M.; Hardeberg, J.Y. Measuring perceptual contrast in digital images. J. Vis. Commun.
Image Represent. 2012, 23, 491–506.Informatics 2019, 6, 6 17 of 17
27. Alibali, M.W.; Bassok, M.; Solomon, K.O.; Syc, S.E.; Goldin-Meadow, S. Illuminating mental
representations through speech and gesture. Psychol. Sci. 1999, 10, 327–333.
© 2019 by the authors. Licensee MDPI, Basel, Switzerland. This article is an open access
article distributed under the terms and conditions of the Creative Commons Attribution
(CC BY) license (http://creativecommons.org/licenses/by/4.0/).You can also read