Monitoring of air quality before the Olympic Games Rio 2016 - SciELO
←
→
Page content transcription
If your browser does not render page correctly, please read the page content below
Anais da Academia Brasileira de Ciências (2019) 91(1): e20170984
              (Annals of the Brazilian Academy of Sciences)
              Printed version ISSN 0001-3765 / Online version ISSN 1678-2690
              http://dx.doi.org/10.1590/0001-3765201920170984
              www.scielo.br/aabc | www.fb.com/aabcjournal

                   Monitoring of air quality before the Olympic Games Rio 2016

       LUCIANA M.B. VENTURA1,2, MICHELLE B. RAMOS2, JÉSSICA O. SANTOS2 and ADRIANA GIODA1

                       1
                          Pontifícia Universidade Católica do Rio de Janeiro/PUC-Rio, Rua Marquês de
                                  São Vicente, 225, Gávea, 22451-900 Rio de Janeiro, RJ, Brazil
         2
           Instituto Estadual do Ambiente/INEA, Avenida Venezuela, 110, Saúde, 20081-312 Rio de Janeiro, RJ, Brazil

                        Manuscript received on December 5, 2017; accepted for publication on July 9, 2018

     How to cite: VENTURA LMB, RAMOS MB, SANTOS JO AND GIODA A. 2019. Monitoring of air quality before
     the Olympic Games Rio 2016. An Acad Bras Cienc 91: e20170984. DOI 10.1590/0001-3765201920170984.

     Abstract: For the accomplishment of Olympic and Paralympic Games in Rio de Janeiro city (Rio 2016),
     the government of the Rio de Janeiro state has undertaken to monitor air quality before and during the
     events. In Beijing, China, and Athens, Greece, the air quality was monitored in Olympic venues in order
     to evaluate the athletes’ performance in relation to the environment in which they were exposed. This
     study has the same proposal to Rio de Janeiro, Brazil. The air quality scenario of the three previous years
     (2013, 2014, 2015) of Rio 2016 was considered. Coarse (PM10) and fine (PM2.5) particles and O3 were
     monitored continuously on the stations located near to competition venues, as required by International
     Olympic Committee (IOC). The levels registered ranged from 6 to 96 μg m-3 for PM10, 1 to 44 μg m-3
     for PM2.5 and 121 to 269 μg m-3 for O3. These concentrations exceeded the national and international air
     quality standards. These high concentrations are associated with uncountable civil works to build Olympic
     arenas and the urban mobility´s improvement. However, the concentrations for all the pollutants monitored
     in Rio de Janeiro city were in lower concentrations than in Beijing Olympic Games 2008.
     Key words: Air quality, PM10, PM2.5, O3, Olympic Games.

                   INTRODUCTION                                 for every three inhabitants – and the second highest
                                                                participation in the Gross Domestic Product (GDP)
The Olympic and Paralympic Games were hosted
                                                                of the country (IBGE 2012).
in Rio de Janeiro city, between August 5th and
                                                                     With very similar characteristics to Athens,
September 18th of 2016. Rio de Janeiro is one
of the 30 biggest megacities in the world, being                Greece, Rio de Janeiro city is also surrounded by
the second biggest city in Brazil and third in                  the sea and mountains, which have an enormous
South America. This city has about six million                  impact in the pollutants atmospheric dispersion
inhabitants and a population density of 5.265 hab               and, consequently, in the air quality. Although Rio
km-2 (IBGE 2012). It has a fleet of 2.6 million                 de Janeiro is a coastal city, which helps the natural
vehicles (DETRAN-RJ 2014) – almost one vehicle                  ventilation, its steep topography, parallel to the cost
                                                                line, makes the air circulation more difficult (Soluri
Correspondence to: Adriana Gioda
E-mail: agioda@puc-rio.br                                       et al. 2007, Godoy et al. 2009). Another factor that
ORCid: https://orcid.org/0000-0002-5315-5650                    influences the city’s air quality is the irregular land-

              Chemical Sciences                                                             An Acad Bras Cienc (2019) 91(1)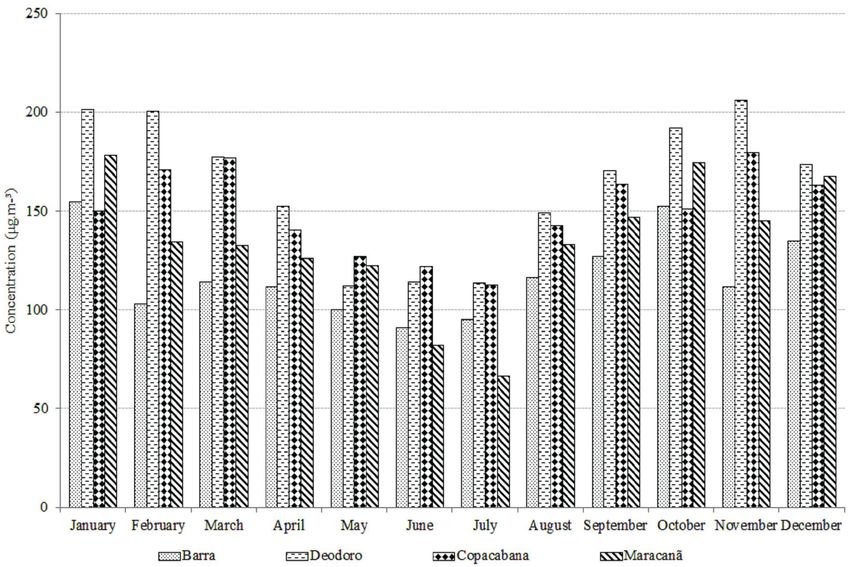
LUCIANA M.B. VENTURA et al.                                                              AIR QUALITY RIO 2016

use. The city’s climate is subtropical, with intense    passages, and, consequently, reduce the athletes’
solar radiation and high temperatures, which            performance (Rundell 2012).
favors the formation of secondary photochemical              Particulate matter (PM) and O3 are between
pollutants.                                             the six pollutants (CO, Pb, SO2, NO2, and O3) used
     Rio de Janeiro city has undergone many             to assess air quality and avoid damage to health
changes, mainly in infrastructure and urban             and ecosystems (U.S.EPA 2012). PM is considered
mobility, due to the World Cup and Olympic              the main pollutant involved in respiratory and
Games. The infrastructure works throughout the          cardiac problems (Dominici et al. 2006). Ozone
city began in 2008. Works included expansion            can also have a negative impact on public health
of the international airport (2008) and hotel           when present in the higher and moderate levels
network (2010), Maracanã stadium reform (2010),         in the atmosphere (Luna et al. 2014). In high
construction of subway (line 4) (2010) and              concentrations, these pollutants can reduce
exclusive bus routes (BRT) (2011) (Ventura et al.       the athletes’ physical capacity and can cause
2016, 2017b).                                           discomfort for the population (Brook et al. 2010).
     At each new choice of the Olympic Games’ host      Therefore, monitoring the air quality is essential to
cities, the demands imposed by the International        the athlete’s performance and population health.
Olympic Committee (IOC) about the monitoring                 In 2011 Environmental Institute of Rio de
air quality have increased. The chosen city must        Janeiro state (INEA) installed air quality monitoring
monitor air quality at least three years before the     stations (PM10, PM2.5 and O3) and meteorology
Olympics and inform the population the air quality      surroundings of the competition venues of
indexes. The pollutant levels must be within the        Olympic Games (Rio 2016), reason for which were
national standards during the Games to avoid            nominated as Olympic Stations (Supplementary
influences on the athletes’ performance. It is due      Material - Table SI) (INEA 2016a, Ventura et al.
to new studies about air quality and health (Brook      2017b). The Olympic Stations and the competition
et al. 2010, Rundell 2012). One of these studies        venues can be visualized in Figure 1.
was performed by the American Heart Association              The goal of this study is to evaluate the results
(AHA), which advised against the practice of            obtained by INEA and IOC regarding the air quality
intense exercises in the presence of unsatisfactory     monitoring in Rio de Janeiro city 3 years before
air quality, even though the sportive medicine          the Olympic and Paralympic Games (Rio 2016), in
societies do not recommend cares with the practice      order to infer about health effects.
of exercises in polluted places (Brook et al. 2010).
                                                                   MATERIALS AND METHODS
Rundell (2012) evaluated the effect of pollution
in athletes’ performance and concluded that the         In order to execute the monitoring of air quality
practice of physical exercises in environments          in the Olympic and Paralympic Games arenas,
with high levels of pollutants reduces sharply          INEA standardized measurement to determine
the pulmonary and vascular function both in             the pollutant levels (PM10, PM2.5 and O3). The air
asthmatic individuals and healthy ones. Therefore,      quality monitoring stations were distributed in
the practice of exercises in long-term in polluted      four sportive regions: Recreio dos Bandeirantes
places is associated to the reduction of pulmonary      and Jacarepaguá (Barra da Tijuca), Gericinó and
function, being able to induce vascular dysfunction,    Campo dos Afonsos (Deodoro), Lagoa, Leblon
due to the systemic oxidative stress and in the nasal   and Urca (Copacabana), as well as Maracanã,

An Acad Bras Cienc (2019) 91(1)                                                              e20170984   2 | 14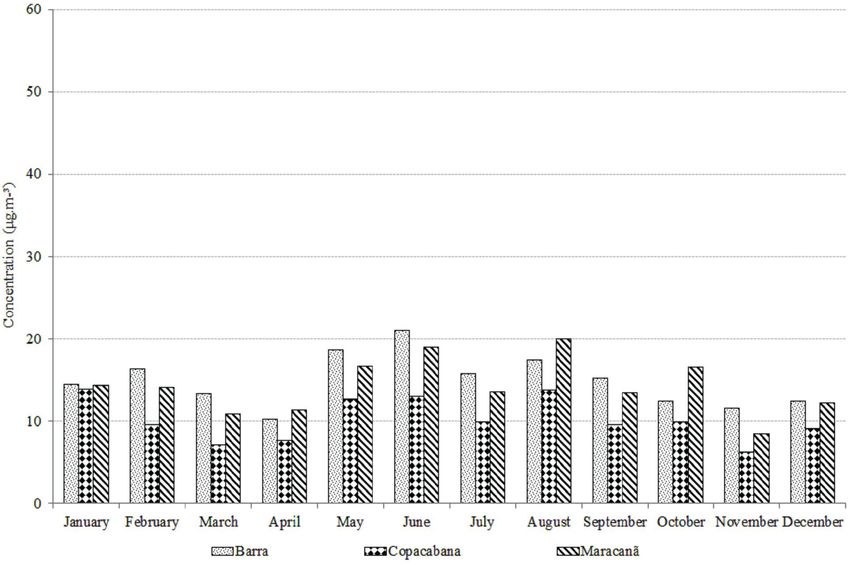
LUCIANA M.B. VENTURA et al.                                                                            AIR QUALITY RIO 2016

          Figure 1 - Map of Olympic stations distributed in Rio 2016 competition venues: 1 - Jacarepaguá; 2 - Recreio
          dos Bandeirantes; 3 - Campos dos Afonsos; 4 - Gericinó; 5 - Urca; 6 - Leblon; 7 - Lagoa; 8 - Maracanã; 9 -
          Engenho de Dentro; 10 - Downtown. Source: Adapted from Ventura et al. 2016.

Engenho de Dentro and Downtown (Maracanã).                        matter (PM2.5 and PM10) concentrations in the
Table I presents the sampling sites and parameters                air for 24 hours every six days, covering every
monitored in each one. This study analyzed data                   day of the week, including weekends, as well as
obtained through 3 years (2013, 2014 and 2015)                    rainy days cover all situations as soon as possible
before the Olympic Games.                                         (INEA 2016a). The particulate matter samples
    The automatic stations perform continuous                     were collected using high volume samplers (Model
measurements of O3 concentrations dispersed in                    AGVMP252 for PM 2.5 and Model AGVMP10
the air, delivering hourly averages. Ozone was                    for PM 10, Energética, Brazil). These samplers
monitored following the U.S.EPA Reference                         retained PM in glass fiber filters (Millipore, USA),
Method EQOA-0506-160 and measured with the                        approximately 3 m above ground level with a
equipment O342M (Environment S.A, France).                        volumetric flow rate of 0.019 m3 s-1. The mass of
The semiautomatic stations monitor particulate                    particulate matter was obtained by the gravimetric

An Acad Bras Cienc (2019) 91(1)                                                                              e20170984   3 | 14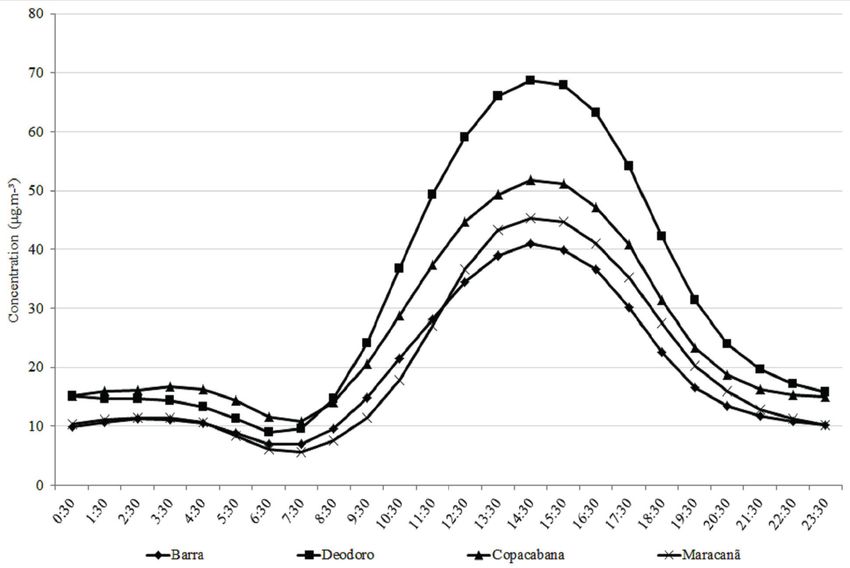
LUCIANA M.B. VENTURA et al.                                                            AIR QUALITY RIO 2016

analysis. The filter mass was weighed before and       for PM2.5 will be included. Although the Brazilian
after collection on an analytical balance (Mettler     legislation has not adopted daily and annual air
E., Zürich. Switzerland, ± 0.0001 g), as described     quality standards to PM2.5 yet, this pollutant has
in the Brazilian Technical Standard (NBR 13412)        been monitored for semiautomatic stations in Rio
method.                                                de Janeiro state since 2011 (Ventura et al. 2017b).
     To better understand some air quality levels,     This study used the air ambient standards (AAS)
it was shown in Table SII the meteorological data      set by U.S.EPA to evaluate the results because these
of each Olympic stations from 2013-2015, such as       standards include health criteria and also socio-
temperature (T), relative humidity (RH), wind speed    economic aspects. For the short-period exposure,
(WS) and direction (WD). The meteorological data       it was adopted the daily standard of 35 µg m-3 and
used in the statistical analyzes were averages of      for long period, the annual standard of 12 µg m-3.
24 h. Besides, it was showed the preferential wind
                                                       PARTICULATE MATTER
direction by Wind Roses (Figure S1).
STATISTICAL ANALYSES                                   The annual average PM2.5 concentrations measured
                                                       from 2013 to 2015 in Rio de Janeiro city ranged
To verify the correlation between the pollutants       from 6 to 20 µg m-3. These levels were lower than
measured by the Olympic station and meteorological     the ones registered in Beijing, China, during the
data, the correlation matrix was used. The Pearson     Olympic Games (46.7 µg m-3) and Pre-Olympic
correlation coefficient quantifies the association     period (72.3 µg m -3), even after the adoption
between two variables. When the correlation            of several measures to control the emission of
coefficient is greater than 0.3 there is correlation   pollutants (Li et al. 2010). These averages are
between the variables. This technique was applied      within the range of the other Latin American
to the data of PM10, PM2.5, O3, T, RH and WS,          cities, e.g. Buenos Aires, Argentina (15 µg m-3)
for the average daily data for criteria pollutants     and Santiago, Chile (30 µg m-3) (Jhun et al. 2013,
concentrations and meteorological parameters,          Arkouli et al. 2010).
except for ozone which adopted maximum daily                The sampling sites located close to urban
concentration. Besides, boxplot was used to            roads are influenced by heavy traffic (Table
represent the distribution of the PM10 and PM2.5       II). Urca’s station was the sampling point with
concentrations for each sport regions from 2013        less vehicular influence while Lagoa was more
to 2015.                                               impacted. The annual average PM2.5 concentrations
                                                       observed at Maracanã ranged from 6 to 13 µg
            RESULTS AND DISCUSSION
                                                       m-3, which are similar to the previous study from
In Brazil, the air quality standards are set by the    2003 to 2005 (9.8 to 11 µg m-3) (Soluri et al. 2007,
National Environment Council through Resolution        Godoy et al. 2009). On the other hand, previous
n. 03, published in 1990 (CONAMA 1990). The            studies performed in Recreio dos Bandeirantes
annual mean PM10 concentration standard is 50 μg       registered lower concentrations of PM2.5 (7.7 µg
m-3 and the daily concentration standard is 150 μg     m-3) (Soluri et al. 2007, Godoy et al. 2009) than
m-3 and for O3 the hourly concentration standard       in this one (11 to 16 µg m-3). Since 2008, this site
is 160 μg m-3. Brazilian legislation has not been      has been received more influence of heavy traffic
updated since its creation in the 1990s. Presently,    due to the construction of an expressway for bus
this resolution is being reviewed, and the limits      circulation (BRT-TransOeste) and constructions

An Acad Bras Cienc (2019) 91(1)                                                            e20170984   4 | 14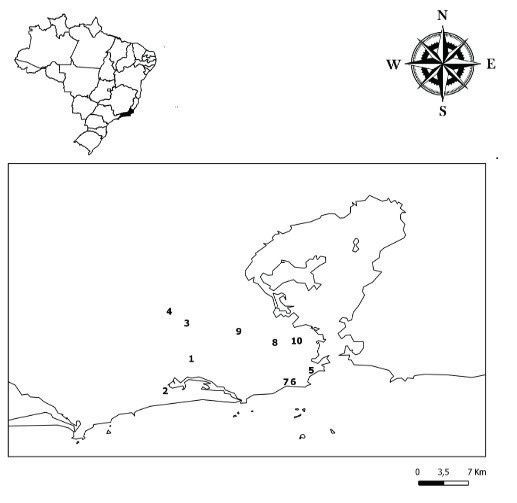
LUCIANA M.B. VENTURA et al.                                                                            AIR QUALITY RIO 2016

                                                      TABLE I
                           Air quality and meteorology Olympic monitoring station network.
                                                                       Coordinate                           Air Quality
      Monitoring station            Sport region
                                                          Longitude                   Latitude              Parameters

          Jacarepaguá                                     -22,93647°              -43,371727°                      O3
                                   Barra da Tijuca
    Recreio dos Bandeirantes                              -22,98928°              -43,414962°                O3 and PM2.5

      Campo dos Afonsos                                   -22,87861°              -43,379278°               O3 and PM10

                                      Deodoro

            Gericinó                                      -22,85933°              -43,408049                 O3 and PM10

             Urca                                         -22,95534°              -43,175882°               O3 and PM2.5

            Leblon                   Copacabana           -22,78423°              -43,222986°               O3 and PM10

             Lagoa                                        -22,97449°              -43,217642°               O3 and PM2.5
                                                                                                           O3, PM10, PM2.5
           Maracanã                                       -22,91039°              -43,235731°

       Engenho de Dentro              Maracanã            -22,89182°              -43,294420°               O3 and PM2.5

          Downtown                                        -22,90739°              -43,195327°                      O3
Source: INEA (2016).

of Arenas (Sport Parks) and Villages’ Athletics for                                TABLE II
                                                              Annual average PM2.5 concentrations in Rio de Janeiro
the Olympic Games (Ventura et al. 2016, 2017b),
                                                                              from 2013 to 2015.
resulting in high levels of pollutants.
                                                                     Annual average PM2.5 concentration (µg m-³)
     In 2014, the annual average PM 2.5
                                                                      Sampling site              2013      2014         2015
concentrations were the highest registered in all
                                                              Urca                                6          11         10
sites. For this year, Lagoa, Engenho de Dentro,
                                                              Lagoa                               10        20          14
Maracanã and Recreio dos Bandeirantes levels                  Recreio dos Bandeirantes            13        16           11
exceeded the annual air quality standard adopted by           Engenho de Dentro                   *          17          12
U.S.EPA (12 μg m-3). On the other hand, the levels            Maracanã                            6          13          11
for all sites decreased in 2015. These data show the        *Did not reach 50 % representativeness.
influence of the civil works in the air quality during                           TABLE III
2014. By 2015, the works were almost completed,               Annual average PM10 concentrations in Rio de Janeiro
therefore the levels decreased. However, the annual                           from 2013 to 2015.
average PM2.5 concentrations in the last three years                  Annual average PM10 concentration (µg m-³)
did not exceed the U.S.EPA AAS.                                       Sampling site              2013       2014        2015

     PM10 annual averages for all sampling sites             Campo dos Afonsos                    21         36          30

are present in Table III. In Campo dos Afonsos,              Gericinó                             23         35          31

Gericinó, Leblon sites were registered annual                Leblon                               22         41          44
                                                             Maracanã                             43         58          61
average concentration below the limit (50 μg m-3)

An Acad Bras Cienc (2019) 91(1)                                                                            e20170984      5 | 14
LUCIANA M.B. VENTURA et al. AIR QUALITY RIO 2016
established by CONAMA and U.S.EPA AAS. Only the heavy vehicles that worked on the constructions
Maracanã station presented averages higher than (Vassilakos et al. 2005). The annual average PM10
Brazilian legislation (58 and 61 µg m-3). The high concentration (21 - 61 μg m-3) verified on the Rio
PM10 levels recorded on this site are related to the de Janeiro’s Olympic stations were very similar to
stadium renovation works. Athens in the period of 2001 to 2004 (30 - 60 μg
As observed in Ventura et al. (2017a) study in m-3) (Gryparis et al. 2014) and much smaller than
Downtown, Copacabana and Maracanã sites, in all the ones registered in Beijing between 2007 and
sport regions were verified a negative relationship 2008 (124 - 152 μg m-3) (He et al. 2016).
between RH and T (Table IV). The negative According to the Atmospheric Emissions
value means that these variables are inversely Inventory of the Metropolitan Region of Rio de
proportional, i.e., when the temperature increases Janeiro (FEEMA 2004), the vehicles are responsible
an expansion in air volume occurs, resulting in a for 40% of PM10 emissions. Recent inventory
decrease in relative humidity. (SEA 2011) estimated that 91% of the total vehicle
During the three years of monitoring before emissions are generated by diesel burning.
the Olympic Games in Copacabana, Maracanã and Monthly data of particulate matter are a
Deodoro regions, the daily PM10 concentrations
good indicator of atmospheric pollution, not only
varied from 6 to 96 µg m-3, which are lower than
because it shows a direct standard measure for the
Brazilian and U.S.EPA guidelines (150 µg m-3).
concentration of dust in the air, but also because
In the same period, daily PM2.5 concentrations
of direct relation to the human health (Leys et al.
varied from 1 to 44 µg m-3 in Barra da Tijuca and
2011). PM10 seasonality was also studied by Gioda
Copacabana regions. In the Maracanã region, on
et al. (2016), who had already verified through
the other hand, the concentrations varied from 2.5
the time series analysis of this pollutant in Rio
to 87 µg m-3. These results enhance the influence
de Janeiro city, that there was a trend to increase
of the sea breeze in this pollutant dispersion, as
during the austral wintertime (June 21 to September
well as the characteristic of the emission source
21). This trend was related to low rainfall and air
in the concentration levels (vehicles, industries,
mass stagnation. Therefore, the Olympics occurred
marine aerosols, and others). In these sites,
the levels exceeded the U.S.EPA AAS (35 µg during the period with higher pollutant levels. This
m-3). Copacabana region is close to the sea and is worrying because, during the exercise practice,
Guanabara Bay, which favors air entrance in the the quantity of fine particles deposited in the
continent and consequently, atmospheric pollutants respiratory tract is inversely proportional to its size.
dispersion (Ventura et al. 2017a). For this reason, In other words, the smaller the particles, the bigger
lowest monthly mean concentrations for both PM10 the quantity deposited, which during a physical
and PM2.5 were observed. practice can come to be five times superior to the
From 2013 to 2015, an increase in the annual ones registered when the body is resting (Daigle et
average PM10 concentrations was verified in all al. 2003).
sampling sites (Table III). The same happened in Figure S2 presents box plots for the distribution
Athens, where this behavior was associated with the of PM10 and PM2.5 concentrations for each sport
significant increase of civil works (buildings, roads, regions from 2013 to 2015. It was observed that
sportive installations etc.) to the 2004 Olympic the PM10 data set was very similar. However, in
Games, which may have caused an increase of PM10 Maracanã PM2.5 concentrations showed a large
levels by the emission or resuspension of dust by variation in its data set, due some days in this region
An Acad Bras Cienc (2019) 91(1) e20170984 6 | 14LUCIANA M.B. VENTURA et al. AIR QUALITY RIO 2016
TABLE IV
Pearson correlation matrix of meteorological variables, PM2.5, PM10 and O3 for each sport region from 2013 to 2015 (the
bold values are significant statistically (> 0.30).
Sport regions Variables O3 PM2.5 PM10 WS T RH
O3 1 0.34 - 0.01 0.26 -0.29
PM2.5 0.34 1 - -0.27 0.11 -0.21
Barra WS 0.01 -0.27 - 1 -0.00 -0.10
T 0.26 0.11 - -0.00 1 -0.55
RH -0.29 -0.21 - -0.10 -0.55 1
O3 1 0.40 0.41 0.13 0.39 -0.36
PM2.5 0.40 1 0.74 -0.01 0.24 -0.31
PM10 0.41 0.74 1 -0.18 0.28 -0.45
Copacabana
WS 0.13 -0.01 -0.18 1 0.08 -0.25
T 0.39 0.24 0.28 0.08 1 -0.49
RH -0.36 -0.31 -0.45 -0.25 -0.49 1
O3 1 - 0.30 0.03 0.50 -0.49
PM10 0.30 - 1 -0.12 -0.05 -0.24
Deodoro WS 0.03 - -0.12 1 0.07 -0.12
T 0.50 - -0.05 0.06 1 -0.63
RH -0.48 - -0.24 -0.12 -0.63 1
O3 1 0.34 0.42 0.08 0.62 -0.50
PM2.5 0.34 1 0.80 -0.13 0.23 -0.29
Maracanã PM10 0.42 0.80 1 -0.08 0.31 -0.45
WS 0.08 -0.13 -0.08 1 0.086 -0.08
T 0.62 0.23 0.31 0.086 1 -0.63
RH -0.50 -0.29 -0.45 -0.08 -0.63 1
the air quality was influenced by power generator were registered from May to September, as expected,
as traffic. due to the unfavorable conditions to the atmospheric
In Maracanã and Copacabana region were pollutants’ dispersion. On the other hand, lower
monitored PM2.5 and PM10. When it was applied concentrations were measured in November and
Pearson Correlation matrix between these pollutants December, during the rainy season. In Beijing, as
(Table IV), it was observed high correlations (> well as in Rio de Janeiro city, the winter was also
0.7). According to Silva et al. (2016), this result the season less prone to the pollutant’s dispersion,
indicates that these data are highly related and resulting in average PM2.5 concentrations of 140 (±
most likely have the same emission sources and/or 42) µg m-3; while the summer was 92 (±25) µg m-3
similarity in formation and consumption processes. (Lv et al. 2016). However, in Greece in 2003, the
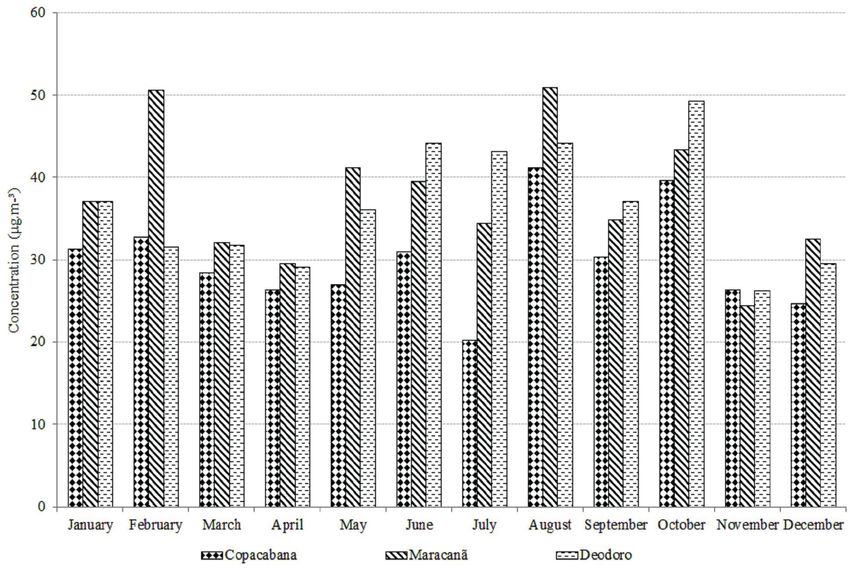
Figures 2 and 3 presented monthly average average PM2.5 concentrations were lower in winter
PM10 and PM2.5 distributed in the sportive regions (15 µg m-3) than in the summer and spring (25 µg
to verify the particulate matter behavior on the m-3) (Vassilakos et al. 2005).
different seasons, especially in winter, the period of Gioda et al. (2016) studied the PM 10
the Olympics. According to the t-student test with performance at several monitoring sites in Rio
95% confidence level, the highest concentrations de Janeiro state from 1998 to 2013, including
An Acad Bras Cienc (2019) 91(1) e20170984 7 | 14LUCIANA M.B. VENTURA et al. AIR QUALITY RIO 2016
Figure 2 - Monthly average PM10 concentrations by sporting regions during 2013-2015.
Figure 3 - Monthly average PM2.5 concentrations by sporting regions during 2013-2015.
An Acad Bras Cienc (2019) 91(1) e20170984 8 | 14LUCIANA M.B. VENTURA et al. AIR QUALITY RIO 2016
Maracanã. The annual average PM10 concentrations high concentrations of the precursor gases emitted
registered in Maracanã in this period ranged from 39 by vehicles in this area, within more than 10 ton
to 55 μg m-3. In 2014 and 2015 there were increases NOx and 2 ton VOCs per year (INEA 2016b).
in concentrations of this pollutant, probably due to Moreover, in this region, a big mountain prevents
infrastructure works. Studies evaluating the toxicity the pollutant dispersion, as it was also observed
and hospitalization caused by PM 10 in Rio de by Martins et al. (2015), Tsuruta et al. (2017) and
Janeiro city were performed and indicating a strong Geraldino et al. (2017) in recent studies in west
correlation with health problems (Rodríguez-Cotto region in Rio de Janeiro city.
et al. 2014, Gioda et al. 2011, Sousa et al. 2012). Martins et al. (2015) evaluated three stations
(Bangu, Irajá and Campo Grande) in west region
OZONE
in Rio de Janeiro city, located along Avenida
In Rio de Janeiro city, high ozone concentrations Brasil, which is the main traffic route, with more
than 50,000 vehicles per day (INEA 2016b). This
represent the main air pollution problems and have
highway is the same that passes near the air quality
resulted in several national air quality standard
station in Deodoro. The researchers concluded that
violations (Martins et al. 2015, Silva et al. 2016).
these sites were influenced by vehicle emissions,
Table V presents the maximum hourly ozone
with no significant influences from stationary
concentrations obtained in 2013, 2014 and 2015,
sources.
and the violations of the Brazilian standard (160
In Bangu station, neighborhood Deodoro
µg m-3). In Olympic areas were verified 34, 111 and
region was observed by Silva et al. (2016) the
49 violations to ozone concentrations from 2013 to
highest ozone concentrations and the largest
2015, respectively, where the national standard was
number of air quality standard exceedances in
exceeded.
Rio de Janeiro city in 2012 and 2013. According
Barra and Copacabana regions represented
to Tsuruta et al. (2017), it is justified because this
together 16% of all violations observed in Olympic region is characterized by higher temperatures
areas due to land-sea breezes affecting ozone and poor air circulation in comparison to the other
concentrations at coastal sites (Luna et al. 2014), regions of the city. Geraldino et al. (2017), who
which favors atmospheric pollutants dispersion also studied Bangu, concluded that the mountains
(Ventura et al. 2017c), reducing these levels. in the southern and northern part of the west region
In all sport regions, ozone showed a positive contribute to the increase of surface temperature
correlation with PM 2.5 and PM 10 (Table IV). and the accumulation of local and transported
According to Martins et al. (2015), although pollutants. Then, high ozone concentrations are
PM does not directly participate in the process mainly associated with adverse meteorological and
of ozone formation, environments with higher topographical conditions.
PM concentrations block solar radiation due to Ozone episodes, which are when the national
light scattering and decrease the photochemical standards are exceeded, was verified by Geraldino
dissociation of NO 2 . This photochemical et al. (2017) in Rio de Janeiro city, in special in
dissociation of NO2 initiates the process of ozone Bangu, with more frequency with weak surface
formation by forming atomic oxygen. winds, wind speeds lower than 2 m s-1 and from
Deodoro region presented the highest hourly east (E), similar to observed in Gericinó station in
ozone concentrations compared to other study 2013, where occurred the second biggest violation
regions (Table V). This can be explained for the number during 3 monitored years. However, most
An Acad Bras Cienc (2019) 91(1) e20170984 9 | 14LUCIANA M.B. VENTURA et al. AIR QUALITY RIO 2016
TABLE V
Maximum hourly O3 concentrations and number of overtaking to the air quality standard from 2013 to 2015 in Rio de
Janeiro.
2013 2014 2015
Sampling site Maximum Maximum
Maximum number of hourly number of hourly number of
hourly (µg m-³) overtaking overtaking overtaking
(µg m-³) (µg m-³)
Gericinó 207 1 186 13 160 0
Campo dos
205 16 234 81 198 18
Afonsos
Maracanã 144 0 269 12 219 10
Engenho de
165 1 181 3 190 8
Dentro
Downtown 126 0 123 0 121 0
Urca 232 8 176 2 252 8
Lagoa 209 5 143 0 171 3
Leblon 178 2 145 0 170 2
Jacarepaguá N.A N.A N.A N.A 128 0
Recreio dos
234 1 126 0 156 0
Bandeirantes
N.A - without sampling.
Olympic stations showed wind direction to su- ozone concentrations are strongly connected to
southeast (SSE) with a wind speed of 1 m s-1. meteorological conditions.
Despite the reduction of sulfur contents in Figure 4 showed the concentration of O3 in
diesel from 500 ppm to 10 ppm from 2011 to 2013, hourly average through the 3 years. So as verified
the introduction of catalysts in the new trucks and by Martins et al. (2015), the O3 concentrations
the reduction of NOx levels, ozone levels were begin to increase after sunrise and peaked between
not affected. A similar observation was done by a 13 - 15 h, which occurs the most intense solar
group of researchers (Adame et al. 2008, Wilson radiation along with high NOx levels (INEA
et al. 2012) who analyzed trends in ozone levels 2016a). The highest hourly O3 concentrations were
in the European troposphere. They indicated that measured from November to February, when levels
ozone average levels have been increasing, despite as high as 200 µg m³ were registered (Figure 5).
reductions in pollutants, which impact ozone High temperatures, low formation of clouds and
formation. However, they also identified year-by- high incidence of solar radiation are the main
year variations, caused by climate and weather reasons for the results obtained. These are common
events, and suggested they could be masking the phenomena in this period of the year that naturally
impact of emission reductions on long-term ozone helps the formation of O 3 in the atmosphere
trends. This study confirmed that the relationship especially in subtropical climate regions, like the
between ozone and its precursors is complicated. Rio de Janeiro city (Silva et al. 2018). The lowest
It is caused by the fact that meteorological and O3 concentrations were observed during the early
chemical processes can interact over a remarkably morning due to weak sunlight as well as the
wide range of temporal and spatial scales. Luna consumption processes prevailing over the forming
et al. (2014) verified in Rio de Janeiro City processes (Martins et al. 2015)
An Acad Bras Cienc (2019) 91(1) e20170984 10 | 14LUCIANA M.B. VENTURA et al. AIR QUALITY RIO 2016
Figure 4 - Hourly average O3 concentrations by sporting regions during 2013-2015.
Figure 5 - Monthly maximum hourly O3 concentrations by sporting regions during 2013-2015.
An Acad Bras Cienc (2019) 91(1) e20170984 11 | 14LUCIANA M.B. VENTURA et al. AIR QUALITY RIO 2016
Important and positive correlations were were much lower than that measured in Beijing,
between O3 and T (0.30 - 0.62). The bolded values in 2008. But, it is worth to mention, that the O3
in Table IV were significant statistically. According and PM2.5 were the pollutants that exceeded the air
to Silva et al. (2016), although the process of quality standards more often. Therefore, they were
ozone formation is initiated photochemically, the considered the critical pollutants to be controlled
correlation was also high for the temperature. during Rio 2016. Lastly, it is expected that with
This fact was justified because solar radiation and the end of all civil works initiated due to the 2016
temperature are two meteorological parameters Olympic Games, the air quality in Rio de Janeiro
that are interconnected and highly correlated. city will improve, especially during the sportive
Ozone episodes usually occur during hot and event.
sunny days (spring and summer), where strong
ACKNOWLEDGMENTS
solar radiation and high temperatures favor the
reactions that lead to the ozone formation and The authors are grateful to the Instituto Estadual
various other oxidizing species (Finlayson-Pitts do Ambiente (INEA) for the data, Fundação Carlos
and Pitts 2000). Therefore, these days were not Chagas Filho de Amparo à Pesquisa do Estado do
expected during the August of 2016, when the Rio de Janeiro (FAPERJ) and Conselho Nacional
Olympic Games happened, because, in the winter de Desenvolvimento Científico e Tecnológico
of the last three years (2013, 2014 and 2015), the (CNPq) for financial support.
hourly maximum O3 concentrations did not reach
the Brazilian standard (160 µg m³). AUTHOR CONTRIBUTIONS
CONCLUSION LMB Ventura worked on paper design, data
interpretation and writing. JO Santos worked on
In order to reduce the impact of air quality on the writing essay and methodology. MB Ramos
athletes’ performance, the State of Rio de Janeiro worked on methodology and data interpretation. A
installed monitoring networks to determine the Gioda worked on the final essay and critical review.
levels of the main pollutants (PM10, PM2.5, and O3)
before and during Olympic Games Rio 2016. This REFERENCES
study presents data from 2013 to 2015, a period
ADAME JA, LOZANO A, BOLÍVAR JP, DE LA MORENA
before Rio 2016, which occurred the main changes BA, CONTRERAS J AND GODOY F. 2008. Behavior,
in the city’s infrastructure (e.g., construction of distribution and variability of surface ozone at an arid
roads, hotels, arenas etc). According to the results, region in the south of Iberian Peninsula (Seville, Spain).
Chemosphere 70: 841-849.
concentrations of PM10 and PM2.5 had increased
ARKOULI M, ULKE A, ENDLICHER W, BAUMBACH G,
in this period (2013-2015) when compared to SCHULTZ E, VOGT U, MÜLLER M, DAWIDOWSKI L,
previous years. This input is mainly caused by FAGGI A AND WOLF-BENNING U. 2010. Distribution
the uncountable civil works initiated in Rio de and temporal behavior of particulate matter over the urban
area of Buenos Aires. Atmos Pollut Res 1: 1-8.
Janeiro city to Olympic arenas construction and BROOK RD ET AL. 2010. Particulate matter air pollution
urban mobility improvements. This scenario was and cardiovascular disease: An update to the scientific
also verified in other host-cities, like Athens, statement from the American Heart Association.
Circulation 121: 2331-2378.
in Greece, in the preparation the 2004 Olympic
CONAMA - CONSELHO NACIONAL DO MEIO
Games. However, the concentrations observed AMBIENTE. 1990. Resolução nº 3, publicada em 28 de
for all pollutants monitored in Rio de Janeiro city Junho de 1990. Dispõe sobre padrões de qualidade do
An Acad Bras Cienc (2019) 91(1) e20170984 12 | 14LUCIANA M.B. VENTURA et al. AIR QUALITY RIO 2016
ar, previstos no PRONAR. Disponível em: . (Acesso
mma.gov.br/port/conama/legiabre.cfm?codlegi=100>. em Julho, 2016).
(Acesso em Maio, 2016). INEA - INSTITUTO ESTADUAL DO AMBIENTE. 2016a.
DAIGLE CC, CHALUPA DC, GIBB FR, MORROW PE, Relatório da Qualidade do Ar, Ano Base 2015. Disponível
OBERDÖRSTER G, UTELL MJ AND FRAMPTON em: . (Acesso em Julho, 2016).
DETRAN-RJ - DEPARTAMENTO DE TRÂNSITO DO INEA - INSTITUTO ESTADUAL DO AMBIENTE. 2016b.
ESTADO DO RIO DE JANEIRO. 2014. Frota de Veículos Inventário de emissões de fontes veiculares da Região
do Estado do Rio de Janeiro. Disponível em: . (Acesso Disponível em: . (Acesso em Agosto, 2016).
MCDERMOTT A, ZEGER SL AND SAMET JM. 2006. JHUN I, OYOLA P, MORENO F, CASTILLO M AND
Fine particulate air pollution and hospital admission for KOUTRAKIS P. 2013. PM2.5 mass and species trends in
cardiovascular and respiratory diseases. JAMA 295: Santiago, Chile, 1998 to 2010: The impact of fuel-related
1127-1134. interventions and fuel sales. J Air Waste Manag Assoc 63:
FEEMA - FUNDAÇÃO ESTADUAL DE ENGENHARIA DO 161-169.
MEIO AMBIENTE. 2004. Inventário de Fontes Emissoras LEYS JF, HEIDENREICH SK, STRONG CL, MCTAINSH
de Poluentes Atmosféricos da Região Metropolitana do GH AND QUIGLEY S. 2011. PM10 concentrations and
mass transport during “Red Dawn” – Sydney 23 September
Rio de Janeiro. Rio de Janeiro, 144 p.
2009. Aeolian Res 3: 327-342.
FINLAYSON-PITTS BJ AND PITTS JR JN. 2000. Chemistry
LI Y, WANG W, KAN H, XU X AND CHEN B. 2010. Air
of the upper and lower atmosphere: theory, experiments
quality and outpatient visits for asthma in adults during
and applications. Elsevier Inc., San Diego, 969 p.
the 2008 Summer Olympic Games in Beijing. Sci Total
GERALDINO CGP, MARTINS EM, SILVA CM AND
Environ 408: 1226-1227.
ARBILLA G. 2017. An Analytical Investigation of Ozone
LUNA A, PAREDES M, OLIVEIRA G AND CORREA S.
Episodes in Bangu, Rio de Janeiro. Bull Environ Contam
2014. Prediction of ozone concentration in tropospheric
Toxicol 98: 632-637.
levels using artificial neural networks and support vector
GIODA A, AMARAL BS, MONTEIRO ILG AND
machine at Rio de Janeiro, Brazil. Atmos Environ 98: 98-
SAINT’PIERRE TD. 2011. Chemical composition,
104.
sources, solubility, and transport of aerosol trace elements
LV B, ZHANG B AND YUQI B. 2016. A systematic analysis
in a tropical region. J Environ Monitor 13: 2134-2142.
of PM2.5 in Beijing and its sources from 2000 to 2012.
GIODA A, VENTURA LMB, RAMOS MB AND SILVA Atmos Environ 124: 98-108.
MPR. 2016. Half Century Monitoring Air Pollution in a MARTINS EM, NUNES ACL AND CORRÊA SM. 2015.
Megacity: a Case Study of Rio de Janeiro. Water Air Soil Understanding Ozone Concentrations During Weekdays
Pollut 227: 1-17. and Weekends in the Urban Area of the City of Rio de
GODOY MLDP, GODOY JM, ROLDÃO LA, SOLURI DS Janeiro. J Braz Chem Soc 26: 1965-1975.
AND DONAGEMMAB RA. 2009. Coarse and Fine RIO2016 - RIO DE JANEIRO OLYMPIC GAMES
Aerosol Source Apportionment in Rio de Janeiro, Brazil. WEBSITE. 2016. Available at: (Accessed in May, 2016).
GRYPARIS A, DIMAKOPOULOU K, PEDELI X RODRÍGUEZ-COTTO RI, ORTIZ-MARTÍNEZ MG,
AND KATSOUYANNI K. 2014. Spatio-temporal RIVERA-RAMÍREZ E, MATEUS VL, AMARAL BS,
semiparametric models for NO2 and PM10 concentration JIMÉNEZ-VÉLEZ BD AND GIODA A. 2014. Particle
levels in Athens, Greece. Sci Total Environ 479-480: 21- pollution in Rio de Janeiro, Brazil: Increase and decrease
30. of pro-inflammatory cytokines IL-6 and IL-8 in human
HE G, FAN M AND ZHOU M. 2016. The effect of air lung cells. Environ Pollut 194: 112-120.
pollution on mortality in China: Evidence from the 2008 RUNDELL KW. 2012. Effect of air pollution on athlete health
Beijing Olympic Games. J Environ Econ & Management and performance. Br J Sport Med 46: 407-412
79: 18-39. SEA - SECRETARIA ESTADUAL DO AMBIENTE. 2011.
IBGE - INSTITUTO BRASILEIRO DE GEOGRAFIA E Inventário de Emissões Atmosféricas por Veículos
ESTATÍSTICA. 2012. Estimativas de população, 2012. Automotores do Estado do Rio de Janeiro. Disponível
Disponível em:LUCIANA M.B. VENTURA et al. AIR QUALITY RIO 2016
Relat%C3%B3rio_Inventario_2011.pdf>. (Acesso em VENTURA LMB, DE OLIVEIRA FP, SOARES LM, LUNA
Agosto, 2016). AS AND GIODA A. 2017a. Evaluation of air quality in a
SILVA CM, SILVA LL, CORRÊA SM AND ARBILLA GA. megacity using statistics tools. Meteorol Atmos Phys 130:
2018. minimum set of ozone precursor volatile organic 1-10.
compounds in an urban environment. Atmos Pollut Res VENTURA LMB, MATEUS VL, ALMEIDA ACSL,
9: 369-378. WANDERLEY KB, TAIRA FT, SAINT’PIERRE TD
SILVA DBN, MARTINS EM AND CORRÊA SM. 2016. Role
AND GIODA A. 2017b. Chemical composition of fine
of carbonyls and aromatics in the formation of tropospheric
particles (PM2.5): water-soluble organic fraction and trace
ozone in Rio de Janeiro, Brazil. Environ Monit Assess
metals. Air Qual Atmos Health 10: 845-852.
188: 289-301.
SOLURI DS, GODOY MLDP, GODOY JM AND ROLDÃO VENTURA LMB, RAMOS MB, FERNANDES LC, SOARES
LA. 2007 Multi-site PM2.5 and PM2.5-10 Aerosol Source CM AND SANTOS JO. 2016. Rio 2016: Qualidade do
Apportionment in Rio de Janeiro. Brazil. J Braz Chem Soc ar e condições meteorológicas nos locais de competição.
18: 838-845. Ineana 4: 6-47.
SOUSA SIV, PIRES JCM, FORTES JDN, MARTINS EM, WILSON RC, FLEMING ZL, MONKS PS, CLAIN G,
MARTINS FG AND ALVIM-FERRAZ MCM. 2012. HENNE S, KONOVALOV IB, SZOPA S AND MENUT
Short-term effects of air pollution on respiratory morbidity L. 2012. Have primary emission reduction measures
at Rio de Janeiro - Part I. Environ Int 43: 1-5. reduced ozone across Europe? An analysis of European
TSURUTA F, CARVALHO NJ, SILVA CM AND ARBILLA rural background ozone trends 1996-2005. Atmos Chem
G. 2017. Air Quality Indexes in the City of Rio de Janeiro Phys 12: 437-454.
During the 2016 Olympic and Paralympic Games. J Braz
Chem Soc 29(6): 1291-1303.
SUPPLEMENTARY MATERIAL
U.S.EPA - UNITED STATES ENVIRONMENTAL
PROTECTION AGENCY. 2012. Responses to Significant
Table SI - Olympic stations and sports modalities.
Comments on the 2012 Proposed Rule on the National
Table SII - Meteorological data of Olympic stations from
Ambient Air Quality Standards for Particulate Matter.
2013-2015.
Available at: < http://www.epa.gov/ttn/naaqs/standards/
pm/data/20121214rtc.pdf>. (Accessed in May, 2016). Figure S1 - Wind rose from 2013-2015 data of the stations:
VASSILAKOS CH, SARAGA D, MAGGOS TH, 1 - Jacarepaguá; 2 - Recreio dos Bandeirantes; 3 - Campos
MICHOPOULOS J, PATERAKI S AND HELMIS CG. dos Afonsos; 4 - Gericinó; 5 - Urca; 6 - Leblon; 7 - Lagoa; 8 -
2005. Temporal variations of PM2.5 in the ambient air of Maracanã; 9 - Engenho de Dentro; 10 - Downtown.
a suburban site in Athens, Greece. Sci Total Environ 349: Figure S2 - Boxplot for the PM10 and PM2.5 concentrations for
223-231. each sport regions from 2013 to 2015.
An Acad Bras Cienc (2019) 91(1) e20170984 14 | 14You can also read