Using Infoveillance to Identify Community Concerns/Literacy, Reduce Risk, and Improve Response in Pollution and Health Emergencies
←
→
Page content transcription
If your browser does not render page correctly, please read the page content below
E3S Web of Conferences 241, 03002 (2021)                                                                https://doi.org/10.1051/e3sconf/202124103002
ICEPP 2020

         Using Infoveillance to Identify Community Concerns/Literacy,
         Reduce Risk, and Improve Response in Pollution and Health
         Emergencies

         Andrea L. Crampton 1,* , Nargiza Pearce1, and Angela T. Ragusa1
         1Institute   for Land, Water, & Society, Charles Sturt University, Albury, Australia

                         Abstract. Contextualised in public health and environmental literacy frameworks, this interdisciplinary
                         research applies the epidemiological concept ‘infoveillance’ to show how major pollution events can be
                         mitigated by better use of information communication technologies (ICTs). Findings from statistical
                         analysis of Google Trends™ data during a major Australian air pollution event (2019–2020 Summer
                         bushfires) are presented to compare community environmental and health concerns, as manifested by
                         Google searches, in three affected states. Internet searches related to air purifiers, air quality, and P2 face
                         masks increased as the measured air quality decreased. The commonality of internet search activity found
                         across states, in response to pollution emergencies, presents a valuable, yet underutilised, information
                         source for disaster management and response by health authorities and businesses. Significant correlations
                         between the public’s keyword searches and pollution risk suggest Google Trends™ are an underutilised ICT
                         for identifying public health literacy, needs, and emergency response. The 2019-2020 bushfire infoveillance
                         analysis suggests earlier intervention/awareness of predictable community response to risk-management
                         may mitigate insufficient supply of personal protective equipment (i.e., air purifiers) and alert authorities of
                         illiteracies requiring immediate, urgent ramification to reduce public health risk and improve emergency
                         response, including for vulnerable populations.

      1 Introduction                                                            as the National Clean Air Agreement [5] . Limited public
                                                                                science literacy, coupled with perceptions that the State
      Air pollution is a growing concern globally [1]. While air                will suitably protect citizens in emergency events can,
      pollution derives from multiple and varied sources,                       and does, leave society ‘at risk’ when disaster strikes.
      ‘bushfires’, alternatively termed ‘wildfires’, pose a                     With internet ‘googling’ a common contemporary
      sizable risk to human, environmental, and economic                        response, large improvements in public literacy and
      protection. Information communication technologies                        response can be gained from better health authority ICT
      (ICT), however, pose new outlets to conceptualise and                     management and analysis.
      research how time-sensitive information is delivered,                          Often, it is not until major pollution/health emergency
      used, and actioned, specifically related to emergency                     events arise that public (il)literacy becomes evident, and,
      events. This paper presents findings from a study                         moreover, becomes necessary to manage or mitigate by
      employing ‘infoveillance’ [2], the use of internet-based                  prompting, and sometimes enforcing, public health
      information often for epidemiological assessment, to                      actions. Although this is visible in state governments’
      illustrate how and why a collaborative approach between                   response in Australia to enforcing COVID-19 public
      government and public risk knowledge may better                           health-mitigating actions [6], for the Summer 2019/2020
      mediate emergency action responses to events.                             Bushfire Event [henceforth, ‘the event’], identifying
      Specifically, Australian government air quality data is                   when and if residents’ exposure to pollutants required a
      analysed alongside the public’s expression of                             personal mitigating action for safety reasons, individual
      science/health literacy and risk-management response by                   pollution exposure minimisation actions have received
      information-searching in a global social environment,                     little research investigation or government concern [7],
      namely the ‘internet’.                                                    despite the life-threatening risk smoke inhalation poses
          Air quality monitoring and reporting is deficient in                  even to those geographically distant from active bushfires.
      the developed world, including Australia and America [3,                       Worldwide, health authorities’ ability to inform and
      4]. Arguably, less is known, or available, about air                      assist the public with the management of unexpected air
      pollution to residents in the developing world because of                 pollution exposure is lacking [8]. In the absence of such
      the perception that the State ensures provision of ‘clean                 systems, scope exists to utilise ICT generally, and,
      air’ through adequate measurement and legislation, such                   specifically, the emerging practices of infoveillance, to

         *
             Corresponding author: acrampton@csu.edu.au
© The Authors, published by EDP Sciences. This is an open access article distributed under the terms of the Creative Commons Attribution License 4.0
(http://creativecommons.org/licenses/by/4.0/).
E3S Web of Conferences 241, 03002 (2021) https://doi.org/10.1051/e3sconf/202124103002
ICEPP 2020
monitor a population’s response to a risk-posing situation. authorities and industries seeking to identify what
Typically, infoveillance is disease-related, however, in resources may need to be prioritised as the event
this research, its application is examined for a pollution progresses. In this analysis, the resource focus is two
event. consumer goods that demonstrate public interest in
During the summer of 2019/2020, Australia translating their air quality knowledge and perception of
experienced the worst bushfire season in modern memory. personal risk into health-mitigating actions, such as
The fires burnt more than 10 million hectares of land [9] further investigating or purchasing recommended
and smoke blanketed three states, with the country’s consumer goods (i.e., air purifiers or P2 masks). This
capital experiencing levels of harmful particulate ICT-mediated activity could be viewed as an increase in
pollution. On at least two occasions, the capital the level of individual health literacy from functional to
experienced some of the highest levels of air pollution in interactive as articulated by Nutbeam [20]. Although
the world, higher than more notorious regions such as assessing individual shifts from functional health literacy
Delhi and Beijing [10].The prolonged high levels of (risk-awareness) to interactive health literacy (risk-action)
particulate pollution from bushfire smoke contributed to lies beyond the scope of the present study, heightened
the deaths of 417 people and the hospitalisation of more consideration of Google Trends™ data may offer a more
than 4000 [11]. While bushfires and the purposeful informed opportunity to modify and adjust
burning of land designed to reduce bushfire intensity are communication actions demonstrated effective for raising
a norm in Australia, they do not normally cause such health literacy [21]. Methodologically, primary data
sustained levels of excessive particulate pollution across sourcing methods such as surveys and focus groups
large geographical areas. As the event unfolded, it typically used to obtain/assess public knowledge or
became apparent both the general population and health opinion are unlikely to be possible during emergency
authorities were underprepared to manage the physical events. Hence, infoveillance generally, and Google
and emotional impacts of this sustained pollution event. Trends™ data specifically, offers a timely and efficient
While sensitive populations may have some mechanism in crises events for officials and industries to
awareness of air pollution risks and measures to reduce better anticipate, and possibly attenuate, public panic
personal exposure, the majority of the population was, behaviour, such as panic consumer purchases resulting in
arguably, unaware of the risks posed by particulate matter shortages of essential products/services that, in part, may
pollution, how to interpret air quality information to reflect decreased science/health literacy than ‘real’ action
gauge personal risk, and/or ways to reduce personal needs.
pollution exposure. For many, their science/health
information deficit led them to the internet and, most
likely, to Google [12]. As a common port of call for 2 Methods
public health information [13-15], Google also has the Secondary data analysis was employed to answer three
capacity to serve as a rich source of information for those research questions:
that serve the community. Using Google Trends™, one 1.Did hazardous smoke events in three Australian
of the most popular tools for identifying relative internet states (New South Wales (NSW), Victoria (VIC), and the
search volumes (RSV) [16], it is possible to see changes Australian Capital Territory (ACT)) during the November,
in community search patterns during the course of an 2019-February, 2020 ‘Summer Bushfire Event’
event and thus note potential issues of common concern, precipitate changes in residents’ internet searches for the
including confusion. terms ‘air quality’, ‘air purifier’, or P2 ‘masks’?
The potential of Google Trends™ data to better equip 2. Did residents’ location affect their Google searches?
public health officials has been demonstrated for 3. Is there a relationship between measured/personally
influenza outbreaks in America [17], COVID-19 [16], experienced hazardous air quality and residents’ internet
and Dengue fever in Indonesia [18], where traditional search activity for these terms?
surveillance data has a 1-2 week lag, but internet trend Collectively, these questions contribute to the broader
data indicating public searching of symptoms and other research aim: to identify if conducting infoveillance
related concerns that can be reviewed daily. In this analysis of Google Trends™ data may alert public health
instance, internet trend data can help authorities improve authorities, and inform emergency response activities, of
resourcing to areas where area-specific health data is key science illiteracy areas and mitigation actions
unavailable to improve officials’ ability to respond more residents explored for an event (i.e., air pollution). To
accurately to demographic and agent-specific surveillance achieve this broader research aim, the research design
data. Google Trends™ data also has shown promise for investigated residents’ internet searching for terms
enhancing communication about new cancer screening provided in government health advice. Three hypotheses
tools by identifying changes in public internet searches were created and tested:
after the release of initial information [15]. ICT, as an i. Google Trends™ data will show increased search
information tool, also holds potential to inform Australian activity for emergency event-related terms when the
authorities of public concerns about pollution, as Google event reaches closer physical proximity to the public due
Trends™ data already has been used by tourism bodies in to (real or perceived) heightened risk.
China to assist with marketing tourism opportunities in ii. Government public health terminology
regions of potential concern to travellers [19]. recommendations will manifest in increased Google
If infoveillance is implemented at the beginning of a searches by residents.
major pollution event, results also could be informative to
2E3S Web of Conferences 241, 03002 (2021) https://doi.org/10.1051/e3sconf/202124103002
ICEPP 2020
iii. As ‘new’ locations experience ‘the event’, similar collection period terminating in mid-January, 2020. As a
Google searching behaviour will be revealed by Google control for AQI data, and to permit seasonal comparison
Trends™ data if wider health/science illiteracy remains with the 2019/2020 bushfire event, AQI summer
and/or public needs are similar. measurements also were collected for each location for
If these hypotheses are confirmed, then infoveillance the same dates in 2018-2019. Second, the ‘relative search
analysis may be possible to better predict public volume’ (RSV) from Google Trends™ data was extracted
science/health information and action-mitigating ‘needs’ for each search term, by research location and summer
before an emergency (i.e., bushfire, pandemic, etc.) timeline, into an Excel spreadsheet.
reaches new locations. Data analysis commenced by comparing the Google
Three Google search terms were chosen for this search data with the air quality data for each location and
investigation because of their alignment with the timeframe to test each hypothesis. Spearman Correlations
Australian Government’s general advice for decreasing were run, using the program R commander (version 2.5-
residents’ hazardous smoke exposure during a pollution 3), at 95% confidence intervals (CI). These methods align
event. The first search term was ‘air quality’ due to with Husnayain, Fuad, and Lazuardi’s (2019) comparison
Government advice that residents check official air of dengue cases and dengue-related Google searches,
quality measures to learn about ‘who’ should stay indoors Effenberg et al.’s (2020) research of COVID-19 cases
[22-25]. Second, ‘P2 masks’ was chosen because of and Google searches, and Schootman et al.’s (2014)
official advice that wearing a P2 mask reduces hazardous exploration of the relationship between Google searches
smoke exposure [22, 23, 25]. Selection of the third search for cancer screening and actual screening rates. Further,
term, ‘air purifier’, reflected Government advice, as Mavragani et al.’s (2018) review of Google Trends™
particularly for remote/rural residents, that purchasing air use in public health notes, correlation analysis is both a
purifiers for personal use may improve indoor air quality prevalent and suitable method for such secondary data
where residents lacked access to public spaces with analysis investigations.
commercial air conditioning [22, 24-25]. Additionally, a
control search term, ‘gloves’, was included to determine
if search patterns manifested by Google Trends™ for the 3 Results
tested search terms were unique, rather than reflecting a NSW was the first state to experience prolonged smoke
broader set of trends around personal protection actions exposure during the event, followed by VIC, and, lastly,
unrelated to air quality. The inclusion of a control term the ACT.
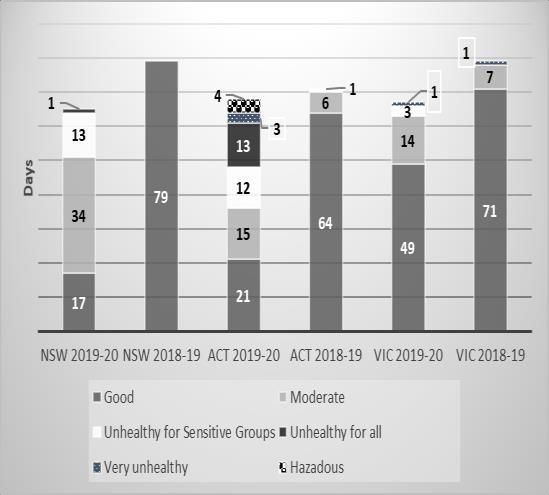
mirrors methods others have used to identify trends Fig. 1 shows AQI data for the control and event
relevant to a specific event, verses trends produced for periods to document, and externally validate, the event’s
other reasons [17]. severity in the three research locations. In NSW, PM2.5
The Google Trends™ data timeline was determined first exceeded an AQI of 50 for 2 consecutive days on 13
first by reviewing externally validated air quality data November 2019, with a reading of 113.5. Over the next
relative to small particulate matter (PM2.5) reported 2.5 months, there were only 15 days where NSW’s AQI
publicly on the www.apicn.org website for the central level for PM2.5 was below 51 and 18 days where levels
business districts (CBD) in the three research sites. exceeded 100. VIC experienced the least days of
PM2.5 poses a significant health hazard and is a core elevated PM2.5. For 8 days commencing 21 November
constituent of smoke measured by state environmental 2019, VIC recorded its first set of two days with an AQI
agencies as part of the Air Quality Index (AQI). AQI of PM2.5 above 50. VIC had fewer days of prolonged
PM2.5 levels between 100-150 are considered unhealthy hazardous smoke than ACT, with 17 days experiencing
for sensitive groups and >150 are unhealthy for everyone. PM2.5 levels above 50 during the 2 months that followed
Data collection entailed two steps. First, AQI data for the first event. Four of these days had a consecutive
VIC was drawn from the monitoring station for period where the PM2.5 AQI exceeded 100, including
Melbourne CBD. For NSW, the Point Cook reader one day with a peak of 272. The ACT experienced the
(closest to CBD) was sampled and for ACT, the Canberra longest period with hazardous air quality. ACT
Civic readings were used. The sampling timeframe (1 experienced its first two consecutive days where PM2.5
November 2019 – 25 January 2020) was chosen using exceeded 50 on the 9th and 10th of December 2019, with
two selection criteria: a. the sampling timeframe captured AQI values of 149 and 173 respectively.
when the AQI for PM2.5, according to the 2016 This was the beginning of an eight-day period where
American Environmental Protection Agency’s standard, AQI PM2.5 readings exceeded 90. Between 9 December
first exceeded 50, a level considered ‘moderate’, but 2019 and 6 February 2020, ACT residents experienced a
posing a health risk to sensitive groups, on two prolonged exposure to hazardous air quality, with only 6
consecutive days, across each research location; b. the days where PM2.5 levels dropped below 50 and 6 days
timeframe excluded the onset of the COVID-19 where it exceeded 200. Further, this pollution event
pandemic in Australia. This second criteria served as an resulted in several days of the ACT recording the highest
additional external validity measure by ensuring the air pollution levels in the world [10] at 549 on 2 January
behaviour manifested, public Google searching for P2 2019 and 714 on 6 January 2020.
masks, existed in relation to the research focus (the
Summer 2019/2020 Australian bushfire event) and not in
response to the emerging COVID-19 pandemic, despite
high PM2.5 pollution levels persisting beyond the data
3E3S Web of Conferences 241, 03002 (2021) https://doi.org/10.1051/e3sconf/202124103002
ICEPP 2020
In VIC, air purifier searches were slightly elevated
before the event, yet remained at a baseline level for that
term by not exceeding an RSV of 15 until several days of
exposure to PM2.5 above 50 (Fig. 4). Consistent with
NSW and ACT’s increased action-mitigation term
searching, VIC’s P2 mask and air purifier searching
aligned with heightened PM2.5, albeit occurred almost
simultaneously in December 2019 after multiple days of
prolonged PM2.5 exposure above 50. This finding lends
support to accept Hypothesis 3.
Increased (>15 RSV) searches for P2 masks and air
purifiers commenced several days after searches for air
quality and prolonged exposure to increased PM2.5 in
Fig. 1. Control/event comparison of PM2.5 by state. NSW and VIC (Fig. 2-3). In contrast, VIC residents
commenced internet searching for air purifiers prior to
Google Trends™ data for the three states (Fig. 2-4) searching for masks and air quality, as well as prior to
support Hypotheses 1-3, with some geographical physically experiencing the event (Fig. 4).
variation. Generally, as the event increased, demonstrated RSV of the two action-mitigating terms, P2 masks
by the AQI rise in PM2.5, residents in the corresponding and air purifies, by location and date further lends support
areas started internet searching for event-related terms, for Hypothesis 3, suggesting infoveillance may serve a
evidencing support for Hypothesis 1. Specifically, useful predictive capacity for identifying public health
searches for ‘air quality’ and mitigating actions aligned literacy and goods/action needs in locations about to
with Government advice, utilisation of ‘P2 masks’ and experience the same, or similar, event. Fig. 5-6 illustrate
‘air purifiers’. This finding lends support to accept search trends for air purifiers and masks in each state not
Hypothesis 2. An anomaly, however, becomes visible only generally followed periods of increased PM2.5, they
when these states are compared. In NSW, increased also exhibited similar science literacy/action needs across
PM2.5 initially did not yield high RSV for any event- locations. If infoveillance was conducted when the first
related term. RSV alignment between poor AQI and state (NSW) experienced the event (early December
increased internet searching occurred mid-December 2019), then officials would have been able to anticipate
2019 for the three search terms investigated (Fig. 2). In future locations’ science literacy/action needs for air
contrast, VIC and ACT Google Trend data showed closer purifiers and P2 masks (i.e., ACT and VIC mid-
alignment between event exposure and increased event- December 2019 – January 2020) and additional NSW
related RSV (Fig. 3-4). needs in the ‘second’ peak event (January 2020).
Fig. 2. NSW Comparison PM2.5/ Google Trends™ RSV.
Fig. 4. VIC Comparison PM2.5/ Google Trends™ RSV.
Fig. 3. ACT Comparison PM2.5/ Google Trends™ RSV.
4E3S Web of Conferences 241, 03002 (2021) https://doi.org/10.1051/e3sconf/202124103002
ICEPP 2020
Fig. 5. Air Purifier Google Trends™ RSV by state and event timeline.
Fig. 6. P2 Mask Google Trends™ RSV by state and event timeline.
In contrast, the control term ‘gloves’ failed to display trends with the event (Fig. 7) or achieve statistical significance
(Table 1).
Fig. 7. Gloves RSV by state and event timeline.
Table 1. AQI and RSV CORRELATIONS BY STATE AND TIME.
Infoveillance trends observed were attributed to
changes in observed air quality, not another seasonal RSV/Year ACT NSW VIC
event. Table 1 shows Google Trends™ data for air r r r
quality and air purifier significantly correlated to Gloves
measured air quality during the event (n=86 days, 2018-2019 0.06 -0.2 0.003
2019-2020 -0.2 0.1 -0.2
Summer 2019-2020) and not the control period (n=86 Air purifier
days, Summer 2018-2019). A significant Spearman’s 2018-2019 -0.07 0.2 0.02
correlation only emerged for P2 masks in one location 2019-2020 0.7* 0.5* 0.5*
(the ACT) and the control term ‘gloves’ was not Air quality
correlated with measured air quality. 2018-2019 -0.07 0.02 -0.02
2019-2020 0.8* 0.5* 0.5*
P2 mask
2018 – 2019 -0.2 0.02 -0.09
2019 - 2020 0.6* 0.4 0.3
RSV – relative search volume; *p < 0.001 with 95% CI two sided
5E3S Web of Conferences 241, 03002 (2021) https://doi.org/10.1051/e3sconf/202124103002
ICEPP 2020
4 Discussion information available about its risk mitigation and long
term impacts [3]. Infoveillance may, in part, offer an
This infoveillance analysis showed Google Trends™ data accessible and practical approach to identifying public
has capacity to reveal, and anticipate, meaningful public health information and action needs surpassing interest
science literacy/action-needs patterns in response to the groups and/or intensive research-access restrictions,
localised experience of emergency events. All three states producing ‘snapshots’ of time and place specific
followed similar public information searching trajectories conditions that may both serve local needs and offer
as each experienced relative to changes in local air valuable insights from comparative analysis.
quality. This occurred due to the progressive movement In the most recent analysis of air quality monitoring
of an emergency event, the 2019-2020 Australian and reporting in an Australian context, the chief auditor
summer bushfire. The commonality of internet search of Victoria was highly critical of the paucity of
activity highlights that once an emergency event starts, information available to Victorian residents specifically
authorities and businesses in neighbouring areas may regarding their air quality, noting this predicament was
benefit from conducting infoveillance analysis as a due to a combination of issues from insufficient
preparatory activity. Compared with primary data monitoring across the state to the inadequate quality
collection methods, such as surveys or interviews, control of data and selective reporting [4]. While such
infoveillance offers an efficient, and arguably accurate, gaps in information provision require addressing as part
data source to assess public science/health literacy and of a broader campaign to enhance residents’ health
resource needs, including consumer demand for literacy in association with scientific air quality
emergency response products in subsequent locations. monitoring and action-recommendations, enhancing
Increased local PM2.5 levels not only aligned with public science and health literacy must be accompanied
increased local internet searching for air quality by improved air quality monitoring in rural and remote
information, Google Trends™ data revealed those not yet locations in Australia; encouraging and empowering the
affected by the event in nearby locations, such as VIC, public to review and assess personal
commenced searching about air quality and air purifiers health/environmental risks requires reliable and able data
as neighbouring areas (i.e., NSW) were impacted by which, presently, neither equally nor accurately exists for
smoke. For all states, the increased level of interest in air all Australian residents/citizens since monitoring
purifiers was maintained during their period of elevated availability remains contingent upon location’s
PM2.5. In this event, consumer interest outpaced population size [4].
industry’s capacity to supply air purifiers, with suppliers
in each state progressively reporting shortages [26]. Had
authorities and/or consumer product suppliers in ACT 5 Conclusions
and VIC conducted infoveillance analysis by using
Google Trends™ data to identify what NSW residents Nevertheless, by using Google Trends™ in a manner that
were searching for - to augment their science/health is becoming increasingly common in epidemiological
literacy and locate event-mitigating action needs in studies of human disease utilised in the emerging field of
response to increased PM2.5 levels and external infodemiology through infoveillance [2], this
indicators (i.e. increased smoke and media reporting of investigation surpasses traditional epidemiology, which
fires spreading across geographic locations) - then it may focuses on infectious agents, by exploring how
have been possible to better predict the likely increased individuals use and action government-recommended
demand for Government-recommended items. Pre- information to guide personal response to a pollution-
emptive infoveillance analysis may be particularly useful initiated risk during an emergency event. Infoveillance,
to ensure there is a reserve of vital emergency resources made possible by the increased digitalisation of society,
for the most vulnerable populations (i.e. air purifiers and offers scope for ICT to inform official and community
P2 masks for those with pre-existing respiratory disease, response to environmental pollution events with sizable
those in remote locations, etc.) by securing supply ahead health costs. The event analysed in this study impacted
of consumer demand. Likewise, infoveillance may assist thousands of individuals over several months across three
in managing other pollution/disaster events with states, leaving individuals and businesses unprepared and
predicted geographical changes in distribution (i.e. floods, ill protected. Analytically, however, it offers an exemplar
water-based pollution from a point source, pest plagues, of how infoveillance – as a concept and method - may be
etc.). applicable across academic disciplines and applied areas
In addition to lending evidence that Google Trends™ of specialisation, such as the growing field of pollution
data has a valuable place in active disaster information control management [27]. Any ‘event’ or issue involving
management of resource and information provision, public/community interaction with ICT related to risks,
findings indicate infoveillance can be useful for including risks to government/corporate reputation, may
measuring and/or addressing community science/health indeed benefit from monitoring avenues where
literacy deficits. Air pollution awareness and individual misinformation and/or lack of information can yield
capacity to act, relative to official information provided, deleterious consequences.
are issues traversing health literacy and environmental
literacy fields [3]. American research has noted
inconsistency in how air pollution information is
provided, as well as the general lack of appropriate
6E3S Web of Conferences 241, 03002 (2021) https://doi.org/10.1051/e3sconf/202124103002
ICEPP 2020
References 26. G. Carey, Health Promot. J. Austr. 31, 5, 2020.
27. P.B. Meyer, T.S. Lyons, T.L. Clapp, Projecting
1.K. Balakrishnan, S. Dey, T. Gupta, R.S. Dhaliwal, M. environmental trends from economic forecasts.
Brauer, A.J. Cohen, J.D. Stanaway, G. Beig, T.K. Routledge, UK, 2017.
Joshi, A. N. Aggarwal. Lancet Planet. Health, 3, e26,
2019.
2. G. Eysenbach, J Med Internet Res, 11, p. e11, 2009
3. A.S. Ramírez, S. Ramondt, K. Van Bogart, R. Perez-
Zuniga. J. Health Commun. 24, 75, 2019.
4. Victorian Auditor General, Improving Victoria's Air
Quality. 2018.
5. Australian Government Department of the
Environment and Energy National Clean Air
Agreement. 2019.
6. Victorian Department of Health and Human Services.
Coronavirus (COVID-19) daily update. 2020.
7. A. Greenbank, @abcnews. January 14, 2020.
8. World Health Organisation, Ambient air pollution: A
global assessment of exposure and burden of disease.
2016.
9. CSIRO, The 2019-20 bushfires: a CSIRO explainer.
2020.
10. A. Remeikis, The Guardian. January 3, 2020.
11. A.N. Borchers, A.J. Palmer, D.M.J.S. Bowman, G.G.
Morgan, B.B. Jaludin, F.H. Johnston, Med. J. Aust.
(in press). 2020.
12. Statcounter. Search engine market share Australia
May 2019-May 2020.
13. A. Crampton, A.T. Ragusa, Rural Soc. 18, 202, 2008.
14. A. Mavragani, G. Ochoa, K.P. Tsagarakis. J. Medical
Internet Res. 20, 2018.
15. M. Schootman, A. Toor, P. Cavazos-Rehg, D.B. Jeffe,
A. McQueen, J. Eberth, N.O. Davidson. BMJ Open.
5, e006678, 2015.
16. M. Effenberger, A. Kronbichler, J.I. Shin, G. Mayer,
H. Tilg, P. Perco. Int. J. Infect. Dis. 95, 192, 2020.
17. J. Ginsberg, M.H. Mohebbi, R.S. Patel, L. Brammer,
M.S. Smolinski, L. Brilliant. Nature. 457, 1012, 2009.
18. A. Husnayain, A. Fuad, L. Lazuardi. Glob. Health
Action. 12, 1552652, 2019.
19. X. Xu, M. Reed, Perceived pollution and inbound
tourism in China. Tour. Manag. Perspect. 21, 109,
2017.
20. D. Nutbeam, Health Promot. Int. 15, 259, 2000.
21. D. Nutbeam, B. McGill, P. Premkumar. Health
Promot. Int. 33, 901, 2018.
22. ACT Government. Heavy smoke and hot conditions
in ACT. 2020.
23. NSW Government. P2 Masks. 2020
24. NSW Health. Steps to decrease risk from bushfire
smoke. 2019.
25. Victoria State Government. Bushfire - guidelines on
use of facemasks. 2020.
7You can also read