AIR QUALITY MONITORING REPORT - Walker Buckland Park Developments Pty Ltd Stage 7 - Riverlea Park - SA Planning ...
←
→
Page content transcription
If your browser does not render page correctly, please read the page content below
12 Greenhill Road
                                                                                                   Wayville SA 5034
                                                                                                             Australia
                                                                                                   T: (08) 8299 9955

AIR QUALITY MONITORING
REPORT

                                                                                              August 2021
                                                                                                 J169796

Walker Buckland Park
Developments Pty Ltd

Stage 7 - Riverlea Park

greencap.com.au                                                                    ABN 76 006 318 010

Adelaide | Auckland | Brisbane | Canberra | Darwin | Melbourne | Newcastle | Perth | Sydney | Wollongong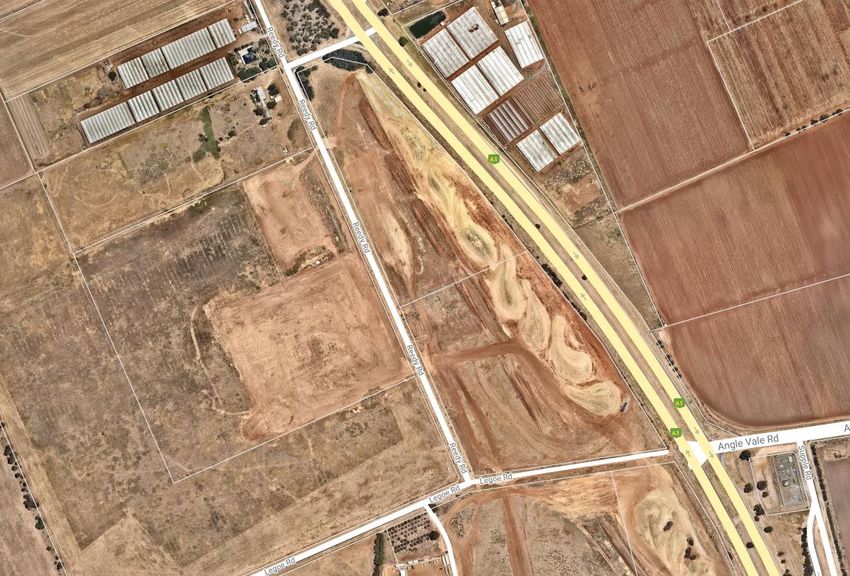
Statements of Limitation

All and any Services proposed by Greencap to the Client were subject to the Terms and Conditions listed on the Greencap website at:
https://www.greencap.com.au/terms-conditions Unless otherwise expressly agreed to in writing and signed by Greencap, Greencap
does not agree to any alternative terms or variation of these terms if subsequently proposed by the Client. The Services were carried
out in accordance with the current and relevant industry standards of testing, interpretation and analysis. The Services were carried
out in accordance with Commonwealth, State, Territory or Government legislation, regulations and/or guidelines. The Client was
deemed to have accepted these Terms when the Client signed the Proposal (where indicated) or when the Company commenced the
Services at the request (written or otherwise) of the Client.
The services were carried out for the Specific Purpose, outlined in the body of the Proposal. To the fullest extent permitted by law,
Greencap, its related bodies corporate, its officers, consultants, employees and agents assume no liability, and will not be liable to any
person, or in relation to, any losses, damages, costs or expenses, and whether arising in contract, tort including negligence, under
statute, in equity or otherwise, arising out of, or in connection with, any matter outside the Specific Purpose.
The Client acknowledged and agreed that proposed investigations were to rely on information provided to Greencap by the Client or
other third parties. Greencap made no representation or warranty regarding the completeness or accuracy of any descriptions or
conclusions based on information supplied to it by the Client, its employees or other third parties during provision of the Services. Under
no circumstances shall Greencap have any liability for, or in relation to, any work, reports, information, plans, designs, or specifications
supplied or prepared by any third party, including any third party recommended by Greencap. The Client releases and indemnifies
Greencap from and against all Claims arising from errors, omissions or inaccuracies in documents or other information provided to
Greencap by the Client, its employees or other third parties.
The Client was to ensure that Greencap had access to all information, sites and buildings as required by or necessary for Greencap to
undertake the Services. Notwithstanding any other provision in these Terms, Greencap will have no liability to the Client or any third
party to the extent that the performance of the Services was not able to be undertaken (in whole or in part) due to access to any
relevant sites or buildings being prevented or delayed due to the Client or their respective employees or contractors expressing safety or
health concerns associated with such access.
Unless otherwise expressly agreed to in writing and signed by Greencap, Greencap, its related bodies corporate, its officers, employees
and agents assume no liability and will not be liable for lost profit, revenue, production, contract, opportunity, loss arising from business
interruption or delay, indirect or consequential loss or loss to the extent caused or contributed to by the Client or third parties, suffered
or incurred arising out of or in connection with our Proposals, Reports, the Project or the Agreement. In the event Greencap is found by
a Court or Tribunal to be liable to the Client for any loss or damage arising in connection with the Services, the Client's entitlement to
recover damages from Greencap shall be reduced by such amount as reflects the extent to which any act, default, omission or
negligence of the Client, or any third party, caused or contributed to such loss or damage. Unless otherwise agreed in writing and signed
by both parties, Greencap’s total aggregate liability will not exceed the total consulting fees paid by the client in relation to this
Proposal. For further detail, see Greencap’s Terms and Conditions available at https://www.greencap.com.au/terms-conditions
The Report is provided for the exclusive use of the Client and for this Project only, in accordance with the Scope and Specific Purpose
as outlined in the Agreement, and only those third parties who have been authorized in writing by Greencap. It should not be used for
other purposes, other projects or by a third party unless otherwise agreed and authorized in writing by Greencap. Any person relying
upon this Report beyond its exclusive use and Specific Purpose, and without the express written consent of Greencap, does so entirely
at their own risk and without recourse to Greencap for any loss, liability or damage. To the extent permitted by law, Greencap assumes
no responsibility for any loss, liability, damage, costs or expenses arising from interpretations or conclusions made by others, or use of
the Report by a third party. Except as specifically agreed by Greencap in writing, it does not authorize the use of this Report by any
third party. It is the responsibility of third parties to independently make inquiries or seek advice in relation to their particular
requirements and proposed use of the site.
The conclusions, or data referred to in this Report, should not be used as part of a specification for a project without review and written
agreement by Greencap. This Report has been written as advice and opinion, rather than with the purpose of specifying instructions for
design or redevelopment. Greencap does not purport to recommend or induce a decision to make (or not make) any purchase, disposal,
investment, divestment, financial commitment or otherwise in relation to the site it investigated.
This Report should be read in whole and should not be copied in part or altered. The Report as a whole set outs the findings of the
investigations. No responsibility is accepted by Greencap for use of parts of the Report in the absence (or out of context) of the
balance of the Report.

                                                                                                                  greencap.com.au

   Adelaide | Auckland | Brisbane | Canberra | Darwin | Melbourne | Newcastle | Perth | Sydney | Wollongong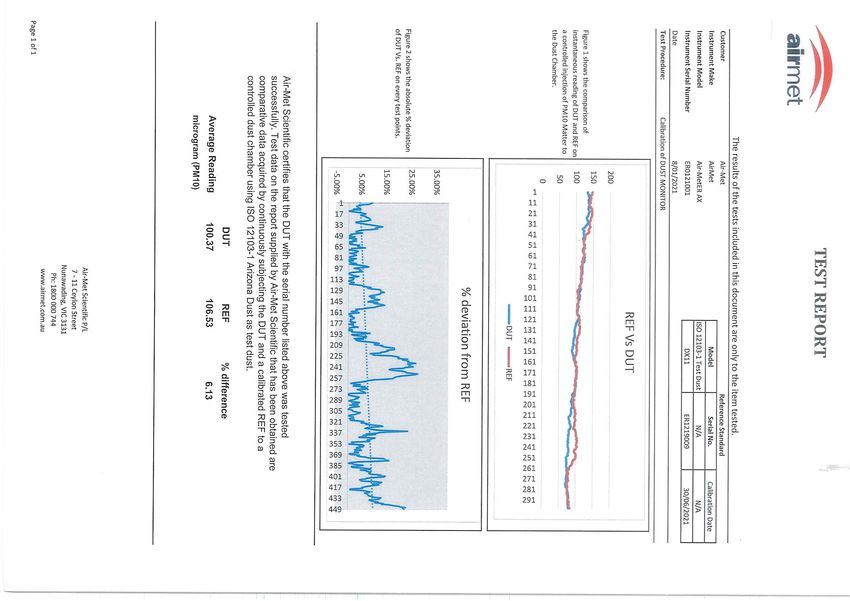
August 2021

Document Control

 Document Quality Management Details
 Report Name:                    Air Quality Monitoring Report
 Site Details:                   Stage 7 - Riverlea Park
                                 J169796
 Project Number:

 Client Name:                    Walker Buckland Park Developments Pty Ltd
                                 Prepared By:                             Authorised By:

 Signatures:
                                 Marina Sarunic
                                                                          Dylan Burford
                                 Senior Environmental
                                                                          Practice Manager – Environmental &
                                 Scientist
                                                                          Contaminated Land Management

Issue Status
  Version No.                Date                             Creator                         Reviewer

       1                 16/02/2021                      Marina Sarunic                     Dylan Burford
       2                 11/08/2021                       Dylan Burford                    Nick Waniarcha

Document Circulation
    Version                  Type                            Company                           Contact

       1                    Digital                  Walker Buckland Park                    Ben Moore
                                                     Developments Pty Ltd

J169796 Stage 7 Riverlea Park - Air Quality Monitoring Report (Aug2021)                                        II
                                                                               greencap.com.au
  Adelaide | Auckland | Brisbane | Canberra | Darwin | Melbourne | Perth | Sydney | Wollongong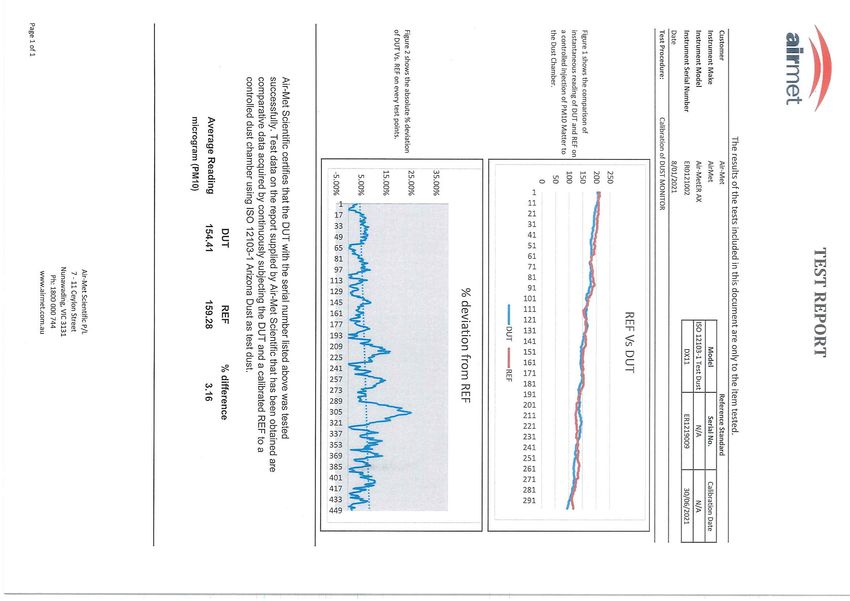
August 2021

Air Quality Monitoring Report
Walker Buckland Park Developments Pty Ltd
Stage 7 - Riverlea Park

Table of Contents
1      INTRODUCTION........................................................................................................................... 1
       1.1 Background....................................................................................................................... 1
       1.2 Scope of Work .................................................................................................................. 1
       1.3 Relevant Guidelines and Policies ..................................................................................... 1
2      SITE DESCRIPTION ....................................................................................................................... 2
       2.1 Site Location ..................................................................................................................... 2
       2.2 Proposed Development ................................................................................................... 2
3      AIR MONITORING ....................................................................................................................... 3
       3.1 Monitoring Locations ....................................................................................................... 3
       3.2 Monitoring Methodology ................................................................................................ 3
       3.3 Air Quality Criteria............................................................................................................ 4
       3.4 Wind Direction and Speed Data ...................................................................................... 5
       3.5 Results .............................................................................................................................. 6
4      PLANNING AND DESIGN CODE CONSIDERATION .................................................................... 13
5      CONCLUSION............................................................................................................................. 15
Appendix A: Proposed Development Plan
Appendix B: Calibration Certificates and Unit Specifications
Appendix C: Weather Observations

J169796 Stage 7 Riverlea Park - Air Quality Monitoring Report (Aug2021)                                                                               III
                                                                                 greencap.com.au
    Adelaide | Auckland | Brisbane | Canberra | Darwin | Melbourne | Perth | Sydney | Wollongong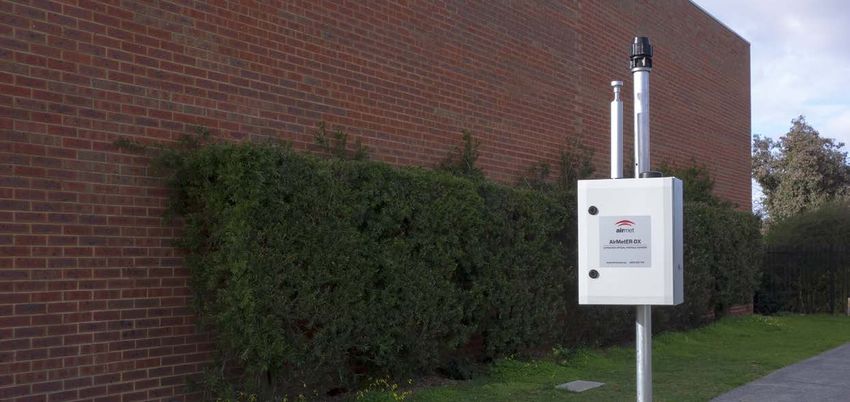
August 2021

1       INTRODUCTION
1.1     Background
Greencap Pty Ltd (Greencap) was commissioned by Walker Buckland Park Developments Pty Ltd to provide
environmental monitoring for the site located on the corner of Legoe and Reedy Roads, Buckland Park, South
Australia (referred to as Stage 7 Riverlea Park).
It is understood that due to the site’s close proximity to Port Wakefield Road, the SA EPA has requested
additional information relating to exhaust emissions from nearby traffic and its potential to affect the health
of future residents of Stage 7.
The purpose of the monitoring was to monitor the air quality levels (including dust and ambient gas) over a
typical one-week period at the site to provide indicative condition of air quality.

1.2     Scope of Work
The scope of work for this assessment is as follows:
    •   Environmental monitoring, specific to dust and emissions as follows:
             o Two fixed monitoring locations.
             o Data processing and review.
             o Comparison against applicable guidelines.
    •   Review of performance objectives in the revised Planning and Design Code Noise and Air Emissions
        Overlay.

1.3     Relevant Guidelines and Policies
This report has been prepared with reference to industry standard and guidelines including the National
Environment Protection (Ambient Air Quality) Measure (December 2015).
It is noted that the monitoring program was limited and is intended to provide levels over a typical one-week
period at the site.
The Planning and Design Code Noise and Air Emissions Overlay has also been considered with regards to the
proposed site development.

J169796 Stage 7 Riverlea Park - Air Quality Monitoring Report (Aug2021)                                      1
                                                                                 greencap.com.au
    Adelaide | Auckland | Brisbane | Canberra | Darwin | Melbourne | Perth | Sydney | Wollongong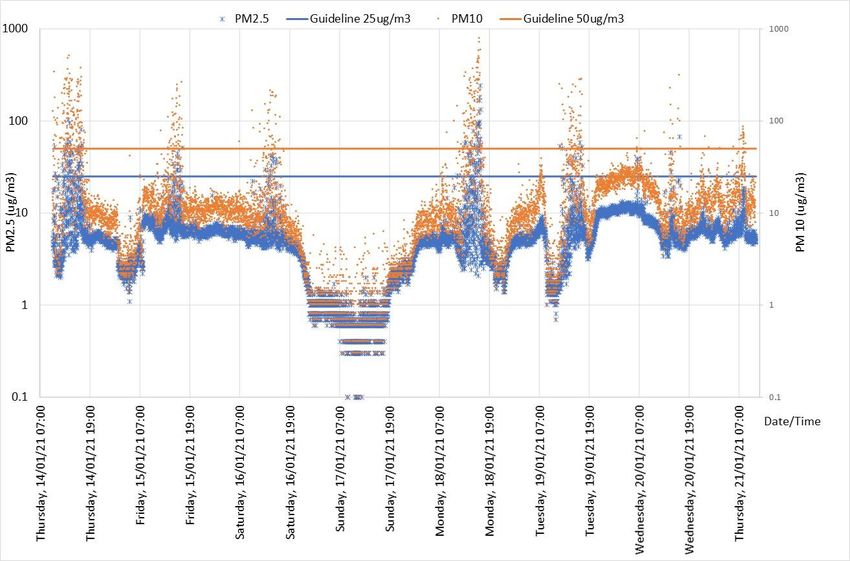
August 2021

2     SITE DESCRIPTION
2.1    Site Location
The Stage 7 Riverlea Park site is located in Buckland Park, South Australia, approximately 30 kilometres north
of the Adelaide CBD. The site is situated in an agricultural area. The site is bound by Port Wakefield Road to
the east, Legoe Road to the south and Reedy Road to the west.
The location of the site is provided in Figure 1.

                                                                                                 Approx
                                                                                                 North

                                                                          Approx. Stage 7 Site
                                                                              Boundary

                                    Figure 1 – Site Location (source: www.whereis.com)

2.2    Proposed Development
The Stage 7 Riverlea Park development comprises approximately 20 hectares of land. The site is proposed
to include 168 allotments along with large open space areas in the eastern and southern portions of the
Stage 7 site.
The proposed development plan is presented in Appendix A.
The site is currently zoned in a Suburban Activity Centre Zone and Walker Corporation seeks to rezone to
Master Planned Neighbourhood Zone.

J169796 Stage 7 Riverlea Park - Air Quality Monitoring Report (Aug2021)                                     2
                                                                                 greencap.com.au
    Adelaide | Auckland | Brisbane | Canberra | Darwin | Melbourne | Perth | Sydney | Wollongong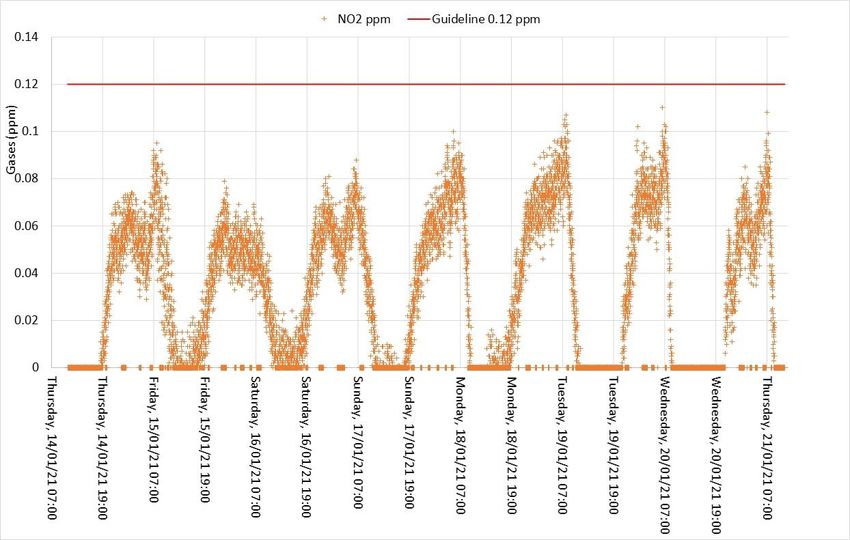
August 2021

3       AIR MONITORING
3.1       Monitoring Locations
Two monitoring units were placed approximately 90 metres west of Port Wakefield Road along the eastern
boundary of the proposed Stage 7 residential development. Location 1 was placed in the northern portion
of the site and Location 2 in the southern portion, to allow adequate coverage of Port Wakefield Road.
Monitoring locations are presented in Figure 2.
Given the area directly adjacent Port Wakefield Road is proposed to be open space, air monitoring was not
conducted in this area. Figure 2 presents the monitoring locations.

                 Proposed Residential area

                                                         1
                                                                                        Balance Allotment 2500
        Approx. Site Boundary

                                                                     2

            Proposed Reserves

                    Figure 2 – Monitoring Locations (not to scale, background image source: Nearmap)

3.2       Monitoring Methodology
Continuous air monitoring was conducted using Airmeter-AX units to monitor:
    •     Carbon monoxide (CO)
    •     Nitrogen dioxide (NO2)
    •     Ozone (O3)
    •     Sulfur Dioxide (SO2)
    •     Volatile Organic Compounds (VOC)
    •     Dust particulate matter as PM2.5 and PM10

J169796 Stage 7 Riverlea Park - Air Quality Monitoring Report (Aug2021)                                          3
                                                                                 greencap.com.au
    Adelaide | Auckland | Brisbane | Canberra | Darwin | Melbourne | Perth | Sydney | Wollongong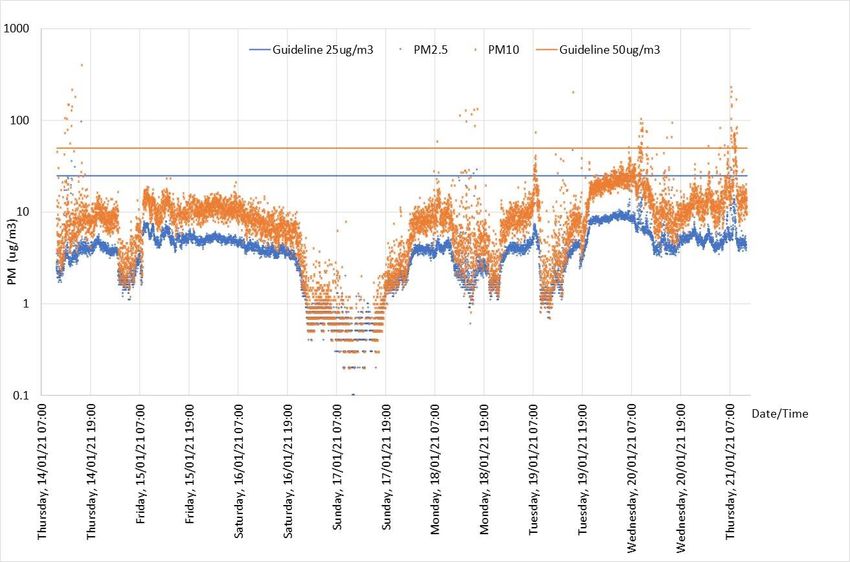
August 2021
The monitors ran for 1 week, from 14 January 2021 to 21 January 2021. Air quality data was logged at one-
minute intervals. It is noted that lead monitoring was not undertaken as it requires a longer period of
monitoring (averaging period is 1 year). The SA EPA undertakes air quality monitoring in metropolitan
Adelaide. The SA EPA website states that ‘lead is not used in this assessment of recent air quality, so if the
air quality at Oliver Street in Port Pirie is described as very good for example, this is in terms of particles and
sulfur dioxide only’.
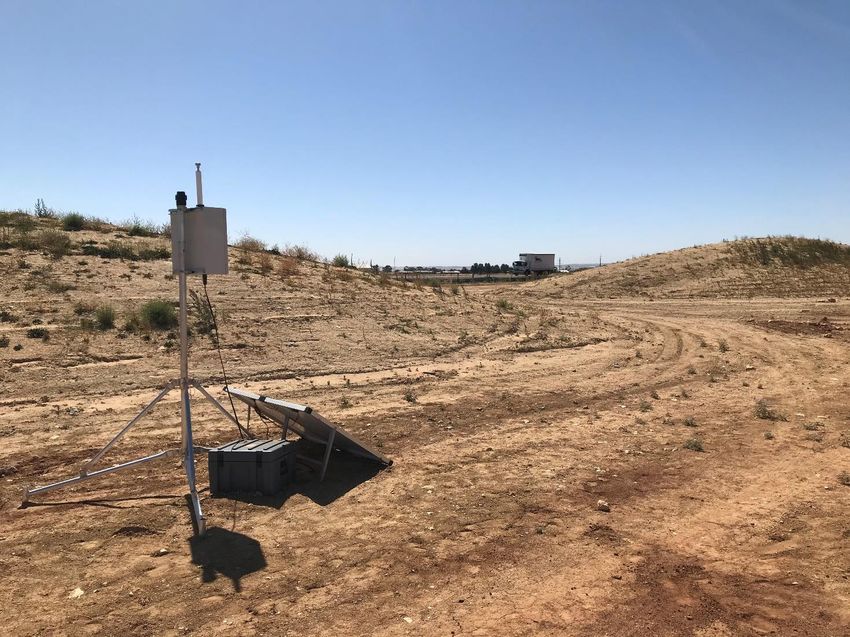
Calibration certificates and specifications for the units are presented in Appendix B. Photograph 1 shows
the typical set-up of the monitoring units.
Port Wakefield Road
Monitoring Location 2
Photograph 1 – View facing east at Monitoring Location 2 (14 January 2021)
3.3 Air Quality Criteria
Air monitoring results were compared with the Standards for Pollutants, as detailed in Table 1 of Schedule 2
of the National Environment Protection (Ambient Air Quality) Measure, 2016. The criteria are presented in
Table 1 below.
J169796 Stage 7 Riverlea Park - Air Quality Monitoring Report (Aug2021) 4
greencap.com.au
Adelaide | Auckland | Brisbane | Canberra | Darwin | Melbourne | Perth | Sydney | Wollongong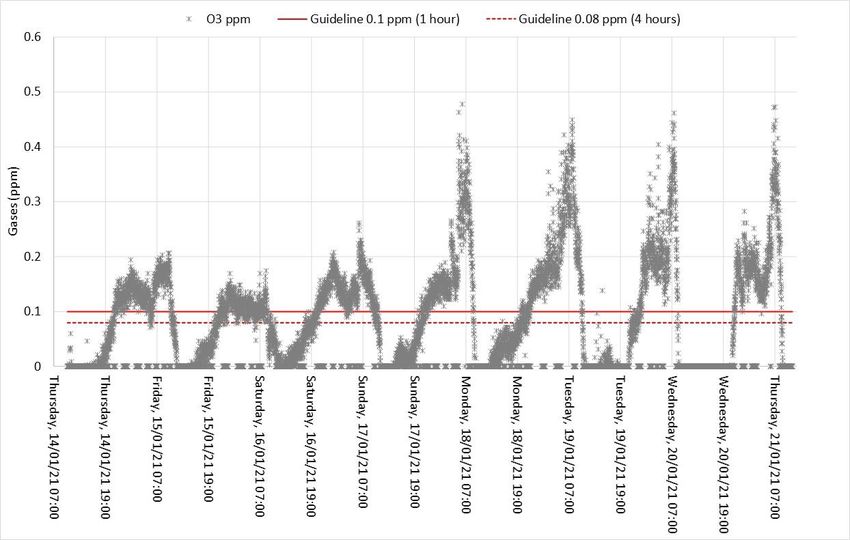
August 2021

                                           Table 1 – Air Quality Criteria Values
                                                                                           Guideline Criteria - National
 Pollutant                                           Averaging Period                   Environment (Ambient Air Quality)
                                                                                               Protection Measure
 Emissions
 Carbon Monoxide                                           8 hours                                   9.0 ppm
                                                           1 hour                                    0.12 ppm
 Nitrogen Dioxide
                                                           1 year                                    0.03ppm
                                                           1 hour                                    0.10 ppm
 Photochemical Oxidants (Ozone)
                                                           1 year                                      0.08
                                                           1 hour                                    0.20 ppm
 Sulfur dioxide                                             1 day                                    0.08 ppm
                                                           1 year                                    0.02 ppm
 Dust
                                                            1 day                                    50 ug/m3
 PM10
                                                           1 year                                    25 ug/m3
                                                            1 day                                    25 ug/m3
 PM2.5
                                                           1 year                                     8 ug/m3

3.4      Wind Direction and Speed Data
Historic wind direction and speed data has been sourced from the Bureau of Meteorology. Observations
were drawn from the nearest bureau station (023083) at Edinburgh RAAF located approximately 9 kilometres
south east of the site, see Appendix C. Data is indicative of average conditions and is summarised in Table
2.

               Table 2 – Long Term Wind Speed and Direction Data – Statistics for January 2021
 Measurement Time            Mean Wind Speed (km/hr)                               Direction Observations
                                                                     •    Generally well distributed, slight predominance
                                                                          from north and north east
 9am                                      14
                                                                     •    Typically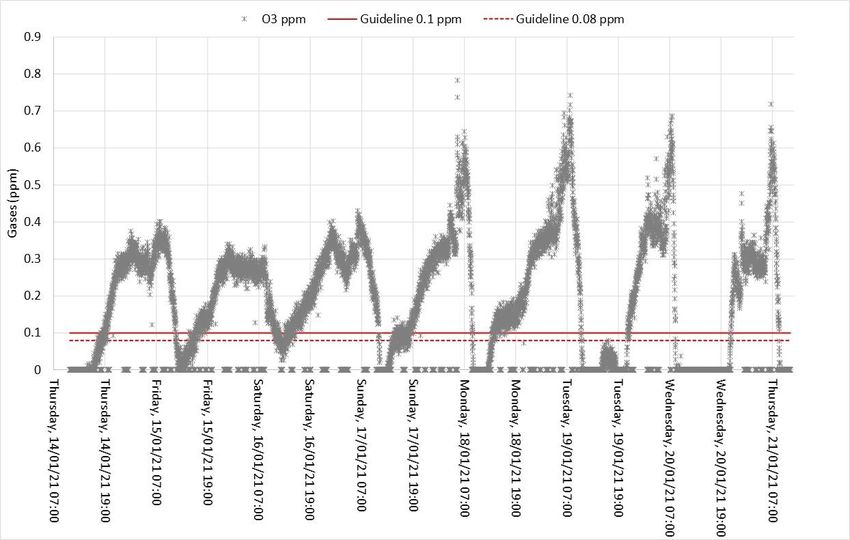
August 2021

3.5     Results
3.5.1     Dust
The 24-hour average recorded concentrations are presented in Table 3. The table shows that the reported
averages for each day were all below the adopted criteria for both PM2.5 (25 ug/m3) and PM10 (50 ug/m3).
                                   Table 3 – Average Dust Results (24 Hour Period)
                                              Location 1                             Location 2
            Date               24hr Average             24hr Average      24hr Average        24hr Average
                                  (PM2.5)                  (PM10)            (PM2.5)             (PM10)
      Guideline Criteria              25                      50              25                   50
         15/01/2021                  7.16                     25              3.85                9.13
         16/01/2021                  7.06                   15.69             4.97                10.56
         17/01/2021                  3.54                    8.60             2.13                4.17
         18/01/2021                  2.62                    5.43             2.43                5.53
         19/01/2021                  7.38                   26.65             3.00                7.45
         20/01/2021                  8.35                   22.06             6.26                16.04
         21/01/2021                  6.56                   15.89             5.32                15.34

It is noted that a number of isolated spikes were reported for PM2.5 and PM10 (refer to Figures 3 and 4) for
both Locations 1 and 2 exceeding the adopted criteria (for a 24-hour period). A Greencap field engineer
noted site works on the adjacent site which included the movement of soils using site machinery and plant
equipment. The spikes appeared to coincide with these works.

J169796 Stage 7 Riverlea Park - Air Quality Monitoring Report (Aug2021)                                      6
                                                                               greencap.com.au
  Adelaide | Auckland | Brisbane | Canberra | Darwin | Melbourne | Perth | Sydney | Wollongong
August 2021
Figure 3 – PM10 & PM2.5 (Location 1)
Figure 4 – PM10 & PM2.5 (Location 2)
J169796 Stage 7 Riverlea Park - Air Quality Monitoring Report (Aug2021) 7
greencap.com.au
Adelaide | Auckland | Brisbane | Canberra | Darwin | Melbourne | Perth | Sydney | WollongongAugust 2021
3.5.2 Carbon Monoxide
Locations 1 and 2 reported carbon monoxide results well below the adopted criteria of 9 ppm for an
averaging period of 8 hours (refer Figures 5 and 6).
Figure 5 – Carbon Monoxide (Location 1)
Figure 6 – Carbon Monoxide (Location 2)
J169796 Stage 7 Riverlea Park - Air Quality Monitoring Report (Aug2021) 8
greencap.com.au
Adelaide | Auckland | Brisbane | Canberra | Darwin | Melbourne | Perth | Sydney | WollongongAugust 2021
3.5.3 Nitrogen Dioxide
Locations 1 and 2 reported nitrogen dioxide results well below the adopted criteria of 0.12 ppm for an
averaging period of 1 hour (refer Figures 7 and 8).
Figure 7 – Nitrogen Dioxide (Location 1)
Figure 8 – Nitrogen Dioxide (Location 2)
J169796 Stage 7 Riverlea Park - Air Quality Monitoring Report (Aug2021) 9
greencap.com.au
Adelaide | Auckland | Brisbane | Canberra | Darwin | Melbourne | Perth | Sydney | WollongongAugust 2021
3.5.4 Sulfur Dioxide
Locations 1 and 2 reported sulfur dioxide results generally below the adopted criteria of 0.2ppm for an
averaging period of 1 hour and 0.08ppm for an average period of 1 day (refer Figures 9 and 10).
Spikes exceeding the adopted criteria were noted on 14, 20 and 21 January 2021 at Locations 1 and 2. It is
noted that these spikes coincide with the mobilisation (14 January 2021) and demobilisation (21 January
2021) of the monitors, where air-conditioned vehicles were left running near the units. Similarly, a Greencap
engineer inspected the units on Wednesday 20 January 2021, with the running vehicle likely to have caused
the spike at this time.
Figure 9 – Sulfur Dioxide (Location 1)
Figure 10 – Sulfur Dioxide (Location 2)
J169796 Stage 7 Riverlea Park - Air Quality Monitoring Report (Aug2021) 10
greencap.com.au
Adelaide | Auckland | Brisbane | Canberra | Darwin | Melbourne | Perth | Sydney | WollongongAugust 2021
3.5.5 Volatile Organic Compounds
VOC concentrations were measured at 0ppb for locations 1 and 2 during the entire monitoring period, with
the exception of some spikes measured on 14 January 2021 (refer Figures 11 and 12). These appear to
coincide with the set-up time / mobilisation of the monitors where a running vehicle next to the monitors is
likely to have caused the spike. It is noted there is no criteria for VOCs listed in the National Environment
Protection (Ambient Air Quality) Measure, 2016.
Figure 11 – VOC (Location 1)
Figure 12 – VOC (Location 2)
J169796 Stage 7 Riverlea Park - Air Quality Monitoring Report (Aug2021) 11
greencap.com.au
Adelaide | Auckland | Brisbane | Canberra | Darwin | Melbourne | Perth | Sydney | WollongongAugust 2021
3.5.6 Ozone
Locations 1 and 2 reported elevated ozone results exceeding the adopted criteria (refer Figures 13 and 14)
generally from 19:00 to 07:00, during off-peak traffic times. Typically, ozone levels are most likely to be
elevated after noon through to early evening, as a result of vehicle traffic emissions reacting in the presence
of sunlight. It is noted the ozone results reported at the site were elevated much later than this.
Figure 13 – Ozone (Location 1)
Figure 14 – Ozone (Location 2)
J169796 Stage 7 Riverlea Park - Air Quality Monitoring Report (Aug2021) 12
greencap.com.au
Adelaide | Auckland | Brisbane | Canberra | Darwin | Melbourne | Perth | Sydney | WollongongAugust 2021
4 PLANNING AND DESIGN CODE CONSIDERATION
Tables 4, 5 and 6 present a review of the Assessment Provisions within the Planning and Design Code Noise
and Emissions Overlay in the relation to air quality/emissions. Noise emissions have been considered under
separate cover.
Table 4 – Desired Outcome
Ref Description Site-specific Consideration / Comments
The monitoring results presented in this report and
Community health and amenity is protected from placement of Balance Allotment 2500 demonstrates
DO 1
adverse impacts of noise and air emissions. that risk to community Health and amenity has been
adequately considered and addressed.
Table 5 – Performance Outcomes
Ref Performance Outcome (PO) Site-specific Consideration / Comments
PO 1.1 Sensitive receivers adjoining high noise and/or air a) N/A – Balance Allotment 2500 separates sensitive
pollution sources are designed and sited to shield receivers from Port Wakefield Road.
sensitive receivers from the emission source using b) As per item (a). Also to be considered via
measures such as: allotment-specific design solutions.
a) placing buildings containing non-sensitive receivers c) N/A – noise not considered in this scope of
(such as retail and commercial) between the works).
emission source and sensitive receivers
d) N/A – noise not considered in this scope of
b) within individual buildings, placing rooms more works). Refer to item (b).
sensitive to air quality and noise impacts (such as
living rooms and bedrooms) further away from the
emission source
c) providing appropriate separation or erecting noise
attenuation barriers, provided the requirements
for safety, urban design and access can be met
d) the use of building design elements such as
podiums and jutting, deep or enclosed balconies
(including with solid balustrades)
PO 1.2 Development incorporating a sensitive Nearest sensitive receptors are separated from Port
receiver adjoining high air pollution sources use Wakefield Road by Balance Allotment 2500 (see
building design elements such as varying building Appendix A).
heights, widths, articulation, setbacks and shapes to Also to be considered via allotment-specific design
increase wind turbulence and the dispersion of air solutions.
pollutants.
PO 1.3 Development incorporating a sensitive Nearest sensitive receptors are separated from Port
receiver adjoining high noise and/or air pollution Wakefield Road by Balance Allotment 2500 (see
sources locates private open space (including ground Appendix A).
level courtyards and balconies), common open space Also to be considered via allotment-specific design
and outdoor play areas within educational solutions.
establishments and pre-schools away from the
emission source.
J169796 Stage 7 Riverlea Park - Air Quality Monitoring Report (Aug2021) 13
greencap.com.au
Adelaide | Auckland | Brisbane | Canberra | Darwin | Melbourne | Perth | Sydney | WollongongAugust 2021
Table 6 – Deemed-to-Satisfy Criteria / Designated Performance Features
Deemed-to-Satisfy DTS) Criteria / Designated Site-specific Consideration / Comments
Ref
Performance Feature (DPF)
DTS/DPF Sensitive receivers satisfy all of the following: a) Nearest sensitive receptors are separated from
1.1 a) do not adjoin a: Port Wakefield Road by Balance Allotment 2500
(see Appendix A).
i. Designated Road: Type A
b) N/A – noise not considered in this scope of works.
ii. Designated Road Corridor: Type B
iii. Designated Road: Type R
iv. Train Corridor
v. Tram Corridor
b) adjoining development incorporating music
includes noise attenuation measures to achieve a
noise level in any bedroom exposed to music noise
(L10) less than:
i. 8 dB above the level of background noise
(L90,15 min) in any octave band of the sound
spectrum;
and
ii. 5 dB(A) above the level of background noise
(LA90,15 min) for the overall (sum of all octave
bands) A-weighted levels.
DTS/DPF Sensitive receivers do not adjoin any of the following: Nearest sensitive receptors are separated from Port
1.2 a) Designated Road: Type A Wakefield Road by Balance Allotment 2500 (see
Appendix A).
b) Designated Road: Type B
c) Designated Road: Type R
d) Train Corridor
e) Tram Corridor
DTS/DPF Open space associated with a sensitive receiver is not Nearest sensitive receptors are separated from Port
1.3 adjoining any of the following: Wakefield Road by Balance Allotment 2500 (see
a) Designated Road: Type A Appendix A).
b) Designated Road: Type B
c) Designated Road: Type R
d) Train Corridor
e) Tram Corridor
f) Development incorporating music
J169796 Stage 7 Riverlea Park - Air Quality Monitoring Report (Aug2021) 14
greencap.com.au
Adelaide | Auckland | Brisbane | Canberra | Darwin | Melbourne | Perth | Sydney | WollongongAugust 2021
5 CONCLUSION
Greencap was commissioned by Walker Buckland Park Developments Pty Ltd to undertake air quality
monitoring for the site located on the corner of Legoe and Reedy Roads, Buckland Park, South Australia
(referred to as Stage 7 Riverlea Park). Due to the site’s close proximity to Port Wakefield Road, the SA EPA
requested additional information relating to exhaust emissions from nearby traffic and its potential to affect
the health of future residents of Stage 7.
Two monitoring units (Locations 1 and 2) were placed approximately 90 metres west of Port Wakefield Road
along the eastern boundary of the proposed Stage 7 residential development to monitor dust and emissions
from the road.
Average concentrations for dust (including PM2.5 and PM10) and gases (including carbon monoxide, nitrogen
dioxide and sulfur dioxide) were all below the adopted Maximum Concentration Standard as detailed in Table
1 of Schedule 2 of the National Environment Protection (Ambient Air Quality) Measure. Volatile organic
compounds measured at 0ppb for locations 1 and 2, with the exception of some spikes likely caused by a
running vehicle next to the monitors, during set-up. Elevated ozone results exceeding the adopted criteria
were reported at Locations 1 and 2 generally from 19:00 to 07:00, during off-peak traffic times.
It is noted that high ozone levels associated with traffic emissions typically occur after noon through to early
evening, and results from reactions between VOCs and nitrogen dioxides. The elevated ozone levels at the
site occurred from evening to early morning, and nitrogen dioxide and VOC levels were low.
A review of the Assessment Provisions within the Planning and Design Code Noise and Emissions Overlay in
the relation to air quality/emissions identifies that the desired outcomes can be achieved.
J169796 Stage 7 Riverlea Park - Air Quality Monitoring Report (Aug2021) 15
greencap.com.au
Adelaide | Auckland | Brisbane | Canberra | Darwin | Melbourne | Perth | Sydney | WollongongAugust 2021
Air Quality Monitoring Report
Walker Buckland Park Developments Pty Ltd
Stage 7 - Riverlea Park
Appendix A: Proposed Development Plan
J169796 Stage 7 Riverlea Park - Air Quality Monitoring Report (Aug2021) 16
greencap.com.au
Adelaide | Auckland | Brisbane | Canberra | Darwin | Melbourne | Perth | Sydney | WollongongDevelopment No. 292 / D / 20
City of Playford
Proposed Plan of Division
Allotments 5008 & 5009 in Dev. No.
292/D019/12
Allotment 6001 in Dev. No. 292/D018/15
Hundred of Port Adelaide
in the area named
BUCKLAND PARK
Cs'T 5755/199, 5763/970
PT C'sT 5228/167, 5424/348, 5868/769
4.4
15.1
7
N
12.5
728
27
.09
16 575m²
729 W E
30
16 375m²
730 7
30
20.4
4.24
480m²
16
731 .97 S
30
12.5 32
.05
566m² 754
16 537m²
0 10 20 40 60 80 100
27
34.2
16
16
19 35 m
.93
FP 40170 732 753
1.1
560m² 628m²
1:1000 @ B1
3
35 2
35.6
16
18
18
RIVERLEA
.11
733 752
630m² 659m²
LEGEND
35 8 PRECINCT 1
12
37.5 Allotment Type Width Depth Area m² Total Total%
18
16
18
Stage 7
.57
751
WID
734 Terrace 7 25 200 8 4.8%
478m²
E
630m² 4 Small Courtyard 12.5 25 312 13 7.7%
38.9
16
12.5
.09
35 Medium Courtyard 16 25 400 14 8.3%
18
7 750
20.7 735 637m² Large Courtyard 18 25 450 12 7.1%
438m² 9
40.6 Small Villa 12.5 30 375 22 13.1%
16
35
20
.09
16
12.5
32
653 749 Medium Villa 12.5 35 438 2 1.2%
722m² 736
665m² Small Traditional 16 30 480 39 23.2%
20 560m²
35
3
652 42.4 .43
16
35 Medium Traditional 18 30 540 25 14.9%
.09
37 748
16
700m²
4.24
16
20 Large Traditional 20 30 600 5 3.0%
35
651 4 737 613m²
17.7 Entry Estate 16 35 560 16 9.5%
700m² 560m² 7
39.1
16
18
Small Estate 18 35 630 7 4.2%
35
16
35
.09
650 20
16
40 747
18 700m² 738 641m²
Medium Estate 20 35 700 4 2.4%
35
649 20 640m² 1 Large Estate 22 35 770 0 0%
40.9
16
630m² 4.24
18 40
.0
16
Other 1 0.6%
35
9
648 746
16
20 27
739 Total 168 100%
15
630m² 661 669m²
6
35
640m² 6
647
18
536m²
42.6 21.6
22
630m² 40
16
27 30
.15
12.5
745
35
16
18
18 662
16
740 571m²
4.24
536m² 660 12.5 744
4.01
E
25
WID 480m² 640m²
9.5
313m²
18 21.6 30 40 16 743 8
21.3
25
15
4.2 30
12.5
4 4
16
663 313m²
13.0
16
25
742
375m² 659 20 12.5 2
21.2
/15
400m²
16.3 30 480m²
018
12.5
12.5
25
673 741
27.9
16
9.0
30
2/D
30
539m² 664 18
27.36
674 495m² 755
16
7
IDE
.1
6
. 29
22
27.5
16
8
413m² 480m² 658 6W 686m²
o 1
24.27
v. N
30 16
30
675 480m² 17 756
16
3
21.6
12.5
4.24
De 16
4.6
637m² 665 30 540m² 9
16 32.6 18 24.4 13.49
30
757
10.0
16.2
375m²
15.47
10.5
16
672 30 657
30 480m²
12.5
12.5
12.5
9
546m²
30
35 666 480m² 758 18
27
30
767
PO
16
17.5
676 35.68 30
.18
375m² 759 540m² 18
16
560m² 766 454m²
30
RT
30
4.24
DE
30
16
16.2
16
520m²
12.5
12.5
671 656 375m²
RA
16
35 667 16
30
9
16
PA
596m² 480m² 30 765 5
14.5
18 16.7
12.5
375m²
W
16
540m²
677 38.76 14.76 30 30 760 12.5
IDE
16
12.5
30
764 12.5
560m² 12.5 375m²
16
18
668 30 16 480m² Walker Corporation Pty Ltd
12.5
22.4
655
16
763
KA
682
12.5
30
35 18
480m² ABN 95 001 176 263
W
681
PIN
16 540m² 375m²
6
425m²
25
680 18
AK
30
KA
18 313m² 30 762 G.P.O. Box 4073
16
25
30
18
679 313m² 16
2
480m² 4.47
25
16
EF
Sydney NSW 2001
3.8
16.57 669
30
678 761 1
18
400m²
18.04
19.9771
25
654 12.5
IE
12.5 480m² E Level 21, Governor Macquarie Tower
14
421m² 535m² WID
12.5
27
540m²
.1
L
16 401m² Client 1 Farrer Place Sydney NSW 2000
30 16
D
5.1 5.15 4.8 16
16
16 6
30
17
5
5.15 20 24.7 Telephone (02) 8273 9600
18
12
WIDE 670 15 16
Dev. No. 292/D019/12 4.24 770 Facsimile (02) 9252 7400
.57
16 772
22
540m²
30
685 318m² Web walkercorp.com.au
20 12.5 480m² 3
496m² 26.1
12.5
30
30 773
18
12
769
.57
4.16
684 480m²
25
20 27 774
30
15
14
500m² 2 335m²
5 17.1 775 16 9
10
5.1 375m²
27.4
RO
WID
12.5
.08
30
683 19.5
4.24
25
5 446m²
16 768
5
.1
4.01
E
AD
496m² 20
5.1
5 30
22
12.5
RESERVE 781 362m²
12.5
12
25
ET 776 12.5 25.9
RE
1601 488m²
13
17 375m² 780
ST
4.24
25
4850m²
12.5
30 313m² 2500
12.5
779
19.5
25
777 4.47 Balance Allotment
KAP
313m²
RE
4.6
45.04
375m² 5
25
3
25.32 30 12.5 18.1 4.353 ha
ER
785
14
E
12.5
RT
687
14.8
15
.6
12.5
DY
INKA
16 778 382m²
18
CA IDE
14
17.5
521m² 5
6W
2
17.5
E
446m²
.5
16 23.0
WID
1
10
31.69
PLAC
12
16 27 16
12
784
E
688 786
.57
30
12.7
4.24
30
IDE 13 686 297m²
14 W 689 480m² 540m²
4
1
30
24.4
4.2
690 20
12.5
3
411m² F LOTS 796 - 814 AMENDED RHF GIH 12.07.2021
30
787
Dev. No. 292/D019/12
RO
480m²
12
26
4.2
12.5
30
14.5 4 691 416m² 34.1 783 E DESIGN CHANGES RHF GIH 23.06.2021
.57
16.1 480m²
26
30
12.5 412m² 18 314m² D DESIGN CHANGES RHF GIH 22.06.2021
AD
16 18 27 788 8
23
12.5 25.7
17.5
12.5
719 600m² C ROAD WIDTHS AMENDED RHF GIH 18.06.2021
13.33 16 16 789
14
29.5
720
22
433m² 697 16 B STAGE RE-DESIGN RHF GIH 17.06.2021
30
4.24
25
.6
782
1
721 313m² 16 520m²
6.5
A FIRST ISSUE (155 LOTS) RHF GIH 28.04.2020
9
32 696 609m²
25
4.01
PAR
32
795
TORKINGTON
313m² 463m²
30
722 30
25
692
18
20
14.5
695 576m²
17.5 12.5
17.5
540m²
32
427m² 8
576m² 694 790 18 24.6 Issue Description Drwn Ckd. Appd. Date
30
12.5 512m² 794
2
32
20
3.8
A
18
30
12.5
12.5 718 512m² 19.25 375m² 480m²
12.5
32
DE
30
30
17.5 375m² 793 18
12.5
18
12.5
30 32
30 540m² 4.47
693 19.5 2
18
16 792
723 12.9
30
12.5
20
717 572m² 16 16
600m² 375m²
15
375m² 4.6 12.5
30
791
12.5
20
3 796
18
27
29
30 4.2
WIDE 25.83 580m² E 16
.18
30 4 16 WID 522m²
699
27
14.8
16 797
30
MARCHANT TRAIL 716 16 12.5
16
530m² 375m²
2
17.5
724 16 18
18
480m²
30
798
12.5 32.2 16.5 9
19.1 9
16
536m² 4.24 480m²
700
15
30
15.6
12.7
16 18
30
30
701 480m² 698 799
4.2 27 12.5
22
15
30
3
715 418m² 813
COURT
4 540m²
16
702 480m² 16
.15
4
25
12.5
34.61
4.2
30 No. of proposed residential allotments 168
30
725
480m² 703 375m² 16.61 800 16 422m²
9.5
30
16
20
22 812
COURT
480m² 540m²
25
704
4.01
18
500m² 30 16 233m²
Total area 17.286ha
30
801 5
30
18 400m²
16 W
2
20
4.24
536m²
27.5
15.4
12.5
714 16 2 811
711
6
150m²
Development Area (total less 2500) 12.933ha
25
27
6.5
25 12.5
5
IDE
375m² 710 580m² 400m²
802 25 150m² 18 16
12.5
6
30
16
30 540m² 810 Reserves (11.3%) 1.462ha
25
709 3
6
803 25 150m²
8W
18 18.8
30
726 450m²
12.5
6
713
2
708
20
480m² 16
Length of new roads 2010m
3.8
IDE
30
19.38 809
6
500m² 804 25 150m²
25
375m² 707 480m²
6
IDE
20
12.5
30
30 706 450m² 18
18 6W
6
375m²
805 25 150m² 1
30
Dev. No. 292/D019/12
25
6
25
705 480m²
Contour interval 0.5m.
APPLEBEE
16
25
30
712
6
806 25 150m²
16
63
10.5 18
536m²
27
6
16
727 480m²
Datum AHD.
BRANDTS
6
12.5 25
20
807
16
814
9.5
15
499m² 30 16 237m²
IDE
6
4.2 14 W 808 1575m²
15 25
24.73
4
Road pavements shown are indicative only.
9.5
5.01
E
WID 63
RESERVE 14
25
27
1602 Dimensions and areas are subject to survey.
4957m²
RESERVE
1603 ** Not to be used for detailed engineering design **
4809m²
© ALEXANDER & SYMONDS PTY. LTD. Original Sheet Size B1
Glenn Ian Hordacre
LICENSED SURVEYOR
VARD
BOULE
REF: 20A2439.00007
RIVERLEA BOULEVARD LE A DWG NO.: 20A2439PROP7(F)
RIVER REVISION: F
RHF 12.07.2021
Alexander & Symonds Pty Ltd
11 King William Street Kent Town,
South Australia 5067
PO Box 1000 Kent Town, SA 5071
DX 209 ABN 93007 753 988
Dev. No. 292/D019/12
T (08) 8130 1666
F (08) 8362 0099
10.0
W www.alexander.com.au
E adelaide@alexander.com.au Alexander
Symonds
Dev. No. 292/D019/12 + Property + Land Development +
Surveying
+ Construction + Mining +
+ Spatial Information Management +
ConsultantsAugust 2021
Air Quality Monitoring Report
Walker Buckland Park Developments Pty Ltd
Stage 7 - Riverlea Park
Appendix B: Calibration Certificates and Unit Specifications
J169796 Stage 7 Riverlea Park - Air Quality Monitoring Report (Aug2021) 17
greencap.com.au
Adelaide | Auckland | Brisbane | Canberra | Darwin | Melbourne | Perth | Sydney | WollongongAirMet Scientific P/L
7-11 Ceylon Street
Nunawading
Calibration Certificate VIC 3131, Australia
Tel: 03 8878 3300
Fax: 03 8878 3344
This document certifies that the instrument detailed has been calibrated to the parameters
Certificate Print Date: 12-Jan-2021 Call ID / Order No: 247779
Calibration Date: 08-Jan-2021 Job No / Pack No: S2477790001
Next Calibration Due: 8-Jul-2021
Customer: AMS VIC Rental-ID 399981 Serial No: ER0121001
Description: Air-MetER AX BASE NO DUST WITH MODEM / LOGGER
Calibration Summary
Frequency: Semi-Annual Temp: 22°C As Found: Out of Tolerance Result: Pass
Humidity: 45% Certificate: S2477790001
As Found As Left (Cal Status)
Desc Actual Result Actual Result
CO Sonimix diluted 0.0 Fail 5995.0 Pass
6000ppb
NO2 Sonimix diluted 0.0 Fail 2997.0 Pass
3000ppb
Ozone generator O3 0.0 Fail 998.0 Pass
1000ppb
SO2 Sonimix diluted 0.0 Fail 3005.0 Pass
3000ppb
Isobutylene Sonimix 0.0 Fail 5989.0 Pass
diluted 6000ppb
Page 1 of 2 eDoc V1R0Standard Used
Equip ID Description Valid Until Cert
ME718 25.4PPM H2S, 97PPM CO, 23.78% LEL Pentane, 25/07/2021 030000051119
19.1% O2 /1
ME758 95 ppm Isobutylene, 20.9% O2 in N2 Balance 30/06/2025 03000005711
2/1
Ozone Generator Model 306 Ozone Generator 22/04/2021 306_260_220
420
ME614 48PPM NO2 in N2 Balance 19/04/2024 03000004949
8/1
ME337 SO2 53PPM. N2 Balance
Completed By: Wentao Zhang Signed:
Page 2 of 2 eDoc V1R0AirMet Scientific P/L
7-11 Ceylon Street
Nunawading
Calibration Certificate VIC 3131, Australia
Tel: 03 8878 3300
Fax: 03 8878 3344
This document certifies that the instrument detailed has been calibrated to the parameters
Certificate Print Date: 12-Jan-2021 Call ID / Order No: 247779
Calibration Date: 08-Jan-2021 Job No / Pack No: S2477790002
Next Calibration Due: 8-Jul-2021
Customer: AMS VIC Rental-ID 399981 Serial No: ER0121002
Description: Air-MetER AX BASE NO DUST WITH MODEM / LOGGER
Calibration Summary
Frequency: Semi-Annual Temp: 22°C As Found: Out of Tolerance Result: Pass
Humidity: 45% Certificate: S2477790002
As Found As Left (Cal Status)
Desc Actual Result Actual Result
CO Sonimix diluted 0.0 Fail 6011.0 Pass
6000ppb
NO2 Sonimix diluted 0.0 Fail 2993.0 Pass
3000ppb
Ozone generator O3 0.0 Fail 1003.0 Pass
1000ppb
SO2 Sonimix diluted 0.0 Fail 3009.0 Pass
3000ppb
Isobutylene Sonimix 0.0 Fail 5989.0 Pass
diluted 6000ppb
Page 1 of 2 eDoc V1R0Standard Used
Equip ID Description Valid Until Cert
ME337 SO2 53PPM. N2 Balance
ME718 25.4PPM H2S, 97PPM CO, 23.78% LEL Pentane, 25/07/2021 030000051119
19.1% O2 /1
ME758 95 ppm Isobutylene, 20.9% O2 in N2 Balance 30/06/2025 03000005711
2/1
Ozone Generator Model 306 Ozone Generator 22/04/2021 306_260_220
420
ME614 48PPM NO2 in N2 Balance 19/04/2024 03000004949
8/1
Completed By: Wentao Zhang Signed:
Page 2 of 2 eDoc V1R0DATASHEET
AirMetER-DX
2-FRACTION OPTICAL
PARTICLE COUNTER
LOW-MAINTENANCE DUAL-FRACTION DUST
MONITOR FOR OUTDOOR AIR QUALITY
MONITORING APPLICATIONS
The AirMetER-DX is an economical, laser-based Optical Particle Counter for the
monitoring and recording of PM2.5 and PM10 dust fractions.
Designed specifically for remote outdoor monitoring applications, the AirMetER-DX
integrates seamlessly with Air-Met Scientific’s web-based data portal to provide
customisable SMS and/or email alerts, rolling averages and automated reports.
A range of accessories are also available, making the AirMetER-DX an ideal dust
monitoring solution for your next project.
FEATURES
◦ Heated inlet
◦ Humidity correction
◦ Over the air (OTA) K-factor correction (requires gravimetric sample data)
◦ Low maintenance requirement
◦ Simultaneous PM2.5 and PM10 measurement
◦ OPTIONAL:
◦ 3 years onboard datalogging with unique file name creation every 24
hours for easy download
◦ Dedicated alarm relay (24Vdc) for PM2.5 and PM10 level plus common
alarm relay
◦ ModBus RTU via RJ12 port for integration
DATA
Cellular telemetry through Air-Met’s secure data portal.
◦ 5 minute datalogging interval with FTP transfer to Air-Met’s secure data portal
◦ 1-hour and 24-hour rolling averages as standard
◦ Data downloads, user management, threshold alert management (SMS and or
email) and auto-report generation all managed via Air-Met’s data portal.
Requires minumum 6-month subscription to Air-Met’s data portal.
APPLICATIONS
◦ Construction sites
◦ Road-side monitoring
◦ Large area monitoring projects
airmet.com.au
Work with ConfidenceTECHNICAL SPECIFICATIONS
GENERAL
Power requirement 10.8−30V DC (12VDC nominal)
Rated Power 20W max with heated inlet
8W max without heated inlet
Datalogging (optional) 3 years of logs onboard
Alarm Indicator (optional) Onboard dedicated alarm relay for PM2.5 and PM10 levels
Communication (optional) ModBus RTU (RJ12) for PLC or SCADA integration
Operating Temperature -20°C to 60°C
Operating Humidity 0 to 98% non-condensing
Operating Pressure 860 to 1100 mbar
Laser Module Operating Life 3 years (when operated below 40°C)
MEASUREMENTS
PM2.5 PM10
Range 0.0−1999.9µg/m3 0.0 – 2999.9µg/m3
Counting Efficiency 70% at 0.3μm, 98% at 0.5μm 70% at 0.3μm 98% at 0.5μm
Relative Error Max of ±10% and ±8μg/m3 Max of ±15% and ±10μg/m3
ENCLOSURE
Material Polycarbonate
Dimensions (mm) 400 (H) x 300 (W) x 150 (D)
Instrument Weight 6.7kg
Mounting Options Pole-mount kit supplied (recommended installation method)
Wall-mount − ~70 mm offset required for dust inlet clearance
ACCESSORIES
PART NO. ACCESSORY
TF-TRI-AM Tripod
AMS/200S/170B/15M/9C Remote Power System
AMS-LPF-60-12 IP67 230VAC to 12VDC Mains Power Adaptor
Contact Us Meteorological Sensors
Air-Met Scientific | OHS & Environmental Monitoring Equipment Specialists
V0720
P 1800 000 744 | E sales@airmet.com.au | W www.airmet.com.au
Work with ConfidenceAugust 2021
Air Quality Monitoring Report
Walker Buckland Park Developments Pty Ltd
Stage 7 - Riverlea Park
Appendix C: Weather Observations
J169796 Stage 7 Riverlea Park - Air Quality Monitoring Report (Aug2021) 18
greencap.com.au
Adelaide | Auckland | Brisbane | Canberra | Darwin | Melbourne | Perth | Sydney | WollongongYou can also read