The urban development in Dubai - DEPARTMENT OF ECONOMICS Uppsala University Master thesis Author: Fatema Fazal Supervisor: Ina Blind Autumn 2008
←
→
Page content transcription
If your browser does not render page correctly, please read the page content below
DEPARTMENT OF ECONOMICS
Uppsala University
Master thesis
Author: Fatema Fazal
Supervisor: Ina Blind
Autumn 2008

              The urban development in Dubai
                      A descriptive analysis

                                               1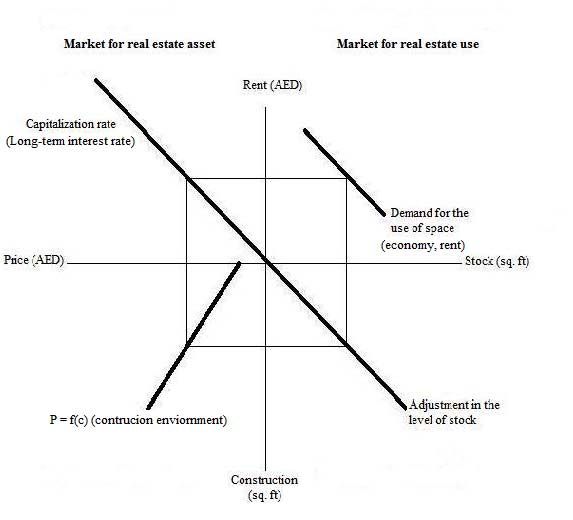
Abstract
The aim of this paper is to analyse the urban development in Dubai by means of the four-
quadrant model, presented by DiPasquale and Wheaton, which represents the market for real
estate use and assets. The focus is on factors such as economic growth, access to oil,
population growth and the incentive of the government to promote developments in Dubai, to
study how they affect the real estate market. It is observed how all these factors contribute to
the expansion of the construction sector and thereby the stock of space. However, because
Dubai’s economy is independent of the oil sector, access to oil is solely assumed to contribute
to a higher amount of disposable capital and therefore does not have any upward pressure on
the rent and the price level as the remaining factors.

Keywords: Dubai, urban growth, four-quadrant model, economic growth, oil, population
growth, construction sector, real estate

                                                                                                   2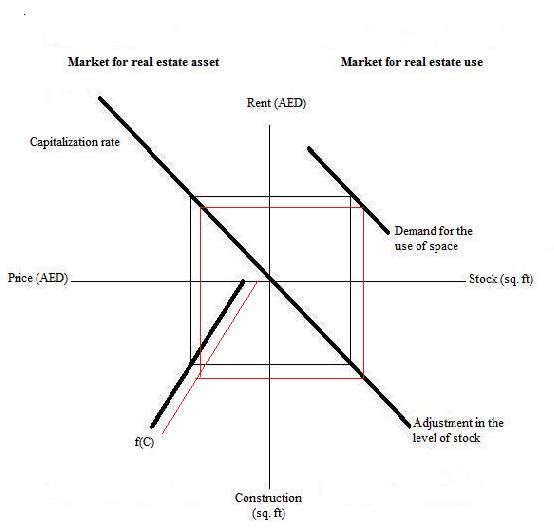
Index

1. Introduction ..................................................................................................................... 4
2. Background: Dubai......................................................................................................... 5
   2.1 The urban area .......................................................................................................... 5
   2.2 The economy ............................................................................................................. 6
   2.3 The population growth.............................................................................................. 9
   2.4 The government ...................................................................................................... 10
3. Earlier studies ................................................................................................................. 11
   3.1 Why business investors turn to Dubai by Karlsson and Kindblom ......................... 11
   3.2 The construction sector in Dubai by Bakheet and Rettab ................................... 11
   3.3 The real estate sector in Dubai by Bakheet et al.................................................. 12
4. The four-quadrant diagram by Dipasquale and Wheaton ...................................... 13
5. Analysis of the urban development in Dubai ............................................................. 16
   5.1 Economic growth .................................................................................................... 16
   5.2 Access to oil ............................................................................................................. 18
   5.3 The population growth............................................................................................ 19
   5.4 The incentive of the government........................................................................... 21
6. Concluding remarks...................................................................................................... 24
References......................................................................................................................... 26
Appendix I ......................................................................................................................... 28
Appendix II......................................................................................................................... 28

                                                                                                                                     3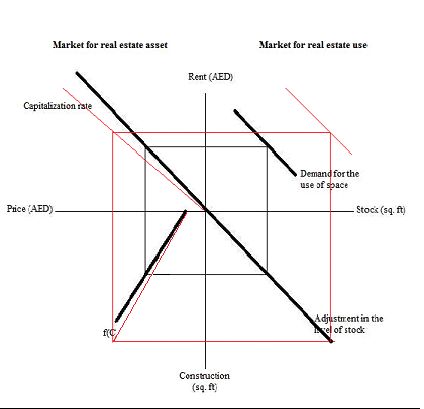
1. Introduction
Dubai is one of the seven emirates belonging to the country United Arab Emirates, UAE, in
the Middle East (see Appendix I). Over the course of a few decades it has transformed into a
well developed region. The rapid developments appearing in the city may have to do with the
vision of the government. Its aim is to transform Dubai from a regional business, financial and
leisure hub into a global center. In the process capital is being invested in the purchase of
concrete, glass and steel. Dubai’s skyscrapers rise from the clusters, artificial islands rise from
the sea and neighborhoods containing residences and offices rise from the sand (CBS 2007).
During 2000-2004 the annual growth of the construction sector was 5% and the number of
completed buildings increased by 11% annually (Bakheet et al 2004).

Many impressive building projects are underway. At present the world’s largest building, Al
Burj, is being built in Dubai. Along with that the construction of an area consisting of 300
islands in the shape of the world map is in progress. The city also has plans to create the
largest airport in the world. Furthermore, the only seven-star hotel in the world, Burj Al Arab,
is located in Dubai and so is the world’s largest indoor ski resort. Another completed project
is Palm Jumeirah, which is a palm-shaped artificial island for residential use (Lans 2008).

It is a fact that Dubai is expanding like never before. How has this been possible? Are the
developments occurring in the emirate solely a speculation? The aim of this paper is to study
the urban development in Dubai using the four-quadrant diagram which illustrates the market
for real estate use and assets, presented by two professors of economics: Denise DiPasquale
and William C. Wheaton. Factors such as economic growth, access to oil, population growth
and government incentive to promote general development in Dubai will be studied to see
how they contribute to the changes in the real estate market of Dubai in the diagram. The time
interval that is mainly in focus for the analysis is the years 2000-2007. The main cause for
limiting the time interval is the current global financial crisis. By having an insecure
economic environment, it cannot truly yet be analyzed how the real estate market in Dubai
will be affected through the four-quadrant diagram.

The paper is presented in the following manner: Section 2 provides background information
about Dubai and is followed by section 3 which presents former studies regarding the emirate.
Section 4 describes the four-quadrant diagram, whereas section 5 contains the main analysis.

                                                                                                  4
Finally, the concluding remarks are presented in section 6.
It is not always easy to find reports and data concerning Dubai on the websites belonging to
the government. Information about the whole UAE is easier to find. In Dubai’s statistical
portal it is common to find incomplete data, ancient data or information presented in Arabic.
Private companies, magazine articles and international institutes have plenty of information
related to this paper and they are therefore used as sources in some cases.
2. Background: Dubai
2.1 The urban area
Michael Pacione, in his study about the urban structure in Dubai, divides the city’s urban
development into four different periods: 1900-1955, 1956-1970, 1971-1980 and 1980-2005.
Slow growing economy and population characterize the first period. The inhabitants lived in
houses made of palm fronds and, due to lack of resources and capital, the expansion of the
urban city was limited. In 1955 it only covered an area of 3.2km2.
During the second period it was realized that a formal organization is required in order to
support the growth of Dubai. Dubai Municipality was established in 1957 and the committee
members were chosen among the top businessmen. A master plan was formed which resulted
in the appearance of a road system and a new town center. Construction of houses made of
concrete blocks also started to emerge. However, the urban expansion continued at a slow
pace.
During 1971-1980 the urban area expanded enormously as the emirate now had more capital
at its disposal, in large part due to the oil revenues. After the oil discovery in 1966 major
infrastructure and urban development projects were planned. Investments were made in
improving the current road system, building tunnels, bridges, container terminals, trade
harbors as well as industrial and residential areas. Likewise financial, business and
administrative centers were established in different parts of the city.
Pacione describes how during the most recent period Dubai expanded like never before. The
economic growth accelerated and so did the investment level. More development projects
5were planned to support and encourage urban growth. Efforts were also made to attract
tourists from all around the world. In 2004 the emirate covered an urban area of 605km2 and
the government is planning to add another 501km2 by the year 2015.
Looking at the latest years, figure 9 shows the construction sector’s share of the total GDP
between the years 2000-2006 (the value of 2006 is solely an estimate). The graph shows an
upward trend hinting at an increasing importance of the construction sector during this period.
The construction sector in Dubai
14
Percentage of the total GDP
12
10
8
6
4
2
0
2000 2001 2002 2003 2004 2005 2006
Year
Figure 1 The development of the construction sector 2000-2006 Source: Dubai Chamber 2006
It follows by Pacione’s study that from 1900 to 2005 Dubai managed to expand its urban area
almost 190 times the original size. The importance of the construction sector can be seen in
figure 1. Instead of living in houses made of palm fronds, the inhabitants presently have
access to residences located on palm-shaped artificial islands (see introduction). It seems as if
the economy and the developments accelerated after the oil discovery in 1966 which
facilitated projects associated with urban growth.
2.2 The economy
Prior to the oil discovery, the inhabitants who lived as nomads, survived to some extent on
agriculture, while later fishing and the pearl industry became the dominant income sources.
Oil revenues simplified the capability of undertaking various projects in order to promote
economic growth (Exportrådet 2007).
6The economy is at present not dependent on oil. However, the independence is not a
coincidence but a planned strategy. The government realized early on that the access to oil is
temporary and therefore gradually moved the focus towards other sectors where comparative
advantage could be found, such as trade, transport, real estate/construction, tourism and
finance. The change of direction from a major reliance on the oil-sector to diversification is
believed to compensate for the relatively lower oil revenues in the future. This statement is
also declared by the ruler Al Maktoum in a public appearance in 2007 (UAE Yearbook 2008).
Figure 2 shows that in 1975 46% of the GDP was a result of the performances of the oil
industries but in 2007 they only contributed to 3% of the GDP.
Non-oil industries' contribution
100 97
90 93
90
82
80
Percentage of GDP
70
60 54 52
50
40
30
20
10
0
1975 1985 1995 2000 2004 2007
Year
Figure 2 The contribution of the non-oil sector to the total GDP of Dubai
Source: Oryx Real Estate, Mendoza 2007 and UAE Yearbook 2008
In the year 2000 the economic goal for the emirate was to reach a GDP level of 30 billion
USD by 2010. As early as the year 2005 it had passed that level and thereby managed to reach
its goal five years earlier. In 2008 it was publicized that the government expects to maintain
an average annual GDP growth equal to 11% and reach a level of 108 billion USD by the year
2015 (UAE Yearbook 2008). Figure 3 shows the development of the GDP level in Dubai
whereas figure 4 shows the percentage growth of the GDP per capita in comparison to the
previous year. The latter can be compared with figure 5 which shows the percentage growth
of the GDP per capita in Europe in comparison to the previous year.
7Value of GDP in Dubai 2000-2006
50000
45000
40000
35000
SD
30000
ValueinU
25000
20000
15000
10000
5000
0
2000 2001 2002 2003 2004 2005 2006
Ye a r
Figure 3 The nominal gross domestic product in million of USD in Dubai. Source: IMF country report 07/348
Growth in GDP/capita in Dubai
Compared with the previous year
30
Percentage change
25
20
15
10
5
0
2001 2002 2003 2004 2005 2006
-5
Year
Figure 4 Percentage growth in GDP per Capita in Dubai in comparison with the previous year
Source: IMF country report 07/348
Growth in GDP/capita in Europe
Compared with the previous year
4
Percentage c
3
2
1
0
2001 2002 2003 2004 2005 2006
Year
Figure 5 Percentage growth in GDP per capita in Europé in comparision with the previous year
Source: Eurostat
82.3 The population growth
In section 2.1 it was mentioned that around the year 1970 the urban developments in the city
took a new direction. At the same time the population growth started to accelerate. In 1968
the population was approximately 59 000. By the year 1985 it had reached approximately
370 000 (Pacione 2005). Figure 6 shows how the population has been growing from the end
of year 2001 until the end of year 2007 (with a missing value for the end of year 2005). At the
end of year 2001 the population was around 910 000. It increased to approximately 1.5
million by the end of 2007 and is believed to reach a level of just about 1.9 million by the end
of year 2010 (Dubai Statistics 2007).
The population by the end of each year
2000
Population in thousand
1500
1000
500
0
2001 2002 2003 2004 2006 2007 2010
Year
Figure 6 The population growth in Dubai (inclusive foreign labour) Source: Dubai Statistics 2007
One of the two main explanations for the increasing population is the change in the
demography. Recently Dubai has been experiencing a higher birthrate, decline in infant
mortality and higher average duration of life, which are results of the improvements in health
care facilities and technology (Pacione 2005).
The second explanation is that Dubai’s economic expansion causes an increase in demand for
labour of a type and amount which is not available in the city and therefore needs to be
satisfied through foreign workforce. In the year 2000, 53% of the population was born in a
foreign country and the demographic profile of the emirate states that the majority were men
between the ages of 20 and 40 years. The majority of immigrants consist of Indians,
Pakistanis, Arabs, Europeans and Canadians (Pacione 2005).
The immigrants are occupied in the private sector where the working conditions are worse
and the benefits are less in comparison to the public sector where mainly the local inhabitants
9are employed. Despite the fact that foreigners have limited access to social benefits,
education, medical care and are in general not given the same rights as the national
population, a field study consisting of interviews showed that immigrants choose to locate in
Dubai because of the relatively higher salary and also because the emirate is seen as a place
with greater opportunities for success (Suter 2005).
2.4 The government
Dubai has been ruled by the Al Maktoum family since the year 1833. At present the ruler is
Sheikh Mohammed bin Rashid Al Maktoum who also is the vice president and the prime
minister of the UAE. In contrast with the western world the development plans in Dubai are
structured by the ruling family leading to a limited democratic influence by the inhabitants.
However, the ruling strategies of the government are considered of being one of the factors
behind the developments in the city (Pacione 2005).
The strategic plans in recent years have had a specific purpose: to support the economic,
social and physical expansion of Dubai. For instance in the year 1990 the government
introduced the Dubai Urban Area Strategic Plan 1993-2012. The aim of this plan is to provide
urban expansion by allocating land to meet current and future needs. To develop the
infrastructure, attract local and foreign investors and encourage collaboration between the
private and the public sectors are also part of the plan (Pacione 2005). Another example is the
Dubai Strategic Plan 2015 which was presented in 2007. It has especially been outlined in
purpose to support the expansion of Dubai in order for it to transform into a global financial,
business and leisure centre. For this Al Maktoum means that improvements in human capital,
productivity, innovation, cost of living and doing business, quality of lifestyle, laws and
regulations are important growth enablers (Dubai Government Information and Services
Portal 2007).
According to Dubai’s department of economic development the city is considered of being an
open economy with minimum interference in the private sector by the government and is
therefore an ideal location for business activities. There are moreover no trade restrictions,
quotas or exchange controls and the custom duties are relatively low. Taxes on personal
income or corporate earnings are not obligated except for oil companies and foreign banks
(Department of Economic development). Further, Dubai has built up free zones where foreign
companies can operate without following some of the legal restrictions applied outside the
10zones. For instance there is a law stating that majority of the shares of a company must be
held by a local emirate in Dubai, in the free zones this is not required. The companies are
moreover not obligated to pay taxes in the zones for 50 years and are permitted to repatriate
all their profits (Mendoza 2007). Examples of companies operating in the free-zones are
Microsoft, IBM, Nokia, Samsung, Chanel, BBC, CNN and McGraw Hill (Oryx Real Estate).
3. Earlier studies
3.1 Why business investors turn to Dubai by Karlsson and Kindblom
The authors have studied the business environment in Dubai by the theory of Philip Kotler,
professor of international marketing, to see why Dubai is an attracting place to invest in.
Kotler means that business investors find the level of safety, the location, the development in
the infrastructure, the access to consumer/customer market, the taxes and regulations, the
level of costs and the quality of lifestyle as important factors which effect their business
decision. Kindblom and Karlsson consider Dubai as an ultimate city for making profits
because it has all the features required by the investors according to Kotler. For instance the
level of safety is high, the taxes are zero, the infrastructure is well developed and the emirate
is located between Asia and Europe and therefore has access to a broad international market.
However, due to the real estate boom the rents have reached a higher level and are increasing
the production costs for the investors and by that the overall cost and price level.
3.2 The construction sector in Dubai by Bakheet and Rettab
This study was presented in the year 2005 to explain the dimension, features and prospects of
the construction sector in Dubai during 2000-2004. Along with that, changes in the prices of
construction materials were examined to see how they affected the sector. As mentioned
previously that period the construction sector faced an annual growth equal to 5%. During the
same period the number of completed buildings increased by 11%. The number of
construction companies increased from 3511 in the year 2003 to 4498 in the year 2004, with
the majority of the companies having 1-19 employees. The authors found the construction
sector as one of the main sources for economic growth. The construction boom, however, also
led to an increase in demand for materials such as steel, aluminum and cement and caused a
rise in its prices in the local market.
113.3 The real estate sector in Dubai by Bakheet et al.
The objective of this paper was to define the size of the real estate sector in Dubai, its
characteristics, problems and prospects. In 2005, half of the real estate enterprises had
operated for less than four years, reflecting the real estate boom in Dubai. The authors
comment that despite the fast pace of the developments, adjustments in laws and regulations
in the sector do not cope with it. Further, government supported companies have better
advantages in the market, discouraging private companies. Other problems are the slow
adjustments in rents, the fact that market studies are not done before any construction project
is undertaken and that there is a low range of data/statistics available.
124. The four-quadrant diagram by Dipasquale and Wheaton
1
Figure 7 The four-quadrant model Source: Dipasquale and Wheaton 1996
The four-quadrant model is a model developed by DiPasquale and Wheaton and is an
illustration of the real estate market in the long-run. The model is static and for its simplicity
suitable for this paper. As seen above the model includes two different markets. The market
for real estate use is where space is rented or purchased for occupancy and the market for real
estate assets is where properties are bought or sold as investments.
The curve in the upper quadrant on the right side represents demand for use of space. The
curve shifts depending on the economic outcome. If there is economic growth, then firms and
households demand more space for every level of rent than previously. This shifts the demand
curve upwards. The state of equilibrium appears when demand equals the supply of stock.
1
AED stands for United Arab Emirates Dirham and is the currency applied in Dubai.
13The curve on the upper left side is the capitalization rate for the real estate assets. It represents
the yield investors require in order to hold real estate assets. The capitalization rate is based
on the long-term interest rate, expected growth in rents, risk and government policies
concerning taxes for real estate. A higher capitalization rate results in a clockwise rotation of
the curve and a lower asset price. For simplicity expected growth in rents and risk will be
regarded as constants. As property taxes are not relevant in Dubai solely changes in the long-
term interest rate will be observed.
The construction level is set on the lower left quadrant. f (c) shows the cost for creating new
buildings or replacing the formers. The cost of replacement through new construction is
assumed to increase with greater building activities (c). In equilibrium the cost equals the
asset price which determines the level of construction on the vertical axes. With increasing
bottlenecks the cost for construction rises, shifting the curve to the left. Positive changes in
construction environment reduce the cost, shifting the f (c) curve to the right.
Finally the lower quadrant on the right side illustrates the total amount of stock supplied,
given the construction level. The change in the stock, ∆S, is zero in the long-run because the
construction level is meant to replace the losses occurring in the amount of stock. It is
therefore necessary for the costs and the prices to be equal. If that is not the case, ∆S, will be
separate from zero, hence not fulfilling the condition for equilibrium.
In the long-run the rent is determined by the stock supplied. The rent sets the asset price
which is equal to the cost of construction. The asset price decides a construction level which
at last determines the level of stock available. If the initial level of stock is not the same as the
finishing level, the markets are not in steady-state and adjustment in the rent, price,
construction and stock of space need to be made. Shifts of the different curves may lead to an
increase/decrease of the stock of space and the rent, price and construction level and hence a
different size of the square in the middle combining the curves in the model.
The analysis in section 5 is on a macroeconomic level, which means that the overall economy
and its effects on the overall real estate will be studied and that the different properties will
not be distinguished into different markets. Further Dubai is defined as a metropolitan area
with free mobility of firms and workers. This means that different locations in the city reacts
similarly to different changes in section 5 (DiPasquale and Wheaton 1996). As Dubai does not
14have its own currency and cannot control its monetary policy, in cases regarding the interest
rate and inflation, data related to the whole country will be studied.
Further, each of the factors will be studied independently to remark what impact they have on
the construction sector in Dubai and each of the models will be regarded as statics. The
specific size of the shifts of the curves is not to be regarded as essential, neither are the slopes
of the curves. The purpose is to see how the four factors generally cause changes in the
diagram. Throughout the analysis increase of the construction level will be associated with
urban growth.
155. Analysis of the urban development in Dubai
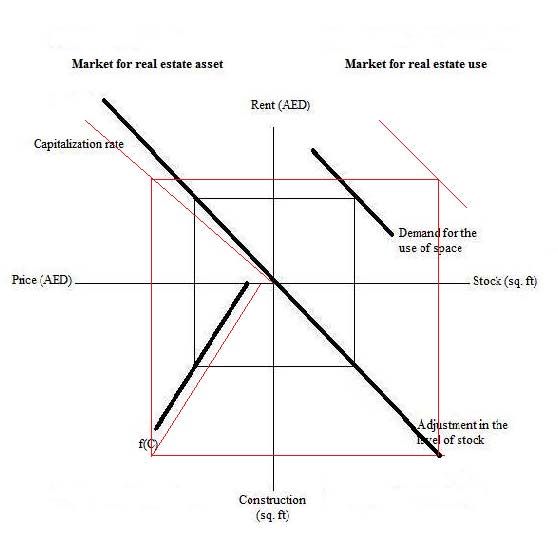
5.1 Economic growth
Figure 3 shows how the GDP level in Dubai has been increasing. Economic growth means
that a region experiences additional number of both workers and firms who are in need of
residences, offices and warehouses (DiPasquale and Wheaton 1996). In other words economic
growth should shift the curve reflecting demand for use of space upwards as shown in figure
8.
Due to the fact that the AED (United Arab Dirham) is fixed to the USD (United States
Dollar), the interest rates in the country need to adjust accordingly (Central Bank of the
UAE). The long-term interest rate in UAE has had the form of an U. However, throughout the
analysis changes in the long-term real interest rate will be regarded as it is inflation-adjusted
and captures the yield in terms of goods. In that case, the real interest rate in UAE has been
declining during 2000-2006 and during 2002-2006 it was negative (IMF Country report
07/347). As known these rates determine the amount of savings and the level of investments
in a region. If the real interest rate is declining it means that nominal interest rate is declining
and/or the inflation rate is increasing. Negative values of the real interest rate suggest that the
inflation rate is exceeding the cost of borrowing, which make investments attractive rather
than savings (Blanchard). Cooper (2006) writes that the negative real interest rates have
affected the real estate market in Dubai positively as the rates mean that the debts, as a result,
are devalued and the repayment in real terms are lowered which stimulate investments. Based
on this information it can be assumed that the final outcome of the capitalization rate curve
should be a counter clockwise rotation as in figure 8.
Availability of construction capital is not a problem in Dubai. Pacione means that with
increasing wealth (which started along the oil discovery), Dubai’s ability to undertake projects
in order to expand the urban area has been facilitated. Ability to finance construction projects
is a positive change (which may occur with increasing revenues) in the construction
environment along with decline of the real interest rate. On the other hand macroeconomic
theories state that economic growth also means that the overall prices in the long run increases
due to increasing demand in different factor markets (Blanchard 2005). Bakheet and Rettab
observed that products such as steel, aluminum and cement increased in price due to growth
in the construction sector. Higher prices mean higher costs which have a negative effect on
16the construction environment. However, in a growing economy, the production costs cannot
exceed the revenues. If that is the case the overall price increase cannot promote an increasing
GDP level as seen in figure 3 as higher prices have negative effect on regional demand
(DiPasquale and Wheaton 1996). Hence the final impact of the f(c) should be a shift to the
right as seen in figure 8.
According to figure 8 economic growth in Dubai should result in firms and households
demanding additional use of space which increases the level of rent. Increasing rent and
declining interest rate mean higher revenues for investors which pushes the prices of real
estate assets upwards. Increase in demand for use of space and assets require more
investments in the construction sector. Because economic growth leads to positive changes in
the construction environment the construction level raises further.
Figure 8 The effect of economic growth on the real estate market in Dubai
175.2 Access to oil
Table 1 in Appendix II presents the yearly change in the OPEC basket price 2000-2007. It
clearly shows that the crude oil price has been increasing from the year 2003. According to
macroeconomic theories increase in the oil price means generally higher production costs as
energy which is an important factor in investment planning turns out to become more
expensive. Higher production costs forces the firms to increase their prices and lower the real
wages. Increase in the price level discourages consumers while lowering of the real wages
discourages the workers from entering the labour market. The result is therefore a decrease in
the natural level of production. However, it is important to bear in mind that oil redistributes
income from oil buyers to oil producers (Blanchard 2005).
As described in section 2.2 Dubai has been focusing on diversifying its economy and turning
less dependent on the oil sector. Although the dependency on the oil sector was 3% in the
year 2007, access to it seems to have been beneficial for the emirate especially because of the
high oil prices (UAE Yearbook 2008). Taking that into consideration the economy of the
emirate should not have been affected negatively by higher oil prices as Blanchard describes,
because of the fact that Dubai is an oil producer. On the other hand, access to oil should not
have had any significant positive effect on the overall demand because, as mentioned earlier,
it is not considered of being a crucial factor for the economy in Dubai. Simply, access to oil
is a factor which is not of an essential character for the progress of the emirate but is solely
contributing to additional revenues due to its value.
Profits in terms of oil revenues may have had positive effects on the construction environment
as the revenues raises the disposable capital in the emirate and may therefore facilitate
construction projects, shifting the f(c) curve to the right. Figure 9 shows that as a result the
construction level and thereby the stock available for use is increased leading to lower rent
and asset prices. Obviously the reason for the rent decline is because the supply of real estate
use is now higher than demand. Lower rent in turn does not attract investments in the assets
market, lowering the price level.
18Figure 9 The effect of access to oil on the real estate market of Dubai
5.3 The population growth
The amount and type of local labour in Dubai according to Pacione is not capable of
supporting the economic growth necessitating foreign labour demand. The field study by
Suter indicates that foreigners seek to work in Dubai due to its relatively better labour
environment. According to DiPasquale and Wheaton (1996) immigration due to events in
other regions and demographic changes affect the labour supply curve. The question is
whether the population growth is majorly demand induced as Pacione means or majorly
supply induced as Suter concludes.
If the economic growth is forcing the emirate to demand foreign labour it means that the
wages in the labour market are by that increased resulting in higher production costs.
However, the production costs cannot overweigh the revenues in a growing economy, if that
19was the case the production in the overall economy would decline which is not consistent with
the economic situation in Dubai (see figure 3). If the case is that the supply is increasing and
resulting in a population growth, it is by that also lowering the wages in the labour market and
hence the overall production costs. No matter if the population growth in Dubai is demand
induced or supply induced, the overall production and employment rate reaches a higher level
as a result. A growing economy needs more labour (demand-induced) and more labour leads
to economic growth. Thus, population growth leads to economic growth and as the four-
quadrant model states, economic growth in a region shifts the demand curve for use of space
upwards (DiPasquale and Wheaton 1996) as seen in figure 10. That is logical as in order to
promote the population and economic growth, space is required for the additional labour and
production.
As population growth is connected to economic growth as discussed above, it is also
associated by changes in the long-term interest rate. As discussed previously the real interest
rate in UAE has been declining, shifting the capitalization rate downwards in figure 10.
Whether the population growth is demand induced or supply induced, the economic activities
in Dubai are positively affected. This means greater amount of capital and higher amount of
workers available in the construction sector along with decline of the real interest rates. In
section 5.1 it was mentioned that economic growth eventually raises the overall price level in
a region amongst other due to higher demand in different factor markets. Country report
07/347 by IMF published in 2007 proclaims that UAE has been exposed to a very high
inflation rate and production costs in sectors such as construction have risen significantly. The
main cause for the rise in inflation rate of Dubai is the rapid population growth. It has caused
a strong demand for residences and due to the supply not being able to cope with the growth,
the rents and hence the overall prices have been negatively affected. In the country as a whole
the rent level increased by 9 % in 2005 and 15 % in 2006. Temporary caps of 7 % on rent
increases were introduced in Dubai in early 2007. The report also points out that the economic
growth, population growth and the investment level are the factors which have been
strengthen the construction sector in Dubai. However, as mentioned earlier increase in the
price level cannot overweigh the revenues in a growing economy. Therefore the construction
sector should not be negatively affected due to costs which they cannot handle, in the sence
that the construction level cannot decrease from the previous level (DiPasquale and Wheaton
1996). Hence the f(c) curve should shift to the right as in figure 10.
20The final outcome should be the same as in section 5.1. Increase in demand for use of space
raises the rent level, which along with decline of the real interest rate attracts investments in
the assets market. Increase in prices along with improvements in the construction environment
stimulates construction, hence raising the stock of space in the region.
Figure 10 The effect of population growth on the real estate market of Dubai
5.4 The incentive of the government
Apparently the government has plans to transform the emirate from a regional business,
financial and leisure center into a global hub (CBS 2007). The ruling methods of the
government through different strategic plans such as Dubai Strategic Plan 2015, Dubai Urban
Area Strategic Plan 1993-2012, creation of the free zones and the limited interference in the
21private sector have the purpose of creating an attractive business environment (see section 2).
Karlsson and Kindblom found that the emirate is an ideal location for investments because the
level of safety is high, taxes are zero and the infrastructure is well developed.
Apart from the economic growth which attracts future residents and business investors that
need residences, offices and warehouses, government policies are creating an increase in the
need of space. All national males above the age of 20 years have the right to receive a plot of
land equal to 1400m2 and they also have the right to take an interest-free loan for purchasing
residence. Further all firms are obligated to arrange accommodation for their staff in
connection with employment (Pacione 2005). Before 2006 the right to own properties in
Dubai for foreign individuals and companies was limited. In 2006 the government declared
that no distinguish will be made between nationals and foreigners in purchase of properties in
Dubai (Dale 2006, Dubai Land Department). To transform Dubai into a leisure hub means
that more space may also be needed in order to guarantee sufficient hotel rooms and various
tourist attractions. The government’s incentive to turn the emirate into a global center may be
seen as an upward shift of the demand curve in figure 11.
The rotation of the capitalization rate in figure 11 is reasonable as the government’s ruling
strategies affect the economy of the emirate which is associated with changes in the real
interest rate.
Pacione discusses that the ruling strategies of the government are liberal and seeks to attract
foreign investments and reduce restrictions in the business environment. Further the writer
reports that both the public and private sector are working towards creating a simplified urban
expansion. Dubai, in addition, benefits from access to sufficient land in form of dessert,
political stability and strong inward flows of capital. The emirate has no legacy of industrial
failures and makes planned business agreements and is proceeding with a clear vision of
becoming a city of significance (Pacione 2005). This gives the impression of a responsive
construction environment bearing in mind that there possibly are bottlenecks in the sector
similar to the bottlenecks in the real estate sector which Bakheet et. al discusses. However,
following Pacione’s discussion it seems as if the determination of the government to expand
Dubai does not bring along changes directly in the construction environment but it rather
reflects the position of the f (c) curve. Therefore, the f (c) should not shift but rotate
downwards to show that the construction environment becomes rather inelastic (vertical).
22This may be seen as a response to the incentive of the government, which rather transforms
the construction environment into a less restrictive environment in order to expand Dubai.
The new position of the f(c) curve also means that the construction sector is less sensitive
towards changes in the price level. The final outcome of the curve is seen in figure 11.
In summary, as seen in figure 11, the ruling strategies of the government may lead to
increasing demand for use of space as the purpose is to stimulate growth. The increase in
demand makes the rent level rise and by that also the prices of the assets, further because of
changes in the capitalization rate curve. Less restrictive construction environment along with
changes in demand for real estate use and assets should further increase the level of
construction and automatically the stock of space available in Dubai.
Figure 11 The effect of the government’s incentive to promote growth on the real estate market of Dubai
236. Concluding remarks
According to the four-quadrant model economic growth, access to oil, population growth and
the incentive of the government to promote growth should lead to an increase of the
construction activities and thereby an expansion of Dubai. In response to economic growth,
population growth and the incentive of the government the square in the middle of every
figure expands whereas access to oil only results in a shift of the square. This can be
explained by the fact that access to oil in Dubai’s case does not affect the demand curve nor
the capitalization rate but only the cost curve. Rest of the factors change the demand curve,
capitalization rate and the cost curve hence expanding the square in the middle of the models.
The final impact should, however, be an increase of the construction level and stock of space
in every case. Sizes of the squares could have been different if considering the inclinations
and specific changes of the different curves, but the purpose has been to show how different
factors generally could have affected the real estate market in Dubai.
Economic growth, population growth and the incentive of the government mean that the
demand for use of space and assets increase, resulting in higher rent and price level. The
demand for assets increases additionally due to decline in the long-term interest rate. All the
three factors are believed to improve the construction environment, hence further increasing
the construction activities in the emirate. Due to the independence of oil, its access does not
fluctuate the markets dramatically. However, due to its benefits in terms of added income it
may be assumed that construction financing is simplified and therefore leading to an increase
of the construction supply.
In section 5.2 it was shown that the rent and the price level fall whereas in the other cases they
increase. By the year 2007 oil only contributed to 3% of the GDP and was rather regarded as
an extra source of income as stated in UAE Yearbook 2008. Therefore it may be logical to
believe that this solely leads to a shift of the f (c) to the right, leaving all the other curves
unchanged. According to the model if supply increases leaving demand unchanged, the rent
falls. Decline in rents and unchanged interest rates are not relatively attractive factors for
investors which result in reduction of the price level.
Even though this paper observes how the construction sector in Dubai may have benefited
from different factors in recent years it is important to remark that it does not mean that the
24emirate has a real estate market exempted of problems. Bakheet et al. discuses some of the
bottlenecks such as slow adjustments of laws and regulations towards the rapid growth of the
real estate sector and the fact that private companies are not supported in the same manner as
the public companies. Even though the bottlenecks may affect the construction environment
negatively, in the long run it cannot reduce the construction level and the stock of space from
the previous level and amount. However, it may perhaps prolong the time for the market to
reach a steady state. As economic growth, population growth and the incentive of the
government are assumed to increase the demand for use of space, DiPasquale and Wheaton
mean (1996) that then it must lead to an increase of the stock of space. The exact increase
depends on the inclination and the specific changes of the curves. In other case the four-
quadrant model is not consistent. Further, this paper shows that the growth of the real estate
market in Dubai during 2000-2007 has not only been a speculation but the city has had strong
advantages such as economic growth, access to oil, population growth and a determined
government which have contributed to an expansion of the real estate market in the emirate.
With the current financial crisis it is not known what the following years have in hold.
Perhaps the urban growth in Dubai may continue in the same manner or perhaps take another
direction: only time will tell.
25References
Bakheet, B. et al. (2004), “Real Estate Sector in Dubai”, Sectoral report, Dubai Chamber of
commerce and industry, Dubai.
(2008-10-
01)
Bakheet B. and Rettab, B. (2005), “Dubai Construction Sector”, Sectoral report, Dubai
Chamber of commerce and industry, Dubai.
(2008-10-
01)
Blanchard, O. (2003), Macroeconomics, Prentice-Hall, New Jersey.
CBS NEWS (2007-10-14), Dubai 60 minutes,2 CBS Corporation, New York.
< http://www.cbsnews.com/stories/2007/10/12/60minutes/main3361753.shtml>(2008-10-15)
Central Bank of the UAE, “Qualified Monetary Instruments”
< http://www.centralbank.ae/tools.php> (2009-01-05)
Cooper J, P. (2006-06-05), “Negative real interest rates sustain Dubai property boom”, AME
Info, Dubai. < http://www.ameinfo.com/87935.html> (2009-01-05)
Dale, L. (2006-05-01), “Law No. (7) of 2006 concerning Real Property Registration in the
Emirate of Dubai”, Property World Middle East.
< http://www.propertyworldme.com/content/html/1333.asp> (2008-11-18)
Department of economic development in Dubai (2007-04-22), “Dubai Economy”
< http://www.dubaided.gov.ae> (2008-10-05)
DiPasquale D. and Wheaton W. (1996), Urban economics and real estate markets, Prentice-
Hall, New Jersey.
Dubai Government Information and Services Portal (2007), “Dubai Strategic Plan 2015,
< http://www.dubai.ae/en.portal> (2008-12-28)
Dubai Statistics (2008-05-01)
Dubai Chamber of commerce and industry (2006), “GDP of construction sector Dubai 1995-
2006”, Dubai Chamber of Commerce and Industry-Data Management and Business Research,
Electronic library.
(2008-10-31)
Dubai Land Department, “Rules and regulations”
(2008-11-20)
2
The whole documentary also available on www.youtube.com
26Eurostat, “Economy and finance” < ec.europa.eu/eurostat/> (2009-01-21)
Exportrådet (2007), ”Landrapport Förenade Arabemiraten”,
(2008-04-28)
IMF (2007), United Arab Emirates, Country report 07/347, International Monetary Fund,
Washington DC. (2008-10-07)
IMF (2007), United Arab Emirates: Statistical Appendix”, Country report 07/348,
International Monetary Fund, Washington DC.
(2008-10-22)
Karlsson D. and Kindblom H. (2006), “How can a place conquer a position in the mind of
potential business investors? A case study on Dubai”, undergraduate thesis on D-level,
Stockholm University.
Lans, K. (2008-02-17), “Dubai - Mellanösterns Ikaros?” Dagens Industri.
(2008-05-
01)
World Atlas < http://www.worldatlas.com/aatlas/world.htm> (2008-11-21)
27Appendix I
Figure 12 The location of Dubai Source: World Atlas
Appendix II
As UAE is a member of the OPEC (organization of the petroleum exporting countries), data
of its yearly basket price between the years 2000-2007 has been regarded as the benchmark in
section 5.2. The OPEC basket contains of crude oil from Algeria, Angola, Ecuador, Indonesia,
Islamic Republic of Iran, Iraq, Kuwait, Libya, Nigeria, Qatar, Saudi Arabia, UAE and
Venezuela.
Year OPEC yearly basket price:
2000 27,6
2001 23,12
2002 24,36
2003 28,1
2004 36,05
2005 50,64
2006 61,08
2007 69,08
Table 1 OPEC yearly basket price Source: OPEC
28You can also read