Plugged In:
How Americans
Charge Their Electric Vehicles
Findings from the largest plug-in electric vehicle
infrastructure demonstration in the world
←
→
Page content transcription
If your browser does not render page correctly, please read the page content below

Plugged In: How Americans Charge Their Electric Vehicles Findings from the largest plug-in electric vehicle infrastructure demonstration in the world
Building the Laboratory
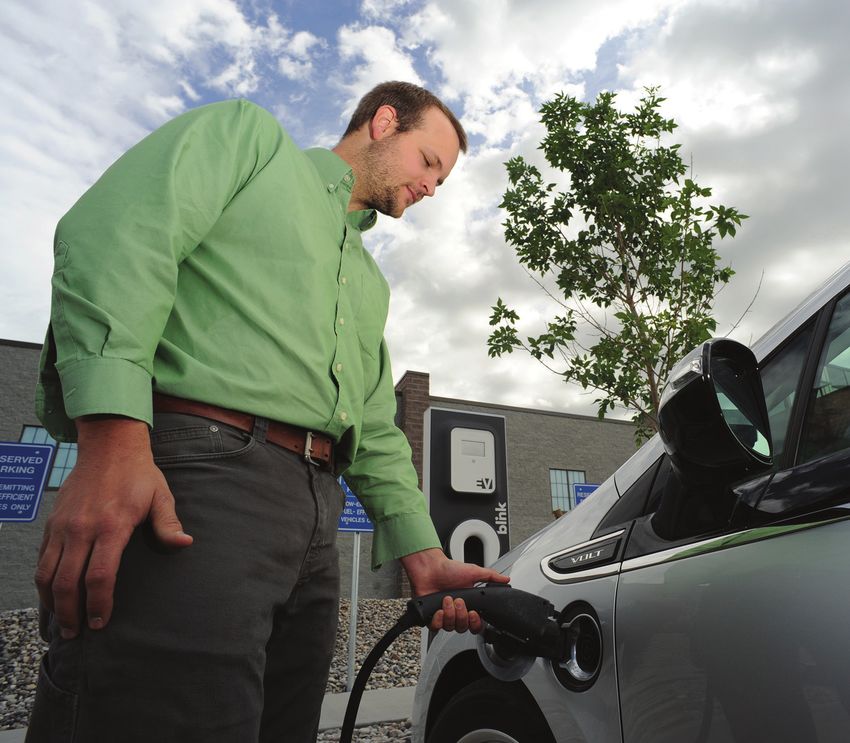
Widespread adoption of plug-in electric vehicles (PEVs) has
the potential to significantly reduce our nation’s transportation
petroleum consumption and greenhouse gas emissions.
Barriers to PEV adoption Chevrolet Volts and more for researchers to collect
remain, however. One of than 300 Smart ForTwo and analyze data from their
the most commonly cited Electric Drive vehicles in home charging units and
barriers is the need for places Car2Go car-sharing fleets their PEVs. Data also was
for PEV drivers to plug in their were enrolled in the project. collected from publicly
vehicles. How many and what accessible charging stations
kind of charging stations are This project was not just installed at a wide variety
needed? Where and how about installing charging of venues in and between
often do PEV drivers charge? infrastructure; the pur- metropolitan areas around
pose was to build a living the United States.
To answer these questions, laboratory to study its use
the U.S. Department of and learn. Data collected from vehicles
Energy launched The EV and charging infrastructure
Project and the ChargePoint To accomplish this, Idaho over the 3-year project
America project. Combined, National Laboratory part- period captured almost 125
these projects form the nered with the Blink Net- million miles of driving and
largest PEV infrastructure work, ChargePoint, General 6 million charging events,
demonstration in the world. Motors and OnStar, Nissan providing the most com-
Between Jan. 1, 2011, and North America, and Car2Go prehensive view of PEV and
Dec. 31, 2013, this com- to collect and analyze data charging usage to date.
bined project installed from the electric vehicle
nearly 17,000 alternating charging stations and vehi- Through partnerships with
current (AC) Level 2 charging cles enrolled in the project. states, municipalities, elec-
stations for residential and tric utilities, local business
commercial use and over 100 Private vehicle owners owners, and numerous other
dual-port direct current (DC) participating in the project stakeholders, The EV Project
fast chargers in 22 regions had an AC Level 2 (240-volt) and ChargePoint America
across the United States. charging unit installed in installed charging stations in
More than 8,000 privately their residences. In return, 22 regions across the United
owned Nissan Leafs and they gave written consent States, shown in Figure 1.
1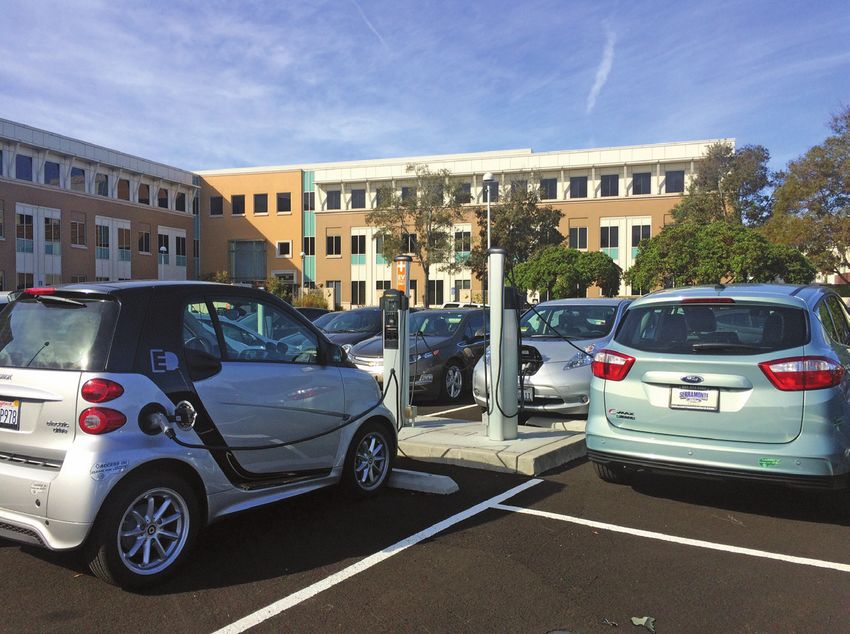
THREE                     Years

                                        8,300                     EVs

                                       22
                                       125 Million
                                                                  Regions in the U.S.

                                        6
 Figure 1.                                                        Miles of driving
 Areas where public
 charging infrastructure
 was installed and                                                Primary project partners
 vehicles were enrolled
 in The EV Project and
                                                                  Million charging events
 ChargePoint America.

                               Seattle,                                       Memphis, TN
                               Tacoma, WA
                                                                              Chicago, IL
                                                                              Nashville, TN
        Portland,                                                             Michigan
          Salem,
         Eugene,
     Corvallis, OR                                                                                  Boston, MA
                                                                                                    New York City, NY
                                                                                                    Philadelphia, PA
  San Francisco,
Sacramento, CA                                                                                      Washington, DC

Los Angeles, CA                                                                                     Knoxville, TN
                                                                                                    Chattanooga, TN
 San Diego, CA

                                                                                      Atlanta, GA
                     Phoenix, AZ
                                                                                                    Public AC Level 2 charging
                                   Tucson, AZ                                                       stations installed
                                                                           Florida                  Public DC fast chargers installed
                                                 Austin,   Houston, TX
                                                                                                    Chevrolet Volts enrolled
                                         San Antonio, TX
                                                           Dallas,
                                                                                                    Nissan Leafs enrolled
                                                           Ft. Worth, TX

 2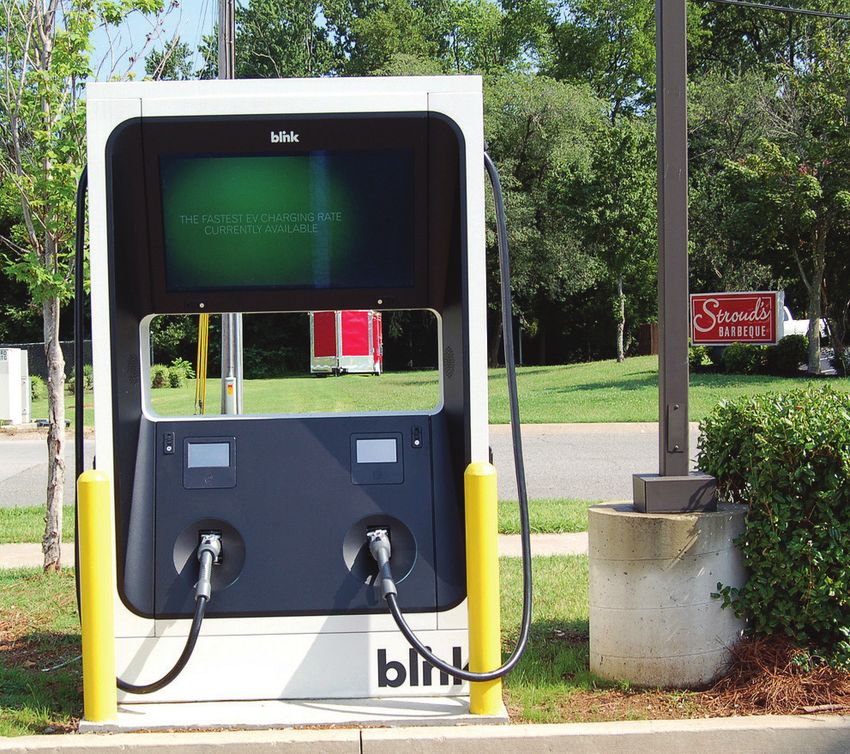
What Have We Learned?
With gas stations seemingly stations can be installed stations in a wide variety away-from-home charging
on every block, it would where gas stations cannot – of locations, including locations, and one or more
seem logical to expect at people’s homes, work- homes, workplaces, stores, of these locations was at
that a similarly ubiquitous places, and destinations restaurants, gas stations, work for some drivers.
network of public charging where their cars spend and many other venues,
stations would be needed a long time parked. The to allow researchers to This is not to say that public
to refuel, or rather, recharge project installed AC Level observe where PEV drivers charging stations are not
PEVs. However, charging 2 and DC fast charging charge. Would they plug in necessary or desirable.
Many DC fast chargers (all
This study is the largest plug-in electric vehicle of which were accessible
to the public) experienced
infrastructure demonstration in the world. heavy use to support both
in-town and inter-city
around town at the nearest driving. Also, a relatively
charging station, following small number of public AC
the pattern they followed Level 2 public charging
with the gas-powered cars sites saw consistently high
they grew up with, or would use. This begs the question:
they adopt a new refueling what is it about the small
paradigm and charge at the number of highly used
few places where they park charging sites that led to
their cars for the longest their popularity?
periods of time?
There was some correlation
The answer was clear: between public charging
despite the installation of location characteristics and
extensive public charging utilization. Public Level 2
infrastructure in most of the charging stations installed
project areas, the majority in locations where vehicles
of charging was done at were typically parked for
home and work. About half longer periods of time
the project participants often were, in fact, among
charged at home almost those most often used.
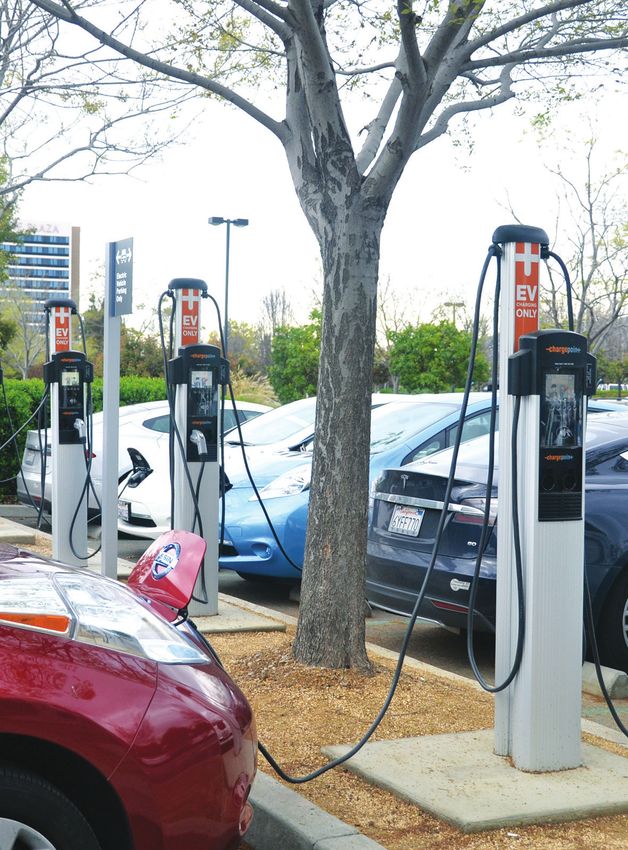
exclusively. Of those These locations included
who charged away from shopping malls, airports
home, the vast majority and commuter lots, and
favored three or fewer downtown parking lots or
Photo courtesy of ChargePoint
3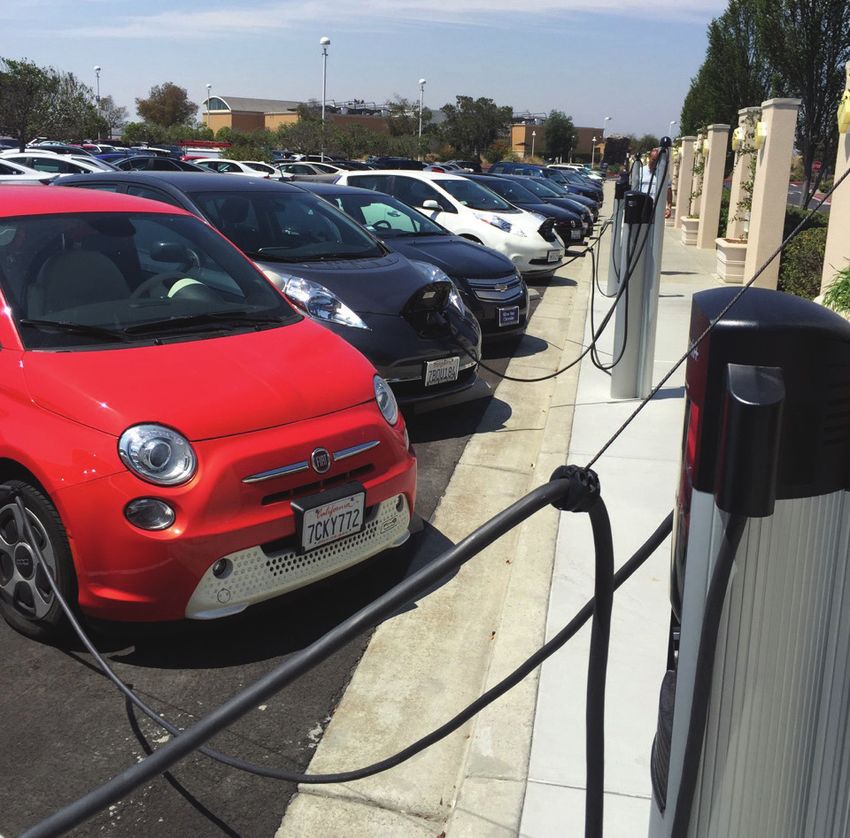
garages with easy access        highly utilized charging       locations that did not
                    to a variety of venues. Also,   sites in almost every region   experience much use.
                    not surprisingly, public        and at venues that did not
                    charging station utilization    seem to be well-suited for     In the end, it is apparent
                    was higher in regions with      charging. Conversely, there    that the exact factors that
                    higher PEV sales. However,      were also many charging        determine what makes a
                    there were examples of          sites in seemingly ideal       public charging station
                                                                                   popular are predominantly
                                                                                   community-specific.
To support PEV driving, charging infrastructure should be                          More research is needed
focused at home, workplaces, and in public “hot spots” where                       to pinpoint these local
                                                                                   factors. Nevertheless, to
demand for Level 2 or DC fast charging stations is high.                           support PEV driving, the

4
project demonstrated that       host, but when they were        drivers of the Chevrolet         The next section of this
charging infrastructure         used, they provided a vital     Volt, an extended-range          report provides the basis
should be focused at home,      function to the driver.         electric vehicle, tended to      for these conclusions by
workplaces, and in public                                       charge more frequently           summarizing what we have
“hot spots” where demand        Regardless of motiva-           and to more fully deplete        learned about…
for Level 2 or DC fast          tion for installing public      their vehicle’s battery than
                                                                                                 • PEV driving patterns and
charging stations is high.      charging infrastructure, the    drivers of the Nissan Leaf,
                                                                                                   charging preferences

                                                                                                 • Away-from-home
Public and workplace charging infrastructure enabled
                                                                                                   charging for range
drivers to increase their electric driving range, although                                         extension

most drivers did not charge away from home frequently.                                           • Workplace charging

                                                                                                 • Public charging station
Naturally, there are excep-     project found that public       a battery electric vehicle.        use
tions to this rule. There       charging stations were          This allowed the overall
                                                                                                 • Charging at home
may be reasons for an           more expensive to install       group of Volts studied to
organization to install         than residential and work-      average nearly as many           • Charging infrastructure
public charging stations        place units. Installation       electric vehicle (EV) mode         installation costs.
even if they are not used,      costs also varied widely        miles traveled as the Leafs
such as to attract a certain    by region and by venue.         in the project. Finally, based   The final section of this
customer demographic,           This further emphasizes         on observed charging             report provides examples
communicate a “green”           the benefit of focusing the     patterns, the project found      of how the findings of this
image, or encourage PEV         bulk of charging infrastruc-    that there are opportunities     project have helped organi-
adoption. The project did       ture at home, work, and         to use pricing structures        zations promote or prepare
not study the effectiveness     strategic public charging       and other policies to            for PEV adoption.
of charging infrastructure      locations.                      manage demand for PEV
in meeting these goals.                                         charging, both in terms of
Additionally, DC fast char-     The project shed light on       charging station through-
gers along travel corridors     other facets of PEV use.        put at charging hot spots
were found to effectively       It found that public and        and electricity demand on
enable long-distance range      workplace charging infra-       the electric grid.
extension for battery elec-     structure enabled drivers to
tric vehicles. These chargers   increase their electric driv-
were not typically used         ing range, although most
frequently so their value is    drivers did not charge away
hard to quantify from the       from home frequently. It
perspective of the charger      was also discovered that

                                                                                                                             5
What have we learned about PEV driving
     patterns and charging preferences?
     By focusing on data                         Volt drivers averaged only              vehicles like the Leaf and
     collected in 2012 and                       6% fewer EV miles per year              range-extended electric
     2013 from over 4,000 Leafs                  than Leaf drivers, despite              vehicles like the Volt, which
     and 1,800 Volts across the                  having less than half as                has an internal combus-
     United States, the project                  much battery energy stor-               tion engine that allows
     provided insights into how                  age capacity. There were                the vehicle to continue
     PEV early adopters drove                    two reasons for this. First,            driving after the battery

6%
     and charged their vehicles.                 Volt drivers tended to fully

     Volt drivers averaged only 6% fewer EV miles per year than
     Leaf drivers, despite having less than half as much battery
     energy storage capacity.

     Volt drivers averaged slightly              deplete their batteries prior           is depleted. Second, Volt
     more miles traveled annually                to recharging, whereas Leaf             drivers plugged in more
     than the 2013 national aver-                drivers favored recharging              often than Leaf drivers.
     age, while the Leafs studied                with significant charge                 Volts were charged an
     were driven noticeably less                 left in their batteries. This           average of 1.5 times on
     than the national average                   is an expected difference               each day the vehicle was
     (see Table 1).                              between pure electric                   driven, whereas Leafs were
                                                                                         charged 1.1 times per day
                                                                                         driven, on average. Much
      Table 1
                                                                                         of the difference between
                                                                          National       Leaf and Volt charging fre-
                                               Leaf          Volt         Average1       quency is attributed to the
      Average annual vehicle                                                             fact that Volts were charged
      miles traveled                          9,697         12,238          11,346       more often during the day
      Average annual electric                                                            at home.
      vehicle miles traveled                  9,697          9,112              –
       Office of Highway Policy Information, Federal Highway Administration, “Highway
      1

       Statistics 2013-Table VM-1,” January, 2015, www.fhwa.dot.gov/policyinformation/
       statistics/2013/vm1.cfm

6
Average driving distance                                                                seasonal variation in
                                                    and charging frequency                                                                  average monthly distance
                                                    were consistent over time                                                               traveled for the last 15
                                                    as the number of vehicles                                                               months of the project.
                                                    reporting data increased,                                                               Charging frequency (not
                                                    with only slight seasonal                                                               shown) followed the same
                                                    variation. Figure 2 shows                                                               up-and-down trend.

                                         1,200                                                                                                                                                                               Figure 2.
Average distance driven per month (mi)

                                                            Volt average monthly VMT
                                                                                                                                                                                                                             Average monthly vehicle miles
                                         1,000                                                                                                                                                                               traveled varied seasonally
                                                                                                            Leaf average monthly eVMT
                                                                                                                                                                                                                             but was otherwise consistent
                                          800
                                                                                                                                                                                                                             over time.
                                                                                                                     Volt average monthly eVMT
                                          600

                                          400

                                          200

                                            0
                                                 Oct 2012
                                                             Nov 2012
                                                                        Dec 2012
                                                                                   Jan 2013
                                                                                              Feb 2013
                                                                                                         Mar 2013
                                                                                                                    April 2013
                                                                                                                                 May 2013
                                                                                                                                             June 2013
                                                                                                                                                         July 2013
                                                                                                                                                                     Aug 2013
                                                                                                                                                                                Sept 2013
                                                                                                                                                                                            Oct 2013
                                                                                                                                                                                                       Nov 2013
                                                                                                                                                                                                                  Dec 2013

                                                                                                                                                                                                                                                             7
Preference for charging             Over the weekend, daytime      spread their charging across
                              frequency and location              charging preference for        many locations, but most
                              Overall, Leaf and Volt              both Leafs and Volts shifted   had just a few favorite
                              drivers performed most              slightly from away-from-       places to charge outside of
                              of their charging at home           home locations to at home.     home (see Figure 4). Many
                              (see Figure 3). Nearly all          Overnight charging pat-        drivers performed a vast
                              overnight charging was at           terns remained the same on     majority of their away-from-
                              home. Daytime charging              weekdays versus weekend        home charging at only one
                              was split between home              days, with both groups of      location. Much of this can
                              and other locations, includ-        vehicles averaging a charge    be attributed to workplace
                              ing work.                           nearly every night.            charging.

                                                                  Drivers of 5% of Volts and
             Away                                 Away            13% of Leafs only ever
             16%                                  13%
    Leaf                            Volt                          charged at home, and
                                                                  about half the drivers
                                                                  charged away from home
       Home 84%                         Home 87%                  less than 5% of the time.
                                                                  Of the drivers that charged
                                                                  away from home, some

           Figure 3.
           Leaf and Volt drivers performed most
           of their charging at home.

                                        92%
                                                            Number of away-from-home
                                                            locations where drivers did most
                                 77%                        of their charging
                                                                                                 Figure 4.
                                                                Volt drivers
                                                                Leaf drivers                     92% of Volt drivers and 77% of
                                                                                                 Leaf drivers did most (at least
                                                                                                 80%) of their away-from-home
                                                                                                 charging at three or fewer
                                                                                                 locations.

                                                                                  14%
                                                  6%
                                                           2%      3%                     4%
                                                                            1%
                                 3 or fewer            4                5        More than 5

8
Preference for charging of using any charging Each driver used a different stations. For Leaf drivers
equipment equipment available to mix of charging equipment charging away from home
Both the Leaf and the them. types when charging away in areas where DC fast char-
Volt come with AC Level 1 from home, depending on gers were installed, some
charging cords. They are For the Volts collectively, their preference and what chose to only charge using
also compatible with AC about half of away-from- was available. Some Volt Level 1 or Level 2 charging
Level 2 charging stations home charging was done drivers chose only Level 1 equipment, some mixed
that use SAE J1772- using Level 2 equipment. charging, which includes Level 1, Level 2, and DC fast
compliant connectors. The other half was Level 1 standard 120-volt outlets, charging, and a small num-
All Leafs enrolled in the charging using a dedicated while others chose a mix ber of drivers only charged
project also were capable charging station or a stan- of Level 1 and Level 2 using DC fast chargers (see
of charging using DC fast dard 120-volt outlet. charging. Some only ever Figure 5).
chargers with CHAdeMO- used Level 2 charging
compliant connectors. All For Leafs, 8% of away-from-
project participants had home charging events
a Level 2 charging unit was performed using DC
installed in their homes. fast chargers. The rest was
When charging away from AC Level 1 or AC Level 2
home, they had the option charging.
VOLT LEAF
6 54 40 % % %
63 36 1 % % %
Level 1 only Level 1 and Level 2 only Level 1 or Level 1 or DCFC only
Level 2 Level 2 only Level 2
and DCFC
Figure 5.
How Volt and Leaf drivers
charging away from home
chose between charging equip-
ment types.
9What have we learned about away-from-home
charging for range extension?
PEV drivers who plugged in away from home tended to
drive more EV miles (see Table 2). In fact, drivers who fre-
quently used away-from-home charging stations averaged
Away-from-
72% more daily miles on electricity alone than drivers who
Away-from- home charging
home charging never charged away from home.
Table 2
Tendency to charge away
from home: Never Sometimes2 Frequently3 Most of the time4
75%
Leaf average daily driving
25 31 43 32
distance (mi)
75%
Volt average daily driving
25 29 40 20% 26
distance in EV mode (mi)
2
>0 to 30% of all charging events 3
>30 to 60% of all charging events 4
>60% of all charging events
20% All vehicles
studied
However, most drivers did not charge away from home
frequently (see Table 3), so the overall contribution to EV
All vehicles miles traveled was small.
studied
Table 3 Figure 6.
Tendency to charge away A small fraction of vehicles were
from home: Never Sometimes2 Frequently3 Most of the time4 responsible for the majority of
Percent of Leafs 13% 69% 14% 4% away-from-home charging.
Percent of Volts 5% 81% 13% 1%
2
>0 to 30% of all charging events >30 to 60% of all charging events
3 4
>60% of all charging events
All vehicles
studied
Overall, 20% of the vehicles studied were responsible
for 75% of the away-from-home charging. Much of
this away-from-home charging can be 20%
attributed to workplace charging
(see Figure 6).
75%
Away-from-home
charging
10What have we learned about workplace
charging?
A subgroup of project charging events either at home. This increased use
participants was identified home or work and only 2% of public charging on the
that had access to both at other locations. Charging weekend suggests that
home and workplace at work was free for many public charging still plays a
charging. Consistent with of these drivers, which may role in these drivers’ travel
conventional wisdom, Leaf have been one reason why routines.
98%
and Volt drivers with access they frequently charged
to home and work charging there.
performed the vast majority
of their charging at those On weekends and other
locations (see Figure 7). days when they did not
go to work, Leaf drivers
Considering only days averaged 8% of their
when drivers went to work, charging events at locations Of charging events were
the effect is even more other than home and Volt
performed at home and work
pronounced. PEV drivers drivers averaged 11% of
performed 98% of their their charging away from on work days.
Other Other
4% 3%
Figure 7.
Volt (left) and Leaf (right)
Work Work
39% 32% drivers with access to home and
workplace charging performed
nearly all of their charging at
those locations.
Home Home
Volt 57% 65% Leaf
11Range extension from On days when Leaf drivers Workplace charging as
workplace charging had to charge at work in a substitute for home
Workplace charging was order to complete their charging
found to be an effective daily commute, workplace About 30% of drivers only
range extender, allowing charging provided an charged at work on most
some Leaf owners to drive average of 15 miles of range days. This shows that
their Leaf to work even on extension required to make workplace charging could
days when their round-trip it home. The entire daily make PEVs viable for people
commute exceeded the commute on these days, without access to home
vehicle’s range based on which averaged 73 miles, charging.
home charging alone (see arguably was enabled by
Management of
6%
below). workplace charging.
workplace charging
%
Volt drivers saw similar PEV drivers demonstrated
electric range-extending that they adjust their
benefits from workplace charging habits based
OF DRIVERS DROVE A LEAF TO WORK EVEN charging. On days when on conditions, such as
THOUGH THEY COULD NOT MAKE IT BACK Volt drivers’ commutes were fees and rules for use.
8
HOME UNLESS THEY CHARGED AT WORK. long enough to require a Not surprisingly, drivers
charge at work in order to were less likely to plug
complete the commute on in at work if they had
electricity alone, workplace to pay to charge or if
OF LEAF DRIVERS COULD COMPLETE THEIR charging provided an addi- they were required to
DIRECT COMMUTE WITHOUT CHARGING AT tional 18.5 miles of EV driv- move their vehicle after
WORK, BUT THEIR ROUTINE ON MOST DAYS ing, on average. On these charging (and that rule
REQUIRED THEM TO DRIVE ADDITIONAL DIS- days, round-trip commutes was enforced). PEV drivers
TANCE, WHICH NECESSITATED CHARGING AT averaged 62 miles, with 57 also showed a willingness
40
WORK IN ORDER TO MAKE IT HOME. miles of EV range. to use communication
%
tools, such as social
Leaf and Volt drivers with media, to coordinate the
known access to workplace use of charging stations
charging in this study aver- with other employees.
aged 23% and 26% higher At work sites studied,
annual EV miles traveled there also was a culture
OF LEAF DRIVERS RELIED ON WORK- than the overall groups of common courtesy and
PLACE CHARGING ON AT LEAST ONE DAY of vehicles in the project, willingness to follow local
A MONTH TO COMPLETE THEIR DAILY respectively (see Figure 8). practices, such as a driver
COMMUTES. plugging in a neighboring
12car after unplugging his
vehicle. In many cases,
this self-management
by employers led to
exceptionally high
charging station utilization
and opportunity for a large
number of employees to
charge regularly.
Photo courtesy of Facebook
14,000 Figure 8.
13,759
VMT Volt and Leaf drivers with
12,000
Annual vechicle miles traveled
12,238 access to home charging and
VMT workplace charging (WPC)
10,000
had considerably higher
9,697 11,882 9,112 11,448 11,346
8,000 annual electric vehicle miles
eVMT eVMT eVMT eVMT VMT
traveled (eVMT) than the overall
6,000 project averages, and their eVMT
exceeded the national average
4,000 annual total vehicle miles
traveled (VMT).
2,000
0
All Leafs Leafs with All Volts Volts with National
WPC WPC average5
access access
5
Office of Highway Policy Information, Federal Highway Administration, “Highway Statistics 2013-Table VM-1,”
January, 2015, www.fhwa.dot.gov/policyinformation/statistics/2013/vm1.cfm
13What have we learned about public
charging station use?
Public Level 2 charging for an average of 8.6 hours
station usage (excluding per charge cord per day.
workplace charging units) The average time vehicles
was low overall. The median were plugged in for each
charging frequency per individual charge event
site was 1.4 charges per ranged from 4 to 42 hours,
week, with 75% of the with a median plug-in time
2,400 public Level 2 sites of 22.6 hours per event.
nationwide averaging four These types of locations are
or fewer charging events prime candidates for slower,
per week. However, popular lower cost Level 1 charging
public Level 2 sites saw very equipment.
high usage. Well-designed
charging sites at retail
stores, especially shopping
The most highly utilized DC fast chargers tended to be
malls, and parking lots and
garages serving multiple located close to interstate highway exits.
venues demonstrated the
potential to support from 7 DC fast chargers were used local vehicles as much or is needed to fully charac-
to 11 charges per day. much more frequently than more than they were used to terize public charging “hot
most public Level 2 stations, recharge vehicles traveling spots” and develop rules
Charging sites at venues with a median use frequency on the interstate. of thumb for identifying
where vehicles are parked of 7.2 events per week, public charging locations
for long periods of time, based on averaging each Public charging station with potential for high
like airports, ride-share fast charger’s use over the usage varied significantly utilization.
parking lots, or parking lots course of the entire project. by region, with average
at public transit stations, A quarter of the fast chargers utilization rates generally
should not be measured averaged over 15 events per tracking with regional
by the number of events week, and one unit aver- PEV sales. However, highly
per week, but rather by the aged 70 events per week. utilized individual public
time vehicles spent con- The most highly utilized DC charging sites were found
nected to charging stations fast chargers tended to be in most regions, proving
in a day or week. In the located close to interstate that public charging station
project, these kinds of sites highway exits. Interestingly, utilization is dependent on
had vehicles connected these units were used by local factors. More research
14How did public usage Blink DC fast chargers 19.5 minutes. When the Blink
change over time? were initially free and Network began charging
As mentioned, overall usage usage increased quickly. a per-session fee to fast
of public Level 2 charging However, usage dropped charge, the average time
stations was low, but it dramatically when the Blink spent charging increased
slowly increased over the Network implemented a by 20%. Drivers presumably
course of the projects, with usage fee in the summer stayed connected longer to
usage of ChargePoint units of 2013. Data provided by get their money’s worth.
19.5
increasing at a faster rate the Blink Network after the
than Blink units on average end of the project showed
nationwide (see Figure 9). that average Blink DC fast
The cost to use public Level charger usage bottomed
2 charging stations varied out in early 2014 and then
from site to site. Most Blink steadily increased, reaching
public units charged a fee 2.4 charging events per day
after September 2012. Many by the end of 2014.
ChargePoint public stations
The average number of minutes in
were free through the end Prior to the onset of fees, a Blink DC fast charger session prior
of the project, but the exact Blink DC fast charger
number is not known. sessions lasted an average of to the onset of fees.
4.0 Figure 9.
Blink DC Fast Chargers Blink DC fast charger usage fell
3.5
dramatically in the middle of
ChargePoint Public Level 2
Number of charging events
3.0 2013, coinciding with the onset
Blink Public Level 2 of fees for use, but increased
per station day
2.5 again in the second half of 2014.
2.0
1.5
1.0
0.5
0
Q4 2012
Q1 2013
Q2 2013
Q3 2013
Q4 2013
Q1 2014
Q2 2014
Q3 2014
Q4 2014
15What have we learned about charging at home?
When do they charge? or their home charging unit charge delay setting when
PEV owners have the option to delay charging. Of those they plug in away from
of delaying the start of who chose to delay their home during the day.
charging electronically, charging using these tools,
allowing them to plug in about half programmed Participants in the project
their vehicle at a convenient their charging unit and half left their vehicles plugged
time but not start consum- programmed their vehicle. in at home overnight for
ing electricity from the grid Some customers chose to an average of 12 hours
until later, such as when program their charging per charge. The vehicles
electricity prices are lowest. unit, rather than their always required less than
Project participants could vehicle, to avoid needing 5 hours to fully charge at
program either their vehicle to override the vehicle’s home using the Level 2
charging units, and usually
only took 1 to 3 hours to
The vehicles always required less than 5 hours to fully charge completely. This
charge at home using the Level 2 charging units, and means that even though
most vehicles were plugged
usually only took 1 to 3 hours to charge completely. in for the night by 10 p.m.,
16overnight charging at home the cheapest time to charge time” scheduling function
typically could be delayed was between midnight and is helpful for the electric
until the early morning 5 a.m., most PEV owners grid, because it essentially
hours when overall demand programmed their charging randomizes the charge start
on the electric grid is the to start at midnight or 1 a.m. time from household to
lowest. In fact, many electric (see Figure 10). household, thus preventing
utilities offer reduced home all vehicles from initiating
electricity prices during The Volt and Leaf both offer charging at the same time,
off-peak times to incentivize a charge scheduling option such as the start of the off-
their customers to shift that allows the owner to tell peak period.
electricity consumption the vehicle what time they
off peak. PEV owners in plan to depart on their next 12 noon 12 midnight
0.06 MW 0.7 MW
the project in areas where trip. The vehicle chooses 11 p.m.
0.16 MW
utilities offer cheaper rates what time to start charging,
at night showed a willing- based on how empty the
2 a.m. 1.0 MW
ness to delay charging at battery is and how much
home until these off-peak time it calculates it needs
9 a.m. 0.05 MW 3 a.m. 0.7 MW
periods. In San Diego, where to charge. This “depart-by 9 p.m. 0.19 MW 3 p.m. 0.1 MW
4 a.m. 0.3 MW
1.2
5 p.m. 0.15 MW
1.0
Home Charging Demand (MW)
6 a.m. 0.03 MW
6 p.m. 0.18 MW
0.8
0.6
0.4 Figure 10.
The total power drawn over the
0.2 course of a day by all EV Project
vehicles charging at home on a
0 typical weekday in San Diego.
6 a.m. 12 p.m. 6 p.m. 12 a.m.
Time of Day
17What have we learned about
charging station installation costs?
$1,354
RESIDENTIAL LEVEL 2 AVERAGE INSTALLATION Installation cost for residential, workplace, and public
charging stations was documented for the Blink stations
installed in the project. Residential Level 2 unit installation
cost ranged from a few hundred dollars to over $8,000. The
average residential installation cost was $1,354. This aver-
age was driven up by expensive installations that required
upgraded electrical service, which was often necessary in
$2,223
WORKPLACE LEVEL 2 AVERAGE INSTALLATION older homes. Cost varied regionally based on electrician
labor wages and permitting fees.
The installation cost of public Level 2 charging stations
ranged from $600 to $12,660, with an average cost of
$3,108. Cost primarily depended on the distance from the
$3,108
PUBLIC LEVEL 2 AVERAGE INSTALLATION facility’s electrical panel to the charging station location,
and varied regionally due to labor costs.
Workplace Level 2 charging unit installations averaged
$2,223, or 28% less than the average public Level 2 unit
cost. This difference was attributed to workplaces having
more flexibility in choosing the locations of their charging
$22,626
BLINK DC FAST CHARGER AVERAGE INSTALLATION stations and the type of equipment to be installed.
However, employers that installed additional charging
stations often found the second round of installations to
be more expensive because the inexpensive locations had
been taken already.
Blink DC fast charger installation cost in the project
ranged from $8,500 to over $50,000, with an average cost
of $22,626. This average actually may be artificially low,
because installation proposals that exceeded a spending
limit were turned down. Many DC fast charger installations
required the addition of electrical service to support the
chargers’ 60-kW power rating and requirement for 480-volt
3-phase power. This significantly increased the installation
cost. As with Level 2 units, costs varied regionally depend-
ing on permitting requirements and labor costs.
18How have the findings of this project helped
organizations promote or prepare for PEV adoption?
Project staff had the goal National policy makes recommendations to Analysis of data collected
of disseminating as many recommendations the federal government and from PEVs and charging
findings as possible from Project researchers provided others on actions to take or stations in Washington was
the project to help other the National Research avoid to enable the adoption performed for the
organizations in their Council of the National of PEVs by the mass market. Washington State
efforts to accelerate PEV Academy of Sciences with Department of
adoption. Researchers at numerous presentations State infrastructure Transportation (WSDOT).
Idaho National Laboratory and reports to help them planning decisions WSDOT incorporated
were specifically assigned prepare the recently released The California Air Resources findings of this work into
to regularly publish reports report “Overcoming Barriers Board, the California Energy the Washington State
and present results to key to Deployment of Plug-in Commission, and the Electric Vehicle Action Plan.
government and industry Electric Vehicles.” This 204- California Public Utilities The plan details WSDOT’s
stakeholders. Here are some page report is the result of Commission solicited expectations and plans to
examples of the organi- an intensive 2-year study information from project achieve the Washington
zations and efforts that conducted by the National researchers about away- governor’s goal of 50,000
benefitted from the project: Research Council for the U.S. from-home charging electric vehicles on the road
Department of Energy and observed in The EV Project in the state by 2020.
and ChargePoint America in
California to guide develop- Regional electric utility
ment of sustainable public planning
charging infrastructure PEV charging patterns were
for the growing number analyzed and presented to a
of PEVs in California. The group of seven electric utili-
information provided ties based in the Northeast,
assisted the California called the Regional Electric
Energy Commission in Vehicle Initiative. The
validating model assump- work analyzed diversity
tions used in its Statewide patterns and coincidence
PEV Infrastructure Plan, and of PEV charging with utility
ultimately fed into the PEV system loads. The utilities
Infrastructure Assessment requested this information
that was presented to the to guide decisions regard-
Air Resources Board in ing system planning, rate
October 2014. design, and development of
Photo courtesy of ChargePoint rate/program strategies to
mitigate system impacts.
19Vehicle regulation from five automakers (Ford, Numerous organizations were provided with special reports
As an independent third GM, Nissan, Honda and or presentations to aid their research, planning or policy
party, Idaho National Toyota) were included. decisions related to electric vehicles and charging infra-
Laboratory performed anal- structure design, promotion and environmental impact.
ysis of PEV driving data from Other partners and These groups include the following:
the project and additional beneficiaries
• Argonne National Laboratory • National Academy of Sciences
data sets and presented Analysis results and findings
• Arizona Public Service Committee on Overcoming Barriers
results to the California Air published over the course
• California Air Resources Board to EV Adoption
Resources Board to support of the project have been
• California Energy Commission • National Renewable Energy
deliberations between used by a host of other
• Cardiff University, UK Laboratory
the Air Resources Board organizations, including
• Center for Climate and Energy • Oak Ridge National Laboratory
and automakers about the standards development
Solutions (formerly the Pew Center • Oncor Electric Delivery
redefinition of zero-emis- committees, other auto
on Global Climate Change) • Pacific Gas & Electric
sion vehicle credits. A companies and electric
• City of Chattanooga, TN • PacifiCorp
revision to this regulatory utilities in the United States
• City of Knoxville, TN • PECO Energy Company
framework applied to and abroad, PEV charging
• Clinton Foundation - • Portland General Electric
cars sold in California, the equipment manufacturers,
Clinton Climate Initiative • Public Utility District No. 1 of
largest market in the United facilities management
• Colorado State University Snohomish County
States, would potentially companies, PEV advocacy
• Columbia Hospitality • Puget Sound Energy
shift billions of research groups, and federal and
• Commonwealth Edison Company • Sacramento Municipal Utility
and development dollars state government agencies
• Delaware Valley Regional Planning District
at various auto companies. to inform PEV and charging
Commission • Salem Electric
The study was performed infrastructure design and
• Electric Drive Transportation • Salt River Project
on a data set of 158,000,000 deployment decisions, elec-
Association • San Diego Gas & Electric
miles from 21,000 vehicles tricity grid load forecasting,
• Energy & Environmental Resources • Seattle City Light
operated throughout the cost/benefit analyses, and a
Group, LLC • Seattle University
United States. Eight models variety of other endeavors.
• Eugene Water & Electric Board • Southern Company
• Harvard University • Tucson Electric Power
For more information about The EV • International Energy Agency • Union of Concerned Scientists
• Georgia Power • University of California - Davis
Project and ChargePoint America, • Green Mountain College Institute for Transportation Studies
• London Hydro, Inc. • University of Central Florida
including publications detailing • Los Angeles Department of Water • University of Georgia
& Power • University of Texas Austin
additional findings and lessons • Memphis Light Gas & Water • Vermont Energy Investment
learned, visit avt.inl.gov/evproject • Middle Tennessee Electric Corporation
Membership Corporation • Wall Street Journal
and avt.inl.gov/chargepoint. • Nashville Electric Service • Washington State Department of
Transportation
20About Idaho National Laboratory
Idaho National Laboratory is one of the U.S. Department
of Energy’s 10 multiprogram national laboratories. The
laboratory performs work in each of the U.S. Department
of Energy’s strategic goal areas: energy, national security,
science, and the environment. Idaho National Laboratory
is the nation’s leading center for nuclear energy research
and development. Day-to-day management and oper-
ation of the laboratory is the responsibility of Battelle
Energy Alliance.
21For more information about INL, visit www.inl.gov. INL/EXT-15-35584 15-50317
You can also read