Web-based macroseismic intensity study in Turkey - entries on Ek si Sözlük
←
→
Page content transcription
If your browser does not render page correctly, please read the page content below
Research article
Geosci. Commun., 4, 69–81, 2021
https://doi.org/10.5194/gc-4-69-2021
© Author(s) 2021. This work is distributed under
the Creative Commons Attribution 4.0 License.

Web-based macroseismic intensity study in Turkey –
entries on Ekşi Sözlük
Deniz Ertuncay, Laura Cataldi, and Giovanni Costa
Department of Mathematics and Geosciences, University of Trieste, via E. Weiss 4, 34128 Trieste, Italy

Correspondence: Deniz Ertuncay (dertuncay@units.it)

Received: 15 June 2020 – Discussion started: 16 July 2020
Revised: 8 January 2021 – Accepted: 19 January 2021 – Published: 22 February 2021

Abstract. Ekşi Sözlük is one of the most visited websites           data may be collected continuously, as in EMSC and USGS,
in Turkey. Registered users of the website share their knowl-        and after a specific earthquake (Bossu et al., 2008, 2015;
edge about any topic. In this study, we collect the user entries     Goltz et al., 2020; Liang et al., 2017).
on the topic of 20 earthquakes in Turkey and the surround-              In Turkey, the Disaster and Emergency Management Presi-
ing area. Entries with city and district level information are       dency of Turkey (AFAD) is the only data collector for macro-
converted to intensity values. Shake maps of the earthquakes         seismic intensity. However, felt reports of AFAD are rare and
are created by using a ground motion to intensity conversion         lack location information. On the other hand, Turkish data
equation. User entries and created shake maps are compared.          providers were the seventh largest data providers (third in
It is found that entries correlate with the predicted intensities.   Europe) to the EMSC in 2018.
It is also found that local soil conditions and building types          Social media data are also used for earthquake science
have an amplifier effect on entries on the website. Several          (Crooks et al., 2013; Earle et al., 2010, 2012; Mendoza et al.,
entries on the earthquake topics have magnitude estimations.         2010; Robinson et al., 2013). Integration of multi-language
The difference between predicted and observed intensities            social media data provides additional information about the
also varies with distance. Users are able to predict the magni-      earthquake location in near-real time (Zielinski et al., 2012).
tudes of the earthquakes with ±0.54 misfit. This study shows         Twitter was used in the Sichuan earthquake to have rapid in-
that Ekşi Sözlük has the potential to be a reliable source of       formation about the earthquake (Li and Rao, 2010). In the
macroseismic intensity for the earthquakes in Turkey if the          2011 Tohoku earthquake, Twitter allowed the rapid spread of
felt reports are collected with a predetermined format.              information about the earthquake (Miyabe et al., 2012). Ara-
                                                                     postathis et al. (2018) revealed that intensity maps created
                                                                     using Twitter data had a high correlation with predicted in-
                                                                     tensity maps for the 2017 Lesbos earthquake. Fayjaloun et al.
1   Introduction                                                     (2020) integrated Twitter data with strong motion recordings
                                                                     to compare the felt area predicted by shake maps and real
Many national seismic data providers (ARSO, 2020; British            observations in France.
Geological Survey, 2020; Sbarra et al., 2010; Swiss Seis-               Internet users in Turkey are also sharing their experi-
mological Service, 2020; ZAMG, 2020), along with inter-              ences of earthquakes in other websites such as Ekşi Sözlük
national organizations (European-Mediterranean Seismolog-            (https://eksisozluk.com/, last access: 17 February 2021). Ekşi
ical Centre, EMSC; Bossu et al., 2017; United States Geo-            Sözlük is a collaborative dictionary. To be a full member of
logical Survey, USGS; Wald et al., 2012) collect web-based           the website, newly registered users are required to write 10
macroseismic survey data. Various questions are asked, in            entries on existing topics. Then, the entries are analyzed ac-
the form of a questionnaire, to individuals who are willing          cording to the rules of the site. By doing that, Ekşi Sözlük
to share their experience after an earthquake. The answers           provides relatively reliable information to the visitors. It was
are then converted to macroseismic intensity scales, and felt        the 14th most visited website in Turkey in 2019 (Alexa Inter-
maps are created as an end product of the earthquake. The

Published by Copernicus Publications on behalf of the European Geosciences Union.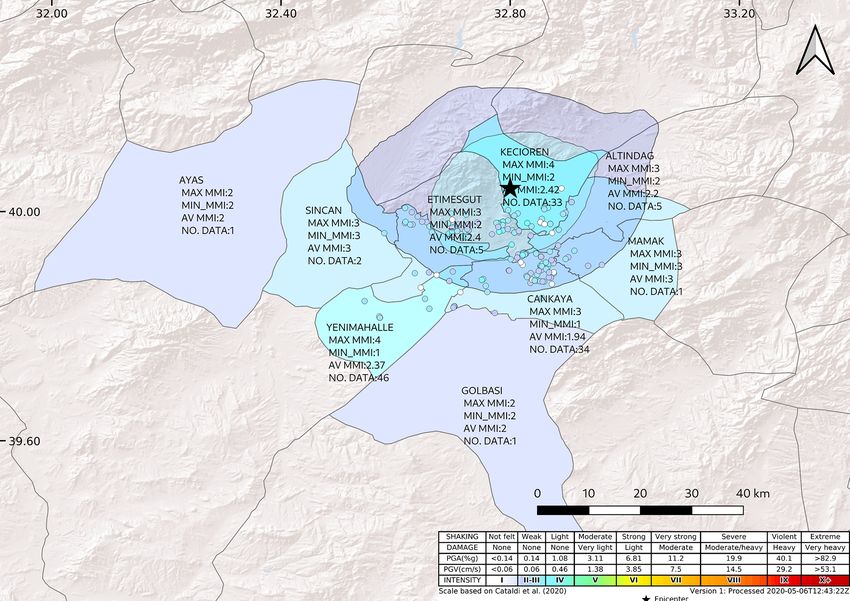
70                                                       D. Ertuncay et al.: Web-based macroseismic intensity study in Turkey

net, 2020). Even though there are entries in other languages,          When an aftershock is felt, the entries indicate the exis-
the main language used on the website is Turkish. Users of          tence of an aftershock. In these cases, we subdivided the
the website create topics on earthquakes that they have felt        earthquake into multiple earthquakes by adding a number to
and also for major earthquakes occurring around the world.          the end of the topicID. Several MCS labels, along with the
   In this study, we collect entries from various major earth-      entry, can be seen as follows:
quakes in western Turkey. Entries that provide city and dis-
trict information are analyzed. Macroseismic intensity maps              Topic: 20-aralik-2018-yalova-depremi–5881852
are created for the earthquakes by using the magnitude infor-            Entry: “I felt it in Gebze (Kocaeli) but I was the only
mation. Analyzed entries are compared with predicted inten-              one.
sities. Furthermore, we collect the magnitude guesses of the
users and compare them with the real results.                            Lights are not swinging; none of my family members
                                                                         have felt it.”
2    Data
                                                                         I (MCS): 1
Earthquake information of the origin time, magnitude, lat-               Topic: 20-subat-2019-canakkale-depremi–5947040
itude, longitude, and depth of the events is gathered from
EMSC and the Kandilli Observatory and Earthquake Re-                     Entry: “I felt it strongly. I think it was M4.4 . . .
search Institute Regional Earthquake-Tsunami Monitoring
                                                                         I (MCS): 2
Center. This information is used for the creation of the shake
map (Sect. 3) and calculation of the distance between the epi-           Topic: 30-kasim-2018-yalova-depremi–5861331
center and districts of the entries.
   To analyze the entries in the earthquake topics, 20 titles            Entry: “I thought my neighbor downstairs hit the ceiling
with the highest number of entries for earthquakes that have             of their apartment with a hammer . . . ”
occurred in western Turkey and the surrounding area are se-
                                                                         I (MCS): 3
lected (Table 1). Western Turkey is chosen due to higher
numbers of people with access to the internet (Turkish Sta-              Topic: 26-eylul-2019-istanbul-depremi–6191375
tistical Institute, 2019). Entries that provide location infor-
mation in district levels are filtered. These entries are labeled        Entry: “We saw the rattling windows not only in our
according to the modified Mercalli–Cancani–Sieberg (MCS)                 office building but also in the neighboring building. I
scale (Sieberg, 1930). The MCS scale is a way of describing              tried to walk forward, but instead I staggered backwards
the effect of an earthquake, and the intensity of an earthquake          ...”
can be determined for a site of interest. Unlike the magni-
                                                                         I (MCS) 4
tude of an earthquake, the intensity value (I ) can be differ-
ent depending on various parameters such as epicentral dis-              Topic: 6-subat-2017-canakkale-depremi–5296414
tance, local soil conditions, and building type. For instance,
I (MCS) class 1, which is the lowest class, means that the               Entry: “We felt it strongly. We evacuated the office
earthquake is not felt, except by very few under especially              building.”
favorable conditions, whereas class 12, which is the highest
                                                                         I (MCS): 5
class, means a total destruction. Several entries also provide
a guess from the user about the magnitude of the earthquake.             Topic: 26-eylul-2019-istanbul-depremi–6191375
   Topics are created right after the origin time of the earth-
quake (Table 1). Since the website does not provide the time             Entry: “I was at Avcılar. I saw debris falling from a
information precisely to the second in the entries, we do not            building . . . ”
exactly know the time gap between the origin time of the
                                                                         I (MCS): 6
earthquake and the creation time of the topic. However, al-
most all topics that we analyzed are created either during the         Hereafter, earthquakes are represented by their topicID. In
same minute as the origin time or a minute later. Several top-      Table 2, we present information about the entries. Thread
ics are created for some earthquakes that are widely felt in        5392358 is excluded from further analysis due to lack of en-
many regions. Moderators of the website combine the topics          tries.
into the proper topic title, which is generally the date of the
earthquake and the nearest major city, or sea, to the epicenter.
Topics are created with the same format, which is as follows:
      10-aralik-2019-balikesir-depremi–6277350
      day-month-year-location-earthquake–topicID

Geosci. Commun., 4, 69–81, 2021                                                             https://doi.org/10.5194/gc-4-69-2021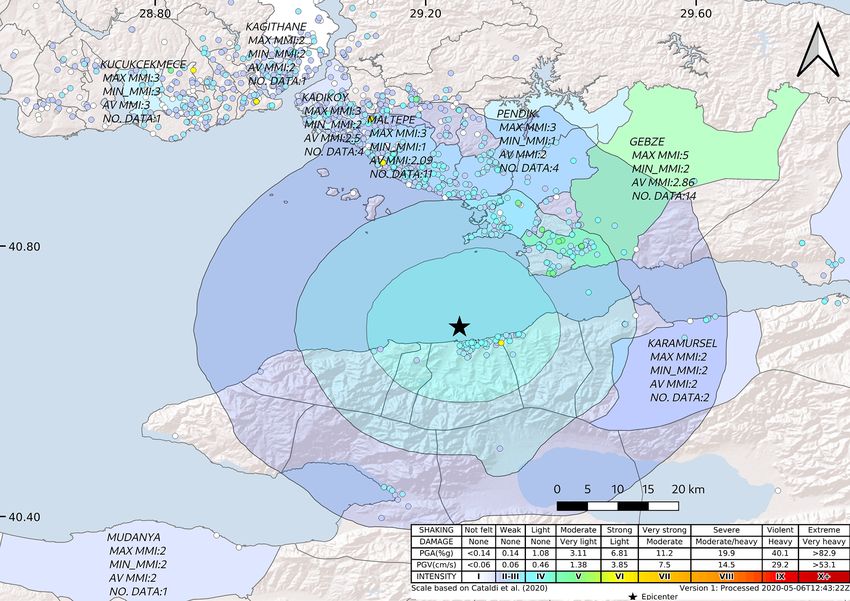
D. Ertuncay et al.: Web-based macroseismic intensity study in Turkey                                                                        71

Table 1. Topics of various earthquakes on the Ekşi Sözlük site. The first entry, additionally, gives the information of the creation time (with
the date, given as dd/mm/yyyy, and the time stamp of the entry in universal coordinated time) of the topic. 1t is the time between the origin
time of the earthquake and the creation of the topic of the earthquake. Entries under the first entry do not provide the seconds in the time
stamp. Magnitudes are moment magnitude (Mw ), unless otherwise stated.

    Topic                                        Origin time           First entry           1t     Magnitude      Event       Event    Depth
                                                                                           (min)                 latitude   longitude    (km)
    19-mayis-2011-simav-depremi–2814519          19/05/2011 20:15:22   19/05/2011 20:15      ≤1     5.7            39.14        29.1        8
    7-haziran-2012-tekirdag-depremi–3418720      06/07/2012 20:54:26   06/07/2012 20:55      ≤1     5.1            40.85       27.92       14
    8-ocak-2013-ege-denizi-depremi–3673799       01/08/2013 16:16:06   01/08/2013 16:17      ≤1     5.7            39.65       25.48      8.4
    16-kasim-2015-istanbul-depremi–4966334       16/11/2015 15:45:43   16/11/2015 15:46      ≤1     3.9            40.83       28.76      7.7
    25-haziran-2016-yalova-depremi–5137587       25/06/2016 05:40:11   25/06/2016 05:41      ≤1     4.1             40.7       29.21        9
    15-ekim-2016-istanbul-depremi–5208242        15/10/2019 08:18:32   15/10/2019 08:19      ≤1     4.9            42.19       30.71       10
    6-subat-2017-canakkale-depremi–5296414       02/06/2017 03:51:39   02/06/2017 03:54      >1     5.3            39.56       26.02        6
    6-subat-2017-canakkale-depremi–5296414-2     02/06/2017 10:58:00   02/06/2017 10:59      ≤1     5.1            39.51       26.07        6
    12-haziran-2017-izmir-depremi–5388936        06/12/2017 12:28:39   06/12/2017 12:29      ≤1     6.2            38.85       26.35       10
    17-haziran-2017-izmir-depremi–5392358        17/06/2017 03:40:36   17/06/2017 03:42      >1     4.6            38.91       26.22        9
    17-haziran-2017-izmir-depremi–5392358-2      17/06/2017 19:50:04   17/06/2017 19:54      >1     5.2            38.85       26.44        7
    30-kasim-2018-yalova-depremi–5861331         30/11/2018 02:36:35   30/11/2018 02:37      ≤1     4              40.58       28.98        9
    20-aralik-2018-yalova-depremi–5881852        20/12/2018 06:34:25   20/12/2018 06:35      ≤1     4.4             40.6       29.97        8
    25-ocak-2019-izmir-depremi–5919561           25/01/2019 20:20:33   25/01/2019 20:21      ≤1     4.2            38.58        27.1       18
    20-subat-2019-canakkale-depremi–5947040      20/02/2019 18:23:27   20/02/2019 18:24      ≤1     5              39.62       26.43        8
    8-agustos-2019-izmir-depremi–6135297         08/08/2019 08:39:07   08/08/2019 08:39      ≤1     4.6            38.02       26.85        6
    20-agustos-2019-ankara-depremi–6148327       20/08/2019 02:07:35   20/08/2019 02:08      ≤1     3.2 (Ml )      39.89       33.04       10
    25-agustos-2019-ankara-depremi–6155192       25/08/2019 18:42:26   25/08/2019 18:42      ≤1     3.5 (Ml )      40.04        32.8        5
    24-eylul-2019-istanbul-depremi–6189374       24/09/2019 08:00:22   24/09/2019 08:00      ≤1     4.5            40.88       28.21        4
    26-eylul-2019-istanbul-depremi–6191375       26/09/2019 10:59:24   26/09/2019 11:00      ≤1     5.6            40.88       28.21        5
    10-ekim-2019-yalova-depremi–6208576          10/10/2019 16:52:03   10/10/2019 16:52      ≤1     4              40.68       29.25     13.9
    10-ekim-2019-yalova-depremi–6208576-2        10/10/2019 17:04:39   10/10/2019 17:04      ≤1     3.1 (Ml )       40.7       29.26        5
    10-ekim-2019-yalova-depremi–6208576-3        10/10/2019 17:09:40   10/10/2019 17:10      ≤1     3.3 (Ml )       40.7       29.25        2
    10-ekim-2019-yalova-depremi–6208576-4        10/10/2019 19:32:07   10/10/2019 19:32      ≤1     3.7 (Ml )      40.69       29.26       12
    10-aralik-2019-balikesir-depremi–6277350     12/10/2019 20:14:02   12/10/2019 20:15      ≤1     4.6            39.45       29.93        8
    10-aralik-2019-balikesir-depremi–6277350-2   12/10/2019 20:24:05   12/10/2019 20:24      ≤1     4.3            39.44       29.91     11.3
    10-aralik-2019-balikesir-depremi–6277350-3   12/10/2019 20:46:18   12/10/2019 20:47      ≤1     4              39.44        29.9     14.3

3     Method                                                              naïve Bayes (GNB) classifiers. This methodology provides
                                                                          a full probability distribution over integer intensity classes.
                                                                          In other words, for each input parameter value, the proba-
For each event, analyzed entries are compared with refer-                 bility of occurrence is calculated for I classes. The intensity
ence instrumental intensity values. Instrumental intensity is             forecast is then taken as the class with the highest associated
a forecast of the macroseismic intensity and is calculated as             probability.
a function of input ground motion parameters. Instrumental                   Second, a piece-wise function, relating ground motion val-
intensity is defined following the methodology from Cataldi               ues to intensity, is extracted from the GNB results obtained
et al. (2021).                                                            for the Italian data set, so that each forecasted I class is as-
   First, instrumental intensity is defined using an indepen-             sociated with a specific range of ground motion parameter
dent data set, relative to 90 events that occurred in Italy be-           values. For PGV and PGA, the used intervals are presented
tween 1972 and 2016, with the local magnitude over 3.4.                   in Table 3.
The definition consists of extracting an empirical relationship              As for the events reported in Table 1, PGV and PGA val-
between observed intensity and ground motion parameters,                  ues are calculated from information on seismic origins using
namely the peak ground velocity (PGV) and peak ground ac-                 ground motion prediction equations (GMPEs). GMPEs are
celeration (PGA). PGV and PGA are observed from ground                    a set of equations that allow us to predict the ground mo-
motion records. Integration and/or differentiation of the seis-           tion parameters based on various earthquake and site-related
mic record are done, depending on the seismic recorder, and               information. Values obtained through GMPEs are then as-
then the two parameters are measured. Ground motion pa-                   signed to the corresponding I class according to Table 3.
rameter values are extracted from the data set (Gallo et al.,             The PGA-based function is used for events with Mw < 5; the
2014) and are correlated with expert-assessed intensity val-              PGV-based one is used for events with Mw > 5.
ues taken from the Italian Macroseismic Database (Locati
et al., 2016). The regression is performed using Gaussian

https://doi.org/10.5194/gc-4-69-2021                                                                  Geosci. Commun., 4, 69–81, 2021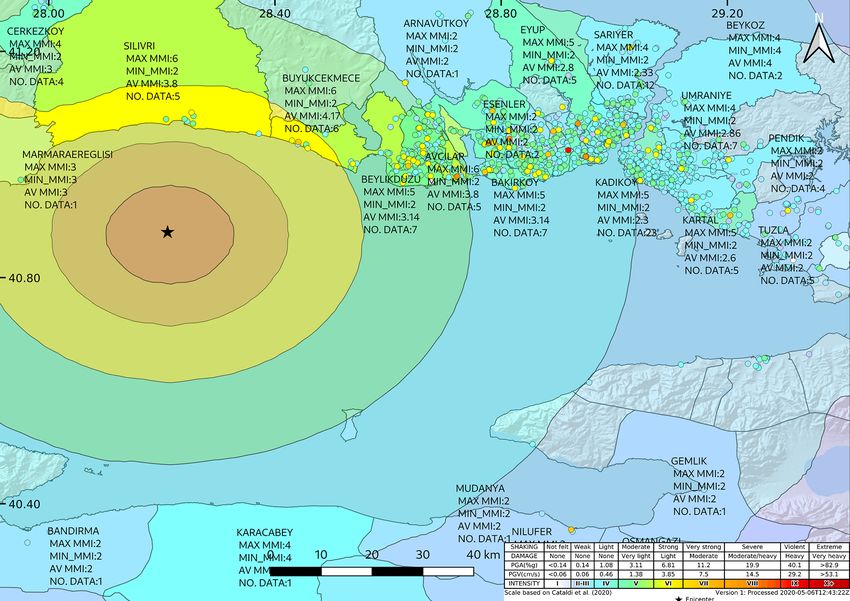
72                                                              D. Ertuncay et al.: Web-based macroseismic intensity study in Turkey

Table 2. Extracted information from entries of each topicID. The numbers of the entry, with the city and district information along with
the Mercalli–Cancani–Sieberg (MCS) scale value, are shown. The unique numbers of the cities and the districts of these cities are given,
respectively. The maximum MCS, minimum MCS, and average MCS of these entries, together with the entries with magnitude guesses,
regardless of location information, are also shown.

                                  topicID       No. of     No. of    No. of          Max        Min   Avg.   No. of
                                                 entry       city    district        MCS       MCS    MCS     mag
                                  2814519           78          11        37           5          2   2.65          2
                                  3418720           38           4        28           4          1   2.18          1
                                  3673799           73           6        33           4          2   2.30          3
                                  4966334           51           2        23           5          2   2.53          4
                                  5137587           85           5        21           4          1   2.68          6
                                  5208242           26           4        15           3          1   2.12          6
                                  5296414           20           6        14           4          1   2.10          0
                                  5296414-2         20           6        14           5          1   2.40          0
                                  5388936          151          12        60           6          1   2.26          9
                                  5392358            3           1         3           2          2   2.00          1
                                  5392358-2         46           7        22           5          1   1.98          9
                                  5861331           42           4        23           4          2   2.48          3
                                  5881852           53           4        27           4          1   2.21          2
                                  5919561           63           3        18           4          1   2.37         13
                                  5947040           62           7        38           4          1   1.90          5
                                  6135297          101           6        32           5          1   2.17         16
                                  6148327           30           1         6           4          1   2.87          7
                                  6155192          129           1         9           4          1   2.27          5
                                  6189374          152           5        41           5          1   2.59          9
                                  6191375          233          12        57           6          1   2.74          1
                                  6208576           68           3        18           5          1   2.15         15
                                  6208576-2         12           3        10           3          1   2.00          0
                                  6208576-3         25           2        12           2          1   1.96          0
                                  6208576-4         29           3        10           3          1   2.10          2
                                  6277350           47           8        26           3          1   1.94         10
                                  6277350-2         19           7        13           5          1   2.16          1
                                  6277350-3         10           3         8           5          1   2.20          1

Table 3. Table of PGA and PGV value intervals for the calculation of I ; values are taken from Cataldi et al. (2021).

             I                              1     2        3         4           5         6          7        8            9        10
             PGAmin   (cm s−2 )                 0.32     1.91     6.31   17.78        52.48       85.11   141.25        269.15    575.44
             PGAmax (cm s−2 )       < 0.32      1.91     6.31    17.78   52.48        85.11      141.25   269.15        575.44   1148.15
             PGVmin (cm s−1 )                   0.01     0.10     0.28    0.74         2.57        5.75     9.77         21.38     39.81
             PGVmax (cm s−1 )       < 0.01      0.10     0.28     0.74    2.57         5.75        9.77    21.38         39.81    70.789

4    Results                                                                    4.1   Lesbos earthquake – 12 June 2017

All topics are analyzed with the methods explained in                           The Lesbos earthquake on 12 June 2017, Mw = 6.2, (topi-
Sects. 2 and 3. A total of four of them are represented in this                 cID – 5388936) occurred south of the Lesbos island and was
section. We compare the computed intensities with the en-                       felt largely in Turkey. Izmir is the closest city to epicenter of
tries, and we also compare them with the EMSC felt report                       the earthquake; thus, the topic is created as being the 12 June
maps. Furthermore, magnitude guesses are compared with                          2017 Izmir earthquake in Ekşi Sözlük. There are 151 entries
the measured magnitudes.                                                        with city and district information. The farthest felt entry is
                                                                                from the Pursaklar district (≈ 580 km) of Ankara (MCS is 1).
                                                                                The entry with the largest MCSs is from the Konak (≈ 80 km)
                                                                                and Karaburun districts (27 km) of Izmir and the Yunus Emre
                                                                                district (≈ 85 km) of Manisa (Fig. 1). In the Karaburun dis-

Geosci. Commun., 4, 69–81, 2021                                                                           https://doi.org/10.5194/gc-4-69-2021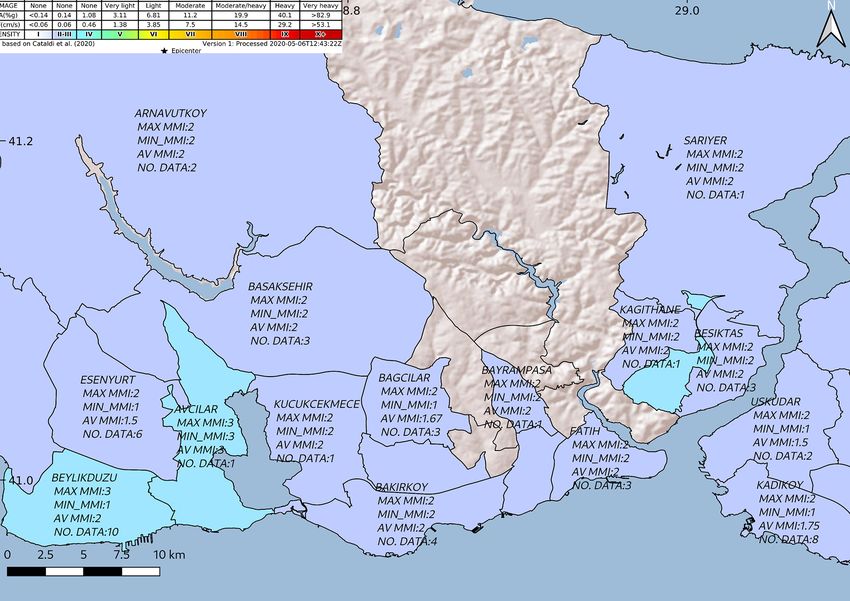
D. Ertuncay et al.: Web-based macroseismic intensity study in Turkey                                                                        73

Figure 1. Intensity map of the 12 June 2017 Lesbos earthquake with labeled entries. Entries are plotted to district level polygons since the
exact locations of the data providers are unknown. Felt reports of the earthquake submitted to EMSC are given at the top of the labeled entries
(created using QGIS).

trict, users were overbalanced during the earthquake, with                   There are 635 felt reports at AFAD for the earthquake. It
many others inside a government office. Cracks in the walls               is hard to interpret the data due to a lack of location infor-
and in the columns of the buildings are reported in two en-               mation about the earthquake. There are intensity values of
tries. The intensity map has a strong correlation with the la-            11 in several reports, which is highly unlikely for magnitude
beled maximum MCS scale. Minimum MCSs are hard to in-                     6.2 earthquake. EMSC have 755 felt reports for the earth-
terpret since some of the entries contain only words, such as             quake (Fig. 1). Intensities in EMSC are larger than the ones
“strongly felt”, which are labeled as MCS being equal to 2.               in Ekşi Sözlük. There are I 5 reports in faraway cities, such
Such entries lowered the average MCSs. Hence, we preferred                as Istanbul and Sofia, which is an unlikely intensity for the
to rely on maximum MCS labels.                                            earthquake. Furthermore, there are various intensity 10+ re-
   A large amount of entries are written in Istanbul (Fig. 2).            ports in EMSC in Izmir. However, there is no report that sup-
Almost all districts of the city have maximum MCS of 2,                   ports such destruction in Izmir. Various masonry buildings
except Avcılar district which has 3. This can be linked to                have cracks in their walls but none of them have collapsed
the loose soil of the Avcılar district of Istanbul. The Avcılar           (9 Eylül report, Department of Engineering of Dokuz Eylul
district was affected by the Mw = 7.4 İzmit earthquake of                University, 2017).
1999. More than 10 % of the buildings were either destroyed
or damaged in the earthquake (Tezcan et al., 2002). It is due             4.2   Ankara earthquake – 25 August 2019
to the amplified shaking and soft sediments in the district
(Tezcan et al., 2002; Ergin et al., 2004; Akarvardar et al.,              The Ankara earthquake on 25 August 2018, Ml = 3.5, (top-
2009).                                                                    icID – 6155192) occurred south of the Keçiören district of
                                                                          Ankara and was felt locally in the city (Fig. 3). There are

https://doi.org/10.5194/gc-4-69-2021                                                                 Geosci. Commun., 4, 69–81, 2021
74 D. Ertuncay et al.: Web-based macroseismic intensity study in Turkey
Figure 2. Intensity map of 12 June 2017 Lesbos earthquake with labeled entries on the western side of Istanbul. Entries are plotted to district
level polygons (created using QGIS.)
129 entries with city and district information. The depth of damaged (Anadolu Agency, 2019). The earthquake provided
the earthquake is measured as being 5 km. Even though there the largest data set, with 233 comments with district level
are large number of magnitude 3.5 earthquakes in Turkey, information from 12 cities. This is due to the fact that Istan-
this was felt by many inhabitants since the hypocenter was bul is the most crowded city in Turkey, and the earthquake
located beneath the city of Ankara, and the earthquake had happened during the daytime (13:59 local time).
a shallow hypocentral depth. Due to the shallow depth, al- In Silivri, Büyükçekmece, and Avcılar districts, maximum
most all districts provided relatively higher maximum MCS MCS from the entries are labeled as 6. The intensity map pre-
values. dicts MCS 4.5 for the Avcılar district. Local soil conditions,
There is no felt report in AFAD for the earthquake. There as explained in Sect. 4.1, may have a role on the exaggerated
are 205 felt reports in EMSC (Fig. 3). The intensity measures intensities in the entries written in Avcılar.
on Ekşi Sözlük and from EMSC are highly correlated for the In the Beşiktaş district, a maximum MCS of 5 is given in
earthquake. three entries. All of them are due to the evacuation of the
buildings. A total of two of these entries are from high-rise
4.3 Istanbul earthquake – 26 September 2019 office buildings, which probably caused extra panic due to
the swaying of the tall buildings. The evacuation was also
The 26 August 2019 Istanbul earthquake, Mw = 5.6, (topi- influenced by panic and is also one of the reasons for the
cID – 6191375) occurred south of the Silivri district of Istan- maximum MCS of 5 that was given in the entries from the
bul and was felt largely in Istanbul and the surrounding cities Fatih, Beyoğlu, and Kadıköy districts. In the Kartal district,
(Fig. 3). There are 233 entries with city and district informa- MCS is 5 is due to objects falling from shelves.
tion. A minaret of a mosque in the Avcılar district of Istanbul
collapsed (Hürriyet, 2019) and more than 450 buildings were
Geosci. Commun., 4, 69–81, 2021 https://doi.org/10.5194/gc-4-69-2021D. Ertuncay et al.: Web-based macroseismic intensity study in Turkey 75
Figure 3. Intensity map of the 25 August 2019 Ankara earthquake with labeled entries. Entries are plotted to district level polygons. Felt
reports of the earthquake submitted to EMSC are at the top of the labeled entries (created using QGIS).
There are 70 felt reports in AFAD for the earthquake with are from the Kartal district of Istanbul and Gebze district of
a maximum intensity of 6, which is also the case on the Ekşi Kocaeli. In Gebze, the maximum MCS is 5, which is due to
Sözlük site. In EMSC (Fig. 4), there are 2027 felt reports. In the panicked evacuation of a building. The rest of the entries
Istanbul, intensities are reported slightly higher with respect in Gebze are claiming MCS levels of 2 and 3. The MCS scale
to Ekşi Sözlük reports. However, it is important to keep in is highly subjective and depends on an individual’s feelings
mind that felt reports in EMSC are designed for this pur- about earthquakes. Thus, users on the Ekşi Sözlük site are
pose, whereas in Ekşi Sözlük, the entries are written in a free writing their feelings without using any guidelines. As in this
format. In general, EMSC and Ekşi Sözlük are correlated in example, unexpectedly high MCSs may occur.
the Büyükçekmece and Avcılar districts. On the other hand, There is no felt report in AFAD records for the earthquake.
intensities are at least one grade lower in Ekşi Sözlük re- There are 1371 felt reports in EMSC records (Fig. 5). The in-
ports with respect to EMSC reports. There are large intensity tensity measures from Ekşi Sözlük users and EMSC records
values in cities such as Eskişehir (d >200 km) and Denizli are correlated for Gebze, Kartal, Kadıköy, and Kücükçek-
(d >350 km). Large intensities in such far away distances for mece districts. There are more data points in EMSC than in
a Mw = 5.6 earthquake are unlikely. Ekşi Sözlük, which provides more information about differ-
ent regions of the area, especially in the city of Yalova. There
4.4 Yalova earthquake – 10 October 2019 are several unexpectedly high intensity values for Istanbul in
EMSC.
The 10 October 2019 Yalova earthquake, Mw = 4.0, (topi-
cID – 6208576) occurred north of Yalova and was felt in Is-
tanbul and the surrounding cities (Fig. 5). There are 68 en-
tries with city and district information. Most of the entries
https://doi.org/10.5194/gc-4-69-2021 Geosci. Commun., 4, 69–81, 202176 D. Ertuncay et al.: Web-based macroseismic intensity study in Turkey
Figure 4. Intensity map of the 26 September 2019 Istanbul earthquake with labeled entries. Entries are plotted to district level polygons. Felt
reports of the earthquake submitted to EMSC are at the top of the labeled entries (created using QGIS).
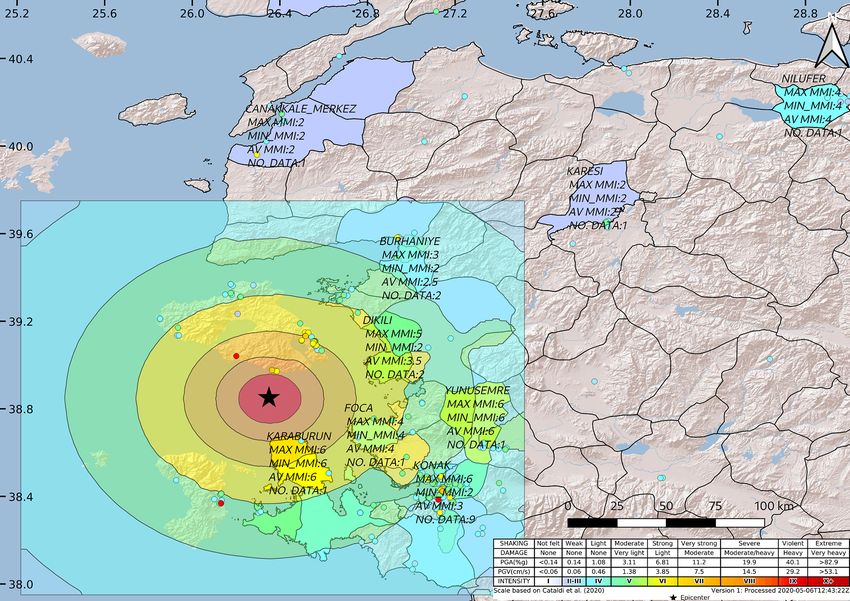
4.5 Magnitude guesses 5 Discussion and conclusion
Users on the Ekşi Sözlük site also provide magnitude in- In this study, we gather entries from earthquake topics on
formation that depends on their feelings. We include entries the Ekşi Sözlük site. In the threads, users discuss the earth-
without location information. In various entries, the magni- quake and their experiences. We filter the entries with city
tude is guessed at with a semi-infinite range, such as “. . . and district level information that can be converted to the
it was at least 4.8” for the 20 February 2019 Dardanelles MCS scale. When there is an aftershock, it is discussed in
earthquake (topicID – 5947040), or it is guessed within a full the same thread on the website. In such incidences, we di-
range, such as “. . . it is between 2–3 . . . ” for the 10 Decem- vide the topic into sub-topics.
ber 2019 Balıkesir earthquake (topicID – 6277350). In semi- In total, 27 earthquakes are chosen for the analysis. Inten-
definite guesses, the given edge value is considered. The av- sity maps are created for the earthquakes, and the correla-
erage of the range is used when it is provided. tion between the predicted intensities and the entries which
Measured magnitudes, along with the user guesses, can be were converted to intensity values are roughly interpreted.
seen in Fig. 6. The average misfit between the guessed mag- The values are mapped to the districts of Turkey due to lack
nitudes and measured magnitudes is 0.54. We also examine of precise location information. Interpretation is done over
the earthquakes with at least two guesses. Misfit is calcu- maximum MCSs. Uncertainty with respect to the data points
lated, and, again, it is 0.54. However, it is important to keep in terms of location varies, depending on the epicenter of the
in mind that guesses with a range are averaged, and various earthquake and the positioning of the governmental district.
guesses are semi-definite. To have an insight into the relation between the predicted
MCS and observed MCS, a rough relation between the two
parameters and the distance is analyzed. Observation points
Geosci. Commun., 4, 69–81, 2021 https://doi.org/10.5194/gc-4-69-2021D. Ertuncay et al.: Web-based macroseismic intensity study in Turkey 77
Figure 5. Intensity map of the 10 October 2019 Yalova earthquake with labeled entries. Entries are plotted to district level polygons. Felt
reports of the earthquake submitted to EMSC are at the top of the labeled entries (created using QGIS).
are labeled with their districts. However, the district is more
likely to have more than one intensity inside its border, de-
pending on the epicentral distance from the earthquake and
the border of the district (e.g., the Gebze district in Fig. 5 has
three different MCS values inside its border). To overcome
this problem, we have calculated the centroid point of each
district and treated the district as a point.
We have calculated the residuals of MCS differences be-
tween the predicted and observed values (Fig 7). To do that,
we binned the distance between the epicenter and the cen-
troid points with 10 km intervals from 0–100 km. We com-
bined more distant points with +100 km label. The weighted
average of the average MCSs are used for the residual calcu-
lations. Asymmetric errors are calculated by using the min-
imum and maximum MCS value for each bin and the pre-
dicted MCS. If all data points have the same MCSs, then the
Figure 6. Residuals of measured magnitudes of the earthquakes
errors are not calculated. A line is fitted to residuals when
(Table 1) with average magnitude guesses from users. Earthquakes more than one data point is associated in different bins.
without any guesses are blank (created using the Matplotlib library It is found that residuals tend to increase with increasing
of Python). distance. In longer distances, MCS values are more likely to
https://doi.org/10.5194/gc-4-69-2021 Geosci. Commun., 4, 69–81, 202178 D. Ertuncay et al.: Web-based macroseismic intensity study in Turkey Figure 7. Residuals of predicted and observed MCSs. Red dashed line represents the baseline. Black circles are the residual of the weighted average of the bin. Vertical black lines are the residuals from predicted MCSs and minimum and maximum MCSs that are observed in the bin. The black dotted line is the fitted line to the residual of weighted averages. The number of data points inside the bins is provided beneath each bin point with data (created using Matplotlib library of Python). be 1. When there is an entry which states the feeling of the the district, for which MCS value is one integer lower with earthquake, it is more likely to have MCS value of 2. This is respect to the highly populated coastal area. due to the fact that it is hard to distinguish between MCS 1 The 10 October 2019 Yalova earthquake aftershocks and MCS 2 by analyzing the entries. A lack of resolution in (6208576-2, 6208576-3, and 6208576-4) mostly have MCS 1 terms of expression of the experience limits our distinction for the residuals. The cities of Istanbul and Kocaeli have levels of intensity. The website is not dedicated to providing many reports for which the MCS is equal to 2. However, all exact information on earthquakes. the centroid points of the districts are in the area for which Furthermore, the population distribution of districts is MCS is 1. mostly heterogeneous. An example can be seen in Sect. 4.3. Despite not having the exact location and having to work The Silivri district of Istanbul has all of the EMSC data from with the subjective feelings of the users, it is found that the the coastline. However, it is located in the northern part of districts with loose soils have relatively bigger maximum Geosci. Commun., 4, 69–81, 2021 https://doi.org/10.5194/gc-4-69-2021
D. Ertuncay et al.: Web-based macroseismic intensity study in Turkey                                                                   79

MCS values. The Avcılar district in Istanbul has the highest         Future work
MCS value (3) for the Lesbos earthquake (Sect. 4.1) in the
city. In the Istanbul earthquake (Sect. 4.3), Avcılar also has       The Ekşi Sözlük site has the potential to provide a wide va-
the highest MCS (6) with respect to other districts with the         riety of information through collaboration with the scientific
same epicentral distance. The Avcılar district suffered during       community. The fast response time of the users may be useful
the 1999 İzmit earthquake due to the amplified shaking and          for having early information about the intensity distribution.
soft sediments in the district (Tezcan et al., 2002; Ergin et al.,   In case of a collaboration, a questionnaire can be embedded
2004; Akarvardar et al., 2009).                                      for use with the earthquake topics, which would homogenize
   Entries that are written from high-rise buildings showed          the data that users write as entries. Depending on the privacy
that the users were affected more due to the tendency of these       policy of the website and the allowance of a higher preci-
buildings to amplify the motions over longer periods (e.g.,          sion data in terms of location and building information of the
the Beşiktaş district during the Istanbul earthquake). Another     users, high-resolution intensity maps can be created.
reason for the higher intensities experienced, with respect to
the predicted ones, is the stress experienced during the evac-
                                                                     Code and data availability. Python codes, data set, and intensity
uation of buildings (even if it is not necessary to evacuate).
                                                                     maps can be found at https://doi.org/10.5281/zenodo.3947832
There are unexpectedly high intensity values in various dis-         (Ertuncay et al., 2020b). GIS data can be found at
tricts for both Istanbul and Yalova earthquakes.                     https://doi.org/10.6084/m9.figshare.12424352 (Ertuncay et al.,
   For the Ankara earthquake on 20 August 2019 (6148327),            2020a).
there is a large gap between the predicted and observed
MCSs. This is due to the fact that the people of the city of
Ankara are not as used to feeling earthquake as people in            Author contributions. DE analyzed the entries on the Ekşi Sö-
seismically active cities such as Izmir, Istanbul, and Yalova.       zlük website and determined the intensity values. LC created shake
Moreover, the epicenter of the earthquake was close to the           maps, and DE visualized the intensity values collected from Ekşi
city center.                                                         Sözlük and EMSC to create the figures. Results were interpreted by
   The effect of epicentral depth in small earthquakes can           DE, LC, and GC.
be seen in the reports following the Ankara earthquake
(Sect. 4.2). The districts of Sincan, Yenimahalle, Mamak,
and Çankaya have at least a one degree higher maximum                Competing interests. The authors declare that they have no con-
MCS than the predicted ones.                                         flict of interest.
   We also analyzed the magnitude guesses in entries with the
measured magnitudes. The users of the website try to guess
                                                                     Acknowledgements. We would like to thank to Enrico Magrin,
the magnitudes, most probably by comparing their experi-
                                                                     who was a part of SeisRaM working group of the Department of
ences to previous earthquakes. Users living in seismically ac-       Mathematics and Geosciences at the University of Trieste (now at
tive regions such as Istanbul, Dardanelles, and Izmir are more       Istituto Nazionale di Oceanografia e di Geofisica Sperimentale),
likely to feel more earthquakes that occurred at different epi-      for his help in the calculation of the intensities, and Hafize Başak
central distances and magnitudes. On the other hand, users           Bayraktar, from the University of Napoli Federico II Department
living in regions with lower seismicity, e.g., Ankara, do not        of Structures for Engineering and Architecture, for sharing district
have large number of experiences and may think that, when            level polygons of Turkey. We also would like to thank all the users
they feel an earthquake, it must be a major one since they           of Ekşi Sözlük for sharing their experiences on the website. Finally,
do not know the feeling of low-magnitude earthquake. Even            we would like to thank Selen Caner Ertuncay for proofreading the
though there are good matches in some of the earthquakes, in         paper.
most of the cases magnitudes are guessed with 0.54 misfit.
   In conclusion, entries on the Ekşi Sözlük site can provide
intensity distributions of earthquakes with limits. Entries are      Review statement. This paper was edited by Ed Hawkins and re-
                                                                     viewed by two anonymous referees.
written in free form, which creates uncertainties in the MCS
labeling process. Entries do not reveal the exact position of
the data provider, which makes it hard to analyze the differ-
ences between observed and predicted MCS values. Despite
                                                                     References
the limitations, the gathered data have similarities with the
predictions. The website can provide near-real-time intensity
                                                                     Agencija Republike Slovenije Za Okolje – ARSO: Environmental
information after an earthquake.                                       Agency of the Republic of Slovenia, available at: http://www.
                                                                       arso.gov.si/potresi/vprašalnik/ (last access: 17 February
                                                                       2021), 2020.
                                                                     Akarvardar, S., Feigl, K. L., and Ergintav, S.: Ground deformation
                                                                       in an area later damaged by an earthquake: Monitoring the Av-

https://doi.org/10.5194/gc-4-69-2021                                                             Geosci. Commun., 4, 69–81, 2021
80 D. Ertuncay et al.: Web-based macroseismic intensity study in Turkey cilar district of Istanbul, Turkey, by satellite radar interferometry Gallo, A., Costa, G., and Suhadolc, P.: Near real-time automatic mo- 1992–1999, Geophys. J. Int., 178, 976–988, 2009. ment magnitude estimation, B. Earthq. Eng., 12, 185–202, 2014. Alexa Internet: Top Websites Ranking, available at: https://www. Goltz, J. D., Park, H., Quitoriano, V., and Wald, D. J.: Human similarweb.com/top-websites/turkey, last access: 10 June 2020. Behavioral Response in the 2019 Ridgecrest, California, Earth- Anadolu Agency: Istanbul’da 5.8 büyüklügünde de- quakes: Assessing Immediate Actions Based on Data from “Did prem, available at: https://www.aa.com.tr/tr/turkiye/ You Feel It?”, B. Seismol. Soc. Am., 110, 1589–1602, 2020. istanbulda-5-8-buyuklugunde-deprem/1594875 (last access: Hürriyet: Fuat Oktay’dan Istanbul depremi sonrası önemli açık- 17 February 2021), 2019 (in Turkish). lamalar, available at: https://www.hurriyet.com.tr/gundem/fuat- Arapostathis, S. G., Lekkas, E., Kalabokidis, K., Drakatos, G., Xan- oktaydan-istanbul-depremi-sonrasi-onemli-aciklamalar- thopoulos, G., Spyroy, N., and Kalogeras, I.: Developing seismic 41338943 (last access: 17 February 2021), 2019 (in Turkish). intensity maps from twitter data, the case study of Lesvos Greece Li, J. and Rao, H. R.: Twitter as a rapid response news service: 2017 earthquake: Assessments, improvements and enrichments An exploration in the context of the 2008 China earthquake, The on the methodology, Int. Arch. Photogramm., XLII-3/W4, 59– Electronic Journal of Information Systems in Developing Coun- 66, 2018. tries, 42, 1–22, 2010. Bossu, R., Mazet-Roux, G., Douet, V., Rives, S., Marin, S., and Liang, W.-T., Lee, J.-C., Chen, K. H., and Hsiao, N.-C.: Citizen Aupetit, M.: Internet users as seismic sensors for improved earthquake science in Taiwan: from science to hazard mitigation, earthquake response, Eos, Transactions American Geophysical Journal of Disaster Research, 12, 1174–1181, 2017. Union, 89, 225–226, 2008. Locati, M., Camassi, R. D., Rovida, A. N., Ercolani, E., Bernar- Bossu, R., Laurin, M., Mazet-Roux, G., Roussel, F., and Steed, dini, F. M. A., Castelli, V., Caracciolo, C. H., Tertulliani, R.: The importance of smartphones as public earthquake- A., Rossi, A., Azzaro, R., D’Amico, S., Conte, S., and Roc- information tools and tools for the rapid engagement with eye- chetti, E.: DBMI15, the 2015 version of the Italian Macroseis- witnesses: A case study of the 2015 Nepal earthquake sequence, mic Database, Istituto Nazionale di Geofisica e Vulcanologia, Seismol. Res. Lett., 86, 1587–1592, 2015. https://doi.org/10.6092/INGV.IT-DBMI15, 2016. Bossu, R., Landès, M., Roussel, F., Steed, R., Mazet-Roux, G., Mar- Mendoza, M., Poblete, B., and Castillo, C.: Twitter under crisis: Can tin, S. S., and Hough, S.: Thumbnail-based questionnaires for the we trust what we RT?, in: Proceedings of the first workshop on rapid and efficient collection of macroseismic data from global social media analytics, 25 July 2010, Washington, D.C., USA, earthquakes, Seismol. Res. Lett., 88, 72–81, 2017. 71–79, available at: http://snap.stanford.edu/soma2010/ (last ac- British Geological Survey: BGS E-Mail Earthquake Questionnaire, cess: 22 February 2021), 2010. available at: http://www.earthquakes.bgs.ac.uk/questionnaire/ Miyabe, M., Miura, A., and Aramaki, E.: Use trend analysis of EqQuestIntroA.html, last access: 10 June 2020. twitter after the great east japan earthquake, in: Proceedings Cataldi, L., Tiberi, L., and Costa, G.: Estimation of MCS intensity of the ACM 2012 conference on Computer Supported Cooper- for Italy from high quality accelerometric data, using GMICEs ative Work Companion, 11–15 February 2012, Seattle, Wash- and Gaussian Naïve Bayes Classifiers, B. Earthq. Eng., in press, ington, USA, 175–178, available at: https://dl.acm.org/action/ 2021. showFmPdf?doi=10.1145/2145204 (last access: 22 February Crooks, A., Croitoru, A., Stefanidis, A., and Radzikowski, J.: Earth- 2021), 2012. quake: Twitter as a distributed sensor system, T. GIS, 17, 124– Robinson, B., Power, R., and Cameron, M.: A sensitive twit- 147, 2013. ter earthquake detector, in: Proceedings of the 22nd interna- Department of Engineering of Dokuz Eylul University: 12 Hazi- tional conference on world wide web, 13–17 May 2013, Rio de ran 2017 Izmir Karaburun (Ege Denizi) Depremi Değerlendirme Janeiro, Brazil, 999–1002, available at: https://dl.acm.org/action/ Raporu, available at: http://www.jeofizik.org.tr/resimler/ekler/ showFmPdf?doi=10.1145/2487788 (last access: 22 February 74cb68517e1d6f3_ek.pdf?tipi=1&turu=H&sube=4 (last access: 2021), 2013. 17 February 2021), 2017 (in Turkish). Sbarra, P., Tosi, P., and De Rubeis, V.: Web-based macroseismic Earle, P., Guy, M., Buckmaster, R., Ostrum, C., Horvath, S., and survey in Italy: Method validation and results, Nat. Hazards, 54, Vaughan, A.: OMG earthquake! Can Twitter improve earthquake 563–581, 2010. response?, Seismol. Res. Lett., 81, 246–251, 2010. Sieberg, A.: Scala MCS (Mercalli-Cancani-Sieberg), Geologie der Earle, P. S., Bowden, D. C., and Guy, M.: Twitter earthquake de- Erdbeben, Handbuch der Geophysik, 2, 552–555, 1930. tection: earthquake monitoring in a social world, Ann. Geophys., Swiss Seismological Service: Did You Feel an Earthquake? Re- 54, 6, https://doi.org/10.4401/ag-5364, 2012. port an Earthquake, available at: http://www.seismo.ethz.ch/en/ Ergin, M., Özalaybey, S., Aktar, M., and Yalcin, M.: Site amplifica- earthquakes/did-you-feel-an-earthquake/, last access: 10 June tion at Avcılar, Istanbul, Tectonophysics, 391, 335–346, 2004. 2020. Ertuncay, D., Cataldi, L., and Costa, G.: GISdata, figshare, Tezcan, S. S., Kaya, E., Bal, I. E., and Özdemir, Z.: Seismic ampli- https://doi.org/10.6084/m9.figshare.12424352, 2020a. fication at Avcılar, Istanbul, Eng. Struct., 24, 661–667, 2002. Ertuncay, D., Cataldi, L., and Costa, G.: Dataset and Software, Zen- Turkish Statistical Institute: Information and Communication Tech- odo, https://doi.org/10.5281/zenodo.3947832, 2020b. nology (ICT) Usage in Households and by Individuals, available Fayjaloun, R., Gehl, P., Auclair, S., Boulahya, F., Marthe, at: http://www.turkstat.gov.tr/PreTablo.do?alt_id=1028 (last ac- S. G., and Roulle, A.: Integrating strong-motion record- cess: 10 June 2020), 2019. ings and Twitter data for a rapid shakemap of macro- Wald, D. J., Quitoriano, V., Worden, C. B., Hopper, M., and Dewey, seismic intensity, Int. J. Disast. Risk Re., 52, 101927, J. W.: USGS “Did You Feel It?”, internet-based macroseismic https://doi.org/10.1016/j.ijdrr.2020.101927, 2020. Geosci. Commun., 4, 69–81, 2021 https://doi.org/10.5194/gc-4-69-2021
D. Ertuncay et al.: Web-based macroseismic intensity study in Turkey                                                                 81

  intensity maps, Ann. Geophys., 54, 6, https://doi.org/10.4401/ag-   Zielinski, A., Bügel, U., Middleton, L., Middleton, S., Tokarchuk,
  5354, 2012.                                                           L., Watson, K., and Chaves, F.: Multilingual analysis of
Zentralanstalt für Meteorologie und Geodynamik – ZAMG: Cen-             twitter news in support of mass emergency events., in:
  tral Institute for Meteorology and Geodynamics of Austria, avail-     ISCRAM, Citeseer, Hershey, Pennsylvania, USA, 77–85,
  able at: https://www.zamg.ac.at/cms/de/geophysik/bebenbericht/        https://doi.org/10.4018/jiscrm.2013010105, 2012.
  index.php, last access: 10 June 2020.

https://doi.org/10.5194/gc-4-69-2021                                                            Geosci. Commun., 4, 69–81, 2021
You can also read